Wednesday, September 10, 2014

The Independent Prosecco, ovvero il Prosecco secondo Lapo (Elkann)


IndependentProsecco-singlebottle

Era ora, se ne sentiva proprio il bisogno! Era indispensabile e vitale che finalmente qualcuno pensasse a provare a sprovincializzare un prodotto locale come il Prosecco conosciuto solo nella Marca Trevigiana e dintorni e di cui non si vende una sola bottiglia al di fuori delle zone di produzione, tanto meno all’estero!

Ci voleva assolutamente, non ci aveva ancora pensato nessuno…, “un nuovo progetto” che avesse “l’obiettivo ambizioso di affermarsi sui principali mercati internazionali, facendo leva sui valori più profondi della lunga tradizione italiana nel beverage”. Un prodotto che coniugasse – non fateci caso, sono formule di prammatica che vanno sempre bene nella comunicazione e nel marketing… – “tradizione e innovazione. Forma e contenuto”.

Dirò di più, come è stato brillantemente e soprattutto in modo nuovo e originale scritto nella comunicazione di questa “joint venture – evento”, che fosse espressione, ma guarda te la novità, dello “stile made in Italy”, di innovazione: “la tradizione vinicola e il know how produttivo si uniscono alla ricerca in campo tecnologico, fondendo storia e futuro”. E conferendo al vino un carattere unico, nuovo, impensato, dove, fate attenzione, “l’effervescenza conferisce al Prosecco un tocco inaspettato, inconfondibile. Vivacità delle bollicine e note di gusto si uniscono per creare un vino dalla forte personalità”.


IndependentLapo

Ad avere questa brillante idea di dare vita ad una comunicazione “inedita” per un vino che avrà il suo vernissage a metà settembre a Milano, durante la settimana della moda, sono stati un produttore proprietario di 300 ettari vitati, Fantinel di Tauriano Pordenone, e quel personaggio straordinario genio e sregolatezza, che se non esistesse bisognerebbe inventarlo, che corrisponde al nome di Lapo Elkann, manager e imprenditore italiano e nipote del mitico avvocato Gianni Agnelli.

Insieme hanno creato The Independent Prosecco, ovvero “le migliori uve glera di casa Fantinel vestite dal brand di creatività e stile” rappresentata da Lapo e dalla sua società Italia Independent lanciata nel 2007, “un brand di creatività e stile per persone indipendenti che coniuga fashion e design, tradizione e innovazione”, che sinora si è fatta notare per la creazione di stravaganti occhiali.

Ovvero, per utilizzare il linguaggio immaginifico che la caratterizza, una società che “attualizza il Made in Italy e reinterpreta le icone classiche, operando nell’eyewear e realizzando prodotti lifestyle, appartenenti ai settori più diversi, per esportare lo stile italiano in un mondo globale”.


IndependentProsecco2

Ovviamente The Independent Prosecco sarà un “Millesimato e single-vineyard”, frutto “della selezione delle migliori uve provenienti dalla Tenuta Fantinel a Tauriano di Spilimbergo, nel cuore delle Grave del Friuli in una zona naturalmente vocata alla produzione di spumanti di eccezionale qualità e dal lungo affinamento”.

E per conquistare finalmente il mondo alla causa del Prosecco, Independent Prosecco, “il lato più spumeggiante di un classico”, sarà “un Prosecco Limited Edition, che si presenta con un inconfondibile look Italia Independent, caratterizzato dalla fantasia pied de poule della sua etichetta, di colore nero profondo, sulla quale campeggia il logo di Italia Independent”.

Un prodotto, ci rassicurano, “destinato a mettere d’accordo i palati più raffinati e i gusti più sofisticati”, che sarà distribuito in tutto il mondo a partire dal 19 settembre, e verrà venduto on-line alla cifra ragguardevole di 12 euro (prezzo in prenotazione) tramite il sito internet The Independent Prosecco in collaborazione con un’enoteca on line. Si tratterà di un millesimo 2012, scelta che, assicurano in Fantinel, “deriva da una filosofia produttiva ben precisa, volta a proporre uno spumante maturo, di ottimo corpo e dalla notevole complessità aromatica”.


IndepedentProsecco1

Abbiamo scherzato ovviamente, e per quanto dall’azienda e dal fantasioso rampollo di casa Agnelli siano partiti comunicati in stile roboante, caratterizzati da un linguaggio ricco di iperboli – “The Independent Prosecco intende unire i valori intrinseci di Italia Independent, quali tradizione, innovazione, stile Made in Italy e vocazione alla globalità all’alto sapere vitivinicolo di Fantinel. Questo progetto dimostra come I-I sia un brand di lifestyle a 360 gradi” così commenta Lapo Elkann, co-fondatore e Presidente di Italia Independent”, questo novello Prosecco che s’annuncia non rappresenta assolutamente nulla di nuovo.

Sarà un ennesimo Prosecco, commercializzato a due anni dalla vendemmia, con un nome e un’etichetta griffati e un prezzo superiore a quello di tanti Prosecco Conegliano Valdobbiadene Superiore Docg, “un prodotto destinato a mettere d’accordo i palati più raffinati e i gusti più sofisticati”, ci viene assicurato.

Va bene che, come dice il motto di Italia Independent e di Lapo, “essere indipendenti è scrivere ogni giorno la propria storia”, ma sarebbe bene, per essere credibili, restare con i piedi per terra, si tratta sempre e solo di un Prosecco, mica di una cuvée de prestige di Champagne, e non spacciare per nuove storie già scritte e riscritte, che di inedito non hanno proprio assolutamente nulla.
Anche se si vestono di parole trendy come look, globalità, brand, creatività, limited edition e know how produttivo. Nulla di nuovo sotto il sole, déjà vu…


onlyProsecco

See the original article >>

An Independent Scotland?

by John Mauldin

The United States is just starting to think about the upcoming elections (for whatever reason, the vast majority of people don’t focus on politics until after Labor Day), but there is another election happening “over the pond,” where the polls have just made everybody do a double-take. I am of course referring to the referendum on Scottish independence, which will be held next week. Voters opposing the measure were a clear majority for months, but their numbers began slipping a few weeks ago; and as of last few days the contest is basically even, with the election probably to be decided by the undecided.

A “yes” outcome would have significant ramifications not just for the United Kingdom but for all of Europe. Can a region of a country just decide it wants to be independent? You take a vote and that’s it? To everyone’s credit in the United Kingdom, they are being quite civilized about it. However, I imagine if Scotland votes to leave, the negotiations will be rather less cultured. There will be a big bill to be paid before everybody gets to leave the restaurant. Just who ran up what part of the tab over the last 300 years is an issue that has the potential to turn into a rowdy soccer – pardon me, football – match.

In today’s Outside the Box we explore a few aspects of the potential break-up. And not just what it would mean for the United Kingdom (it would not be good) but for all of Europe. Note that Spanish bonds are beginning to fall as people wonder what it might mean for Scotland to be allowed to declare independence. There are a couple regions in Spain that would very much like to do the same. And frankly, the Catalan region has a much better economic rationale for being on its own than Scotland does. (From this side of the pond, I cannot see what Scotland would have to gain economically from independence. They are a net consumer of taxes. But the whole independence thing is clearly about more than just economics, so this is one bar fight among friends where I think I’ll just retreat to my corner and watch.)

First, let’s look at a few comments from Bloomberg:

Spain’s government bonds fell, undermined by the Catalan region’s crescendoing push for independence, as polls 1,000 miles away in Scotland showed increased support for its own bid to break from the U.K.…

“It’s a question of raising the flag to more event risk,” Harvinder Sian, a fixed-income strategist at Royal Bank of Scotland Group Plc in London, said today by phone. “Where the U.K. government has decided to guarantee all government debt, the Catalonia region is too large for the rest of Spain to absorb. It’s a much more problematic issue for Spain with regard to its debt markets.”…

“If Catalonia were to become independent it would be a strong drag on Spain’s growth and doubts would resurface regarding the sustainability of Spanish public debt,” said Marius Daheim, a Munich-based senior fixed-income strategist at Bayerische Landesbank. “Liquidity rules.”

Today’s OTB features a piece by Stratfor’s George Friedman on the implications of an independent Scotland. Do the Belgians get to split their country in two? Which regions of Spain might move for independence? How about the Northern League in Italy? What about the rest of the world? Can parts of Ukraine simply take a vote and leave? Where does it end?

Then Anatole Kaletsky over at GaveKal thinks about the implications for British politics. You could have the odd situation of Scotland’s representatives in Parliament, who are overwhelmingly from the Labour Party, voting with a possible labor majority to put into place a very liberal policy agenda and then leaving Parliament after less than a year, which might then leave the Conservatives in the majority. Were those votes really legitimate if it was already known that Scotland was leaving? Exactly how does that work?

Before putting you in George and Anatole’s capable hands, let me offer two additional links, from opposite sides of the political spectrum. The first is from my friend Niall Ferguson, here, musing back in 2007 on the question of what it takes to make a nation-state. Then, I offer this link to Paul Krugman’s blog in the New York Times. Paul gets my vote for best line I’ve read so far about the election:

Well, I have a message for the Scots: Be afraid, be very afraid. The risks of going it alone are huge. You may think that Scotland can become another Canada, but it’s all too likely that it would end up becoming Spain without the sunshine.

Spain without the sunshine, indeed. This may be one of the few occasions on which you will find Niall Ferguson and Paul Krugman in agreement.

Right now the London bookies still think the vote for independence will fail. I think that conclusion is largely based on the assumption that many Scottish citizens who say they are “yes” voters today will go into the polling booth and realize at the last moment that their personal economic interests lie in remaining in the union. But as of today, it looks to be very close. Just the fact that they can take a vote on such a question is really rather remarkable. I don’t remember there being a vote in the movie Braveheart.

My father told me that our family was kicked out of Scotland and then kicked out of Ireland before we made it to the colonies (back when they were still colonies). The name was Muldoon in Scotland and Ireland and was Americanized when we hit these shores. We can’t find any records to prove the family legend, and it’s been a few centuries since anyone in the family had the right to vote over there. But there’s a part of me that might be looking at the numbers a wee bit sentimentally, so let me close by wishing my Scottish friends Go n-éirí an bóthar leat! (That’s Gaelic, which is as close to an ancient Scottish language is there is, though it’s more commonly thought of as Irish.)

Your wondering if I’ll need a passport to see Edinburgh again analyst,

See the original article >>

«Nessuno è indispensabile». Vero. Sempre.

di Stefano Masa

Domenica 7 settembre: «Nessuno è indispensabile». Vero. Una sostituzione in corsa dell’attuale presidente Ferrari? «Non è in agenda». Vero. «Per me e vale per lui come per tutti gli altri: noi siamo al servizio dell'azienda. Quando l'azienda cambia idea o per lo meno non c'è più la convergenza di obiettivi le cose cambiano». Molto vero e concordo personalmente.

Mercoledì 10 settembre: Montezemolo si dimette dalla guida Ferrari e Marchionne nuovo presidente.

Quanto accaduto in questi ultimi tre giorni al nostro più prestigioso marchio automobilistico può sinteticamente rappresentare l’attuale situazione del nostro Paese. Si cerca il cambiamento, l’alternanza. Abbandonare il passato. Un taglio netto. Nessuno è indispensabile e forse – allo stesso modo – niente è indispensabile. Facciamo tutto in fretta e basta. Poi si vedrà. Ma cambiamo radicalmente. In Italia si sta cambiando la sostanza degli italiani: dal calcio, con la sua neonata nazionale, all’automobile.

I modi e le modalità per l’avvicendamento sono solo un corollario mediatico che, come spesso accade nei mercati finanziari, quando tutti comprano bisogna vendere.

alt

Anche in Ferrari è accaduto questo: ci sono problemi aziendali? «La cosa importante per la Ferrari non sono soltanto i risultati economici ma è vincere e sono sei anni che facciamo fatica». Così è, quindi vero. Ci sono potenzialmente interessi economici “a rischio”? «Sono due le parti della realtà Ferrari che sono importanti per noi come azionista e per noi come azienda: la prima sono ovviamente i risultati economici, i volumi, cosa su cui Luca ha fatto un grandissimo lavoro e gli faccio i miei complimenti. L'altra è la gestione sportiva». Anche questo è corretto, quindi vero.

C’è mancanza di prestigio a seguito di questo? «La parte essenziale di quello che noi facciamo è presentare una Ferrari vincente in Formula1. È un obiettivo assolutamente chiaro e non possiamo accettare una situazione diversa». Aziendalmente condivisibile, e quindi vero anche questo.

Sono state usate da Marchionne molte affermazioni più che condivisibili sia intellettualmente che aziendalmente. Il risultato è stato raggiunto ed il cambiamento c’è stato.

Personalmente stimo tutti gli imprenditori del nostro paese come in generale tutti coloro che rischiano la loro immagine attraverso il loro coraggio di operare per fare azienda quotidianamente (quindi anche gli stessi dipendenti). In questa vicenda i due amici di sempre Marchionne e Montezemolo rappresentano un modello di riferimento per il loro settore e per il nostro Paese. Hanno cercato il cambiamento. L’hanno attuato. Hanno cambiato.

Detto questo siamo e rimaniamo però italiani con la loro mentalità. Cosa c’entra – in questa dinamica comunicativa tra azionista ed azienda controllata – affermare «Noi italiani non dobbiamo permettere a questi "furbetti cosmopoliti" di prenderci in giro in questo modo, sicuri di farla sempre franca» e sempre rivolto a Marchionne sia l’invito «a pagare le tasse in Italia dove le pagano i lavoratori Fiat» sia «Marchionne che vuole dare lezioni a noi italiani su cosa e come dobbiamo fare per sottolineare il suo "orgoglio italiano" è una cosa vergognosa e offensiva»?

Ricordiamo però: siamo in Italia e soprattutto siamo nel Paese mondiale chiamato “business” dove  «nessuno è indispensabile». Vero. Fino a qualche giorno fa eri Presidente con risultati eccezionali. Vero. Ma oggi non più. Vero.

Un grazie a Montezemolo per tutto quello che ha dimostrato: cambiando, creando, vincendo. Un grazie a Marchionne per il suo coraggio nel mettersi (nuovamente) in gioco in questa avventura. E anche un grazie a Della Valle che attraverso il suo operato prima storico e oggi innovativo ha comunque diritto e dovere di manifestare ciò che pensa.

Ricordiamo però: «Nessuno è indispensabile». Vero. Sempre.

See the original article >>

Di tutto, dei crimini, dei criminali, degli assolti

by Edoardo Varini

Di tutto, dei crimini, dei criminali, degli assolti, dei patti di governo, delle strategie politiche, delle priorità culturali e delle emergenze sanitarie, della crisi economiche e della povertà crescente, della chirurgia estetica e della morte che riusciamo ormai a scorgere soltanto nelle teste decapitate in terre lontane e che invece ci ha mangiato l'anima e lasciato solo la faccia su FB, di tutto ormai viene dato l'annuncio da Vespa, in tv.

Ieri sera il premier bambino ci ha prima blandito per l'ennesima volta con la promessa che nella Legge di stabilità 2015 ci sarà una «ulteriore riduzione delle tasse sul lavoro» e poi a seguire mazzolato con l'anticipazione che i poveri e i pensionati gli 80 euro se li possono scordare.

alt

Vogliamo davvero parlare del taglio del cuneo fiscale? A oggi i contributi sociali pagati dagli imprenditori italiani sono pari al 24,3% del costo de lavoro, la media Ocse è del 14%. Ma quanto bisogna tagliare per essere competitivi? Attendiamo quantificazioni, Matteo.

Come diavolo facciano i sondaggi a rilevare tutti oltre il 50% di consensi per un premier dall'azione di governo principalmente fonetica non mi è dato sapere e, permettetemi, cari sondaggisti, io non ci credo. Rivedete il campione, rivedete il teorema del limite centrale, forse la deviazione non è così standard... fate qualcosa, perché avete valicato le soglie dell'Improbabile.

Poi lo stupore per la mancata ripartenza dei consumi, che è, fra tutte, la cosa più buffa: qualcuno sa a quali gabelle andremo incontro nell'autunno? Entro la mezzanotte di oggi 2800 comuni dovranno fare quello che ancora incredibilmente non hanno fatto: comunicare le aliquote della Tasi, altrimenti verrà applicata l'aliquota standard dell'1 per mille, senza detrazioni, nemmeno per i figli. Pagherà anche chi non ha mai versato l'Imu.

Italiani sempre più sudditi ma sempre più fiduciosi nel premier. Ma siamo davvero così? Ripeto, non ci credo. Non voglio crederci.

See the original article >>

How the Rich Rule

by Dani Rodrik

PRINCETON – It is hardly news that the rich have more political power than the poor, even in democratic countries where everyone gets a single vote in elections. But two political scientists, Martin Gilens of Princeton University and Benjamin Page of Northwestern University, have recently produced some stark findings for the United States that have dramatic implications for the functioning of democracy – in the US and elsewhere.

The authors’ research builds on prior work by Gilens, who painstakingly collected public-opinion polls on nearly 2,000 policy questions from 1981 to 2002. The pair then examined whether America’s federal government adopted the policy in question within four years of the survey, and tracked how closely the outcome matched the preferences of voters at different points of the income distribution.

When viewed in isolation, the preferences of the “average” voter – that is, a voter in the middle of the income distribution – seem to have a strongly positive influence on the government’s ultimate response. A policy that the average voter would like is significantly more likely to be enacted.

But, as Gilens and Page note, this gives a misleadingly upbeat impression of the representativeness of government decisions. The preferences of the average voter and of economic elites are not very different on most policy matters. For example, both groups of voters would like to see a strong national defense and a healthy economy. A better test would be to examine what the government does when the two groups have divergent views.

To carry out that test, Gilens and Page ran a horse race between the preferences of average voters and those of economic elites – defined as individuals at the top tenth percentile of the income distribution – to see which voters exert greater influence. They found that the effect of the average voter drops to insignificant levels, while that of economic elites remains substantial.

The implication is clear: when the elites’ interests differ from those of the rest of society, it is their views that count – almost exclusively. (As Gilens and Page explain, we should think of the preferences of the top 10% as a proxy for the views of the truly wealthy, say, the top 1% – the genuine elite.)

Gilens and Page report similar results for organized interest groups, which wield a powerful influence on policy formation. As they point out, “it makes very little difference what the general public thinks” once interest-group alignments and the preferences of affluent Americans are taken into account.

These disheartening results raise an important question: How do politicians who are unresponsive to the interests of the vast majority of their constituents get elected and, more important, re-elected, while doing the bidding mostly of the wealthiest individuals?

Part of the explanation may be that most voters have a poor understanding of how the political system works and how it is tilted in favor of the economic elite. As Gilens and Page emphasize, their evidence does not imply that government policy makes the average citizen worse off. Ordinary citizens often do get what they want, by virtue of the fact that their preferences frequently are similar to those of the elite. This correlation of the two groups’ preferences may make it difficult for voters to discern politicians’ bias.

But another, more pernicious, part of the answer may lie in the strategies to which political leaders resort in order to get elected. A politician who represents the interests primarily of economic elites has to find other means of appealing to the masses. Such an alternative is provided by the politics of nationalism, sectarianism, and identity – a politics based on cultural values and symbolism rather than bread-and-butter interests. When politics is waged on these grounds, elections are won by those who are most successful at “priming” our latent cultural and psychological markers, not those who best represent our interests.

Karl Marx famously said that religion is “the opium of the people.” What he meant is that religious sentiment could obscure the material deprivations that workers and other exploited people experience in their daily lives.

In much of the same way, the rise of the religious right and, with it, culture wars over “family values” and other highly polarizing issues (for example, immigration) have served to insulate American politics from the sharp rise in economic inequality since the late 1970s. As a result, conservatives have been able to retain power despite their pursuit of economic and social policies that are inimical to the interests of the middle and lower classes.

Identity politics is malignant because it tends to draw boundaries around a privileged in-group and requires the exclusion of outsiders – those of other countries, values, religions, or ethnicities. This can be seen most clearly in illiberal democracies such as Russia, Turkey, and Hungary. In order to solidify their electoral base, leaders in these countries appeal heavily to national, cultural, and religious symbols.

In doing so, they typically inflame passions against religious and ethnic minorities. For regimes that represent economic elites (and are often corrupt to the core), it is a ploy that pays off handsomely at the polls.

Widening inequality in the world’s advanced and developing countries thus inflicts two blows against democratic politics. Not only does it lead to greater disenfranchisement of the middle and lower classes; it also fosters among the elite a poisonous politics of sectarianism.

See the original article >>

The Simple Math Behind the NEXT Lost Decade in US Stocks

by Bill Bonner

You’re Not Over the Hill If You Don’t Remember Any Hill …

Yesterday, we turned 66 years old. When did we get so old? We can’t remember. But 66 is still young. Everybody says so. Especially mother, who is 93, and our uncle, who is 96.

For our birthday, we went with Elizabeth to Le Dôme du Marais – a nice restaurant in the Marais district of Paris. It’s housed in a handsome round building that was once a pawnshop.

The pawnshop had been set up, explained the menu, by Louis IX to combat usury. In the days before credit cards, people could come to the pawnshop, rather than going to loan sharks, for their financing needs. Le Marais is a charming part of the city. Narrow streets. Ancient buildings. Chic shops. It is much more fashionable and cosmopolitan than our neighborhood.

At one table was a group of young professionals (perhaps in finance) – some from England, some Americans, an Asian… and others. It looked very much like a group you’d see in London or New York. At another table was a couple we took to be Scandinavian… or Russian. An American couple sat at yet another table but left early.

“That didn’t seem like Paris,” said Elizabeth. “It could have been anywhere.” Now, the small talk out of the way, let us return to our main subject: how to invest intelligently in an uncertain world.

A Simple System to Beat the Market

The Dow has traded at more than 20 times earnings six times in the last 114 years: at the start of the 20th century, in the late 1920s, in the mid-1930s (because earnings were so low), in the 1960s, in the 1990s, and twice in the new millennium.

Each time, save the last, a bear market followed that brought stock prices back to more reasonable valuations. The Dow has traded below 10 times earnings only three times over the same period: between about 1915 and 1925, after the crash of 1929 off and on until 1945, and between about 1977 and 1984. (The dates are approximate, because P/E ratios are slippery.)

Each time was a buying opportunity. Stocks rose substantially subsequently. Our “Simple Trading System” (STS) couldn’t be simpler.

P/E > 20 = Sell

P/E < 10 = Buy

When stocks are above 20 times earnings, you are out. When they fall below 10 times earnings, you buy again. Otherwise, you do nothing.

Had you come to adulthood in 1900… and somehow lived to today… following STS, you would have saved yourself the worst drawdowns. And you would still have taken advantage of the big bull markets of the 1920s, the 1960s, the 1980s, and the 1990s (and even the bull markets of the 2000s, depending on how you calculated your P/E ratio).

Note: If you had been using Robert Shiller’s 10-year average inflation-adjusted measure, you would have been out of stocks since the late 1990s. His “Shiller P/E” never fell below the 10-times-earnings entry mark.

Easy peasy, right?

Your rate of return would have been far in excess of buy and hold. But the real beauty of the STS is that you don’t have to be too exact about it. The system is meant to help you get the big moves right; the details almost don’t matter.

SPX valuation

SPX with GAAP earnings and trailing P/E – obviously, P/E ratios are not the only determinant of future returns, but avoiding buying an expensive market has definitely helped with avoiding all the worst crashes and bear markets – click to enlarge.

Better Than the Shiller P/E

Our old friend Stephen Jones has been studying the essential question for decades. He has come up with an even better way to determine the real value of the stock market and its likely direction – better, I believe, even than Robert Shiller’s 10-year P/E and Tobin’s Q (which looks at the market value of listed companies relative to the replacement value of those companies’ assets).

Jones says that earnings – the denominator in the P/E ratio – are misleading. They can be goosed up by unsustainable trends. And that is exactly what has happened now: Earnings are greatly flattered by the Fed’s easy credit.

An alternative is to look at total output – GDP – and then adjust it according to the macro trends that are sure to affect it. The two main trends right now are debt and demographics. Both are major influences on growth. As debt increases, and a population ages, GDP declines.

Jones put those figures into his model … and found the resulting indicator was more accurate than any other market-forecasting tool.

Q-Ratio

Tobin’s Q ratio, via Doug Short. Today’s value was only eclipsed by the late 90’s tech mania, which is not the proper yardstick for determining overvaluation. It is noteworthy though that we’ve left the 1929 peak in the dust already – click to enlarge.

Another Lost Decade?

What does Jones’s model tell us now?

First, US stock prices are well over 20 times earnings when earnings have been properly normalized…or “smoothed” … as Shiller would do it (P/E > 20). Second, the model forecasts annual returns of MINUS 10.5% for the next 10 years.

Simple and obvious advice: It’s a good time to stay out of the stock market for long-term investors. But wait … If this is so simple, surely the smart money must have seen it?

Surely, it noticed that stocks were sometimes cheap and sometimes dear?
Surely it realized that investors were moved by greed and fear … and that they frequently mispriced stocks?

And what about all those guys with PhDs on Wall Street? Don’t they know about the anomalies Porter mentioned yesterday? Don’t they see all the $100 bills that are lying on the ground, just waiting to be picked up? Don’t they know they can time the stock market – at the extremes – as our STS does? Of course they do!

Next: What’s wrong with the “smart money?” How come it leaves so much money available for investors like us? Is it not so smart after all?

Poster - Smart Money (1931)_05

“Smart Money” – a movie about a man who knows too much about cards and too little about blondes …

The above article is from Diary of a Rogue Economist originally written for Bonner & Partners. Bill Bonner founded Agora, Inc in 1978. It has since grown into one of the largest independent newsletter publishing companies in the world. He has also written three New York Times bestselling books, Financial Reckoning Day, Empire of Debt and Mobs, Messiahs and Markets.

See the original article >>

Gold Gets Whacked – What Happens Next?

by Pater Tenebrarum

A Test of Patience …

Actually, we are obviously not qualified to answer the question posed in the title of this post. We published an article entitled “Gold & Gold Stocks – Potentially Bullish Developments”, early last week which turned out to be particularly ill-timed. Both the metals and the mining stocks got whacked almost as soon as the proverbial ink on it was dry.

We hope that the overarching topic of the article, which was inspired by divergences and sector-internal relative performance data still made it worth reading. We are specifically referring to the ideas regarding how cyclical gold bear markets end, how early stage bull markets develop, and why there is a certain sequence of events that can usually be observed when that happens.

As to a sell-off starting right after we mentioned bullish developments, this mainly demonstrates that anything is possible in the short term. Luckily we did not neglect to mention potential negatives – after all, the future is always uncertain.

The gold market was ambushed last week by a very strong ISM report (which was so strong it strikes us as a contrary indicator), and the ECB’s assault on the euro, which helped an already very stretched dollar index to become even more stretched (the RSI on the daily chart briefly touched the 85 level last week). This has certainly introduced fresh uncertainties, as the dollar index is actually close to breaking through a long term resistance level.

1-DXY monthly

The dollar index monthly. Close to besting resistance, and there is actually an MACD buy signal on the monthly chart now. Note also the MACD/Price divergence that was set up between 2005-2008. Interestingly, gold is tantalizingly close to giving a monthly MACD buy signal as well – click to enlarge.

Obviously the markets are currently discounting the idea that both the BoJ and the ECB will move ahead of the Fed in the confetti debasement race. It is however important to keep in mind that currency debasement remains the name of the game, and which central bank is more proficient at it at any given point in time does not alter the basic fact that they are all doing it. It is noteworthy in this context that gold in terms of the euro, the yen and cable does not display a short term support breakdown similar to that evident in dollar terms.

2-Gold in euro,yen,pound

Gold in euro, yen and pound sterling terms – short term support has held so far – click to enlarge.

A strong and rising dollar is certainly a negative for gold, but the dollar is only one of several factors driving the gold price. For instance, gold nearly doubled from its 2008 high to its 2011 high, even though the dollar rebounded from its 2008 low concurrently. The short term outlook has nevertheless become more uncertain, and with it also the medium term outlook, for the simple reason that there remain only two notable short/medium term lateral support levels for gold in dollar terms. This is a parallel to the similarly uncertain situation experienced in May. Gold and silver in dollar terms are depicted below. As can be seen, they have formed another downwardly sloped wedge, and are once again poised just above support:

3-Gold-Silver wedges

Gold and silver wedges. Both metals are close to support areas – click to enlarge.

As soon as the most recent support break in gold happened, the financial press was brimming with bearish pronouncements again, with Goldman Sachs reiterating its $1,050 target for the umpteenth time since June 2013. Naturally, we cannot rule this possibility out. The level is a potential price attractor, as this was roughly where the 2008 peak was put in.

On the other hand, this target can only come into play if the risk asset bubble continues unabated, and no doubts creep in with respect to central bank policies. Consider in this context that the gold market as a rule tends to reflect such doubts long before any other markets are doing so. E.g. the 1999-2000 double bottom (the low was actually made in 1999) occurred in parallel with the late 90’s stock market bubble going parabolic and Mr. Greenspan being addressed as the “Maestro”. So the Goldman Sachs price target is strongly dependent on faith in central banks continuing to hold up for a considerable time period from here on out. This seems somewhat unlikely on the grounds that enormous economic distortions have been put into place by their policies, but it is presumably not impossible.

Gold Stocks – Down, But Not Out Just Yet

In spite of the fact that mining costs at most producers have been declining for several quarters, they remain quite close to current gold prices in many cases. These still relatively thin margins have both advantages and disadvantages for investors. The advantage is huge earnings leverage in the event of a gold price rally. To illustrate this with a simple example: imagine a company mining gold at $1,200/oz. all in. At a price of $1,300, its margin will be $100 per ounce. If the gold price rallies from $1,300 to $1,400 – an increase of 7.7% – the earnings margin of our hypothetical miner will double.

The disadvantage is obviously that it won’t take much of a price decline to move this hypothetical operation toward producing losses. It is therefore not too surprising that gold stocks are currently especially volatile in both directions. The sector has also broken a short term support level in the course of last week’s sell-off, but it has continued to maintain a divergence with the gold price relative to the last sell-off in May.

This is to say: so far. There is no guarantee that this will continue to be the case, but it was interesting that Tuesday’s small bounce in the gold price back to the unchanged level from an earlier sell-off immediately brought some buying interest back to the sector. Since this may merely have been tactical short covering, one probably shouldn’t read too much into it. Whether it is meaningful will depend on follow-through, which may or may not happen.

Below are two charts illustrating the situation. Gold in dollar terms compared to the HUI, which shows that in spite of their short term underperformance last week, gold stocks still diverge positively in the medium term. Obviously though, they now have to overcome additional resistance, similar to gold itself. The second chart shows GDXJ, the HUI and the HUI-gold ratio. GDXJ is interesting because it has tended to be a relative strength leader during rallies this year and the 200 dma seems to have stopped its decline for now.

4-Gold vs. HUI

Gold daily vs. the HUI. Both have violated lateral supports, but the HUI continues to diverge positively relative to its lows in late May – click to enlarge.

5-GDXJ

GDXJ, HUI and the HUI-gold ratio. The red dotted lines indicate the short term support that has failed with the decline from the blue rectangles. In HUI-gold a short term uptrend has failed as well. The one-day bounce may not mean anything, but was achieved in spite of gold merely returning to the unchanged level on the day – click to enlarge.

Conclusion:

Obviously, the fact that gold has lost the near term support around 1280 is bad news for gold bulls. However, this market hasn’t only fooled the bulls during its consolidation since 2013. Since it has essentially no trend, it has done the same to the bears, who have yet to see their projections fulfilled more than a year after the June 2013 low. In the short term, the bears appear to have the upper hand, but this can easily change again.

Still, the action has made the medium term outlook more uncertain. Note in this context that prices have moved in a very large triangle since mid 2013, and from a technical perspective it cannot be ruled out that this is the prelude to another leg down in prices. Note though that one major factor remains gold-supportive, namely credit spreads. The TLT-HYG ratio (a proxy for credit spreads) remains in an uptrend in spite of a recent recovery in HYG and a back-up in treasury yields (HYG has recently begun to decline again from a lower high). The ratio has trended higher all year, which represents a strong warning sign for risk assets as well.

6-TLT-HYG

The TLT-HYG ratio, a proxy for credit spreads – click to enlarge.

See the original article >>

FBN Says "Time To Turn The Boat Around" Switching To Bearish Outlook, 1870 Target

by Jeremy Klein

As someone who steadfastly held onto a bullish outlook, I desperately hoped that volatility would remain contained as the various sentiment metrics that I track, such as TICK readings and open interest in the futures, pushed deeper into overbought territory.  Trading ranges crept higher last week and have failed to narrow.  Although the amount of skittishness is not excessive, it has moved to dangerous grounds to push many of those investors who have feasted on dips over the past five years to the sidelines.  Consequently, I am officially switching to an intermediate term bearish outlook this morning.

I assess the fundamental environment as neutral.  While extremely transparent monetary policy and estimated robust earnings growth are unambiguously favorable, the forward multiple on the S&P 500 still resides within spitting distance of its upper bound since 1990 save the era of the Dot Com Bubble.  Hence, stocks bumped into a ceiling once the blue chip index began flirting with 2,000 as companies have little room for error when announcing their results.

Some macro data points have exhibited definitive signs that the economy has accelerated.  However, weakness overseas and a disappointing miss of consensus by the Jobs Report throws into question the optimistic assumptions about the global recovery. Moreover, a relentless rally in the Dollar will crimp profits for multinational corporations.  The strength in the Greenback is starting to garner attention from traders.  With the Fed ambling toward a path of restrictive measures, this trend in the F/X markets is secular in nature.  Nevertheless, the FOMC will almost assuredly delay any decision to pare its balance sheet passively via a cessation of the reinvestment of the proceeds of maturing assets until mid-2015 at the earliest such that any retracement that does arise will be cyclical in nature to offer a fortuitous buying opportunity at its terminus.

Although the calendar remains largely quiet in the coming days, I envision that the wide price swings will persist.  The magnitude of the drop in the wake of the anticipated launch of the “Apple Watch” should have concerned portfolio managers.  While the news out of Cupertino only pertained to the tech giant and a handful of other companies related to the product suite, the broader indices were dragged around like a rag doll.

This sensitivity to headlines reflects an attempt by many firms to salvage performance for 2014 by augmenting their exposure aggressively over the past several weeks.  Similar to the countless number of jockeys who have failed in the grueling 1.5 mile Belmont Stakes by asking for their horse to start its kick too far in front of the finish line, these funds moved too soon as year-end still sits far off on the horizon.  This incremental positioning grossly inflated the average monthly NYSE closing TICK which extended to +338 on Monday.  Thus, the muscle for a protracted selloff is intact.

The pullbacks from January and May 2013 mark the most recent instances of an expansion of volatility concurrent with this critical technical statistic stretching to such lofty heights.  I therefore forecast a 7% decline in the S&P 500 from its intraday top printed on September 4 to yield a target of 1870.  Since security prices are negatively skewed in that they fall much faster than they rise, the descent will occur rapidly.  I project that a bottom will arrive sometime in October but will adjust this thesis if the broader indices refresh their peaks and session ranges again collapse to more palatable levels.  While few names will avoid the downward pressure, small capitalization shares and high beta tickers will suffer the most damage.

S&P 500 Cash Key Technical Levels

Support:  1984.75, 1977.50, 1974.25, 1969.00, 1965.00, 1955.00, 1941.50, 1938.00

Resistance:  2000.50, 2007.00, 2011.25, 2025.00, 2050.00

See the original article >>

Central Bank Induced Market Distortion Goes Bananas

by Pater Tenebrarum

“Conjuring Profits From Sub-Zero Yields”

The above is the title of the recent Bloomberg article that discusses the ECB’s penalty rate on bank excess reserves (which as one analyst recently remarked have become the proverbial “hot potato” now that a 20 bp fine is charged for their possession) and its effects on bond markets. In euro-land, government bond yields have already completely collapsed, partly to almost Japan-like levels – and yet, more capital gains can still be achieved, even with paper sporting negative yields. According to the article:

“David Tan got to help oversee $1.5 trillion at JPMorgan Asset Management by picking winning trades. Now he’s studying how to make money from investments that look sure to lose.

Across much of Europe in the past year, the yield on two-year government debt tumbled from little, to none, and then below zero. That means buyers would walk away with less cash when the securities matured — if they waited that long.

Money managers like Tan are navigating a market where positive returns are still possible on debt with negative yields provided others will pay a higher price before the notes come due. Those opportunities were enhanced last week when the European Central Bank increased the cost for financial institutions to park their money with it. After that, depositors were tempted to take their cash from the ECB and funnel it intogovernment bonds, because the negative yields hurt less than the central bank’s more punitive charge.

“If yields continue deeper and deeper into negative territory, the opportunities for capital gains remain,” Tan, who is head of rates in London for the fund-management unit of the U.S.’s biggest bank. “If your central hypothesis is that yields are going to converge” with the ECB’s charge on deposits then you still see “some potential price appreciation,” he said.

The list of institutions that may choose to lose includes asset managers so large they’re willing to pay for their cash to be held safely as well as banks that want to avoid the higher ECB charges. And it includes many large financial groups like insurers whose rules are too inflexible to give many alternatives. At the top of the heap probably are other central banks.

Central bankers “are a fairly value-insensitive bunch,” Michael Riddell, a London-based fund manager at M&G Group Plc, which oversees the equivalent of about $415 billion, said on Sept. 5. “They have to invest their FX reserves somewhere if they want to buy euro-area assets that have the top credit ratings, then they have no choice.”

(emphasis added)

We have previously remarked that some of the buyers of short term government debt with a negative yield are those who don’t trust the banking system with their cash. This actually makes at least some sense. All the rest only shows how utterly crazy the market distortions caused by central bank policies have become. Why the geniuses running the central banks believe that this time, this is somehow going to end well, is utterly beyond us.

1-Germany, 2yr yield

Germany’s 2 year note yield – deeper into negative territory, at minus 0.055% – click to enlarge.

Such negative yields can only exist in the policy-distorted world – the natural rate of interest can never turn negative, as that would imply that future goods can be worth more than present goods. This is a logical impossibility. Note here that the natural interest rate is nothing but the price ratio between future and present goods. It is actually a non-monetary phenomenon, expressing time preferences, which can be low, but are always positive. If they were at zero or negative, people would stop consuming altogether and would soon starve to death.

An inference from this is that current central bank policies are once again leading to capital malinvestment and capital consumption on a large scale. This is also demonstrated by the asset bubbles currently in train. E.g. stocks are titles to capital and thus reflect the mispricing of capital and partly illusory profits that stem from misguided economic calculation.

Covered Bonds in the Grip of ECB Madness

Since the ECB has announced it will engage in outright purchases of covered bonds, i.e., it will buy these assets with money conjured from thin air, the covered bond market has been infected with crazy behavior as well. The ECB is not the only central bank in the market – others from that “value-insensitive bunch” are apparently active as well. Here is a summary of the salient points from a report on new covered bond issues in France in recent days – for more details see here (note though that this site requires registration):

“CFF priced EUR 1bn obligations foncieres at 5 bps through mid swaps this morning. The EUR 1 b. offer generated bids for EUR 4.8 bn. from 150 accounts, with heavy central bank participation. Comment of a syndicate official:

“The plus 1 bp area and even the minus 2 bp area guidance turned out to be quite conservative”  Further: “It’s quite a jump, I have to admit. Syndicates and issuers are getting used to this post-ECB world, with the market bid only and so technical. It’s crazy”

Caffil’s 1.25 bn. issue from Monday (which generated 4.9 bn. in bids) had already tightened from its reoffer of 1 bp through to -5 bp to -8 bp by Tuesday morning.

“Everyone’s piling in”, said the syndicate official, although he noted that accounts that were finding pricing too tight were biased towards bank treasuries. “It’s difficult for it to make sense for them”.

A syndicate banker away from the leads said that CFF’s results were “astounding”.

“That’s a trade! It just goes to show how crazy things are. People expect spreads just to ramp in on the back of this purchase program (referring to the ECB here). But there’s got to come a point where you have to ask if investors know what they are buying and what they are doing.”

“Things are so tight, I get a headache just thinking about it” said a banker away from the deal. He noted that a EUR 500 m. UniCredit Bank Austria benchmark issued on April at 23 bps above mid swaps now trades at around 7 bp over.”

(emphasis added)

We can only agree: it is crazy. It “works” only as long faith in the omnipotence of central banks remains intact. This faith will eventually be tested. Note here that the underlying assumption is always that the monetization of assets is just a temporary policy instituted to “help the economy”. The latter is absurd, the former remains to be seen. So far all these “temporary” interventions undertaken since 2008 seem to just continue, with more piled on every year (whereby major central banks seem to be alternating in the printing duties).

In other words, it is by no means guaranteed that the beliefs currently held by market participants are immutable. Let us for argument’s sake say though that these central bank interventions will not only cease, but will be significantly reversed at some point. What then about all those assets that have been bought at paltry or even negative yields? What about the mountain of interest rate derivatives that have been written and are supposed to hedge these positions?

It seems to us that central banks have embarked on a one-way street. Unless they are prepared to preside over a monumental bursting of the asset bubble, they are in a box. Hence the widespread faith in the temporary nature of central bank money printing is likely misplaced. It won’t stop until the markets revolt.

One market that needs to be closely watched in this context is the JGB market (or what is left of it), as Japan is the nation where extremely low bond yields, massive debt monetization and huge public debt growth all have a considerable head start. It seems quite possible that faith will crumble there first. Should that happen, it will crumble everywhere. Once again, the chart of JGB yields actually reminds us of how gold looked when it bottomed in 1999-2000. The similarity is in fact eerie.

2-JGB yield

JGB yields – finally bottoming out? – click to enlarge.

For comparison, below is a line chart of gold from mid 1997 to mid 2001. We will see whether the JGB market will continue to track it. There is of course no reason for this to happen apart from the fact that chart patterns of different markets often tend to look similar at key junctures.

3-Gold, 1997-2001

Gold from 1997 to 2001 – a pattern eerily similar to that in JGB yields – click to enlarge.

Conclusion:

Central bank interventions always “seem” to work up to a point. As long as enough real wealth is created that it is possible to divert some of it toward bubble activities, everything appears to be fine. However, major structural economic distortions and asset bubbles are invariably the result. The question is usually only whether the interventions are discontinued voluntarily or not. In either case an economic and market backlash is unavoidable. If an inflationary policy is not abandoned, it will eventually end up destroying the underlying monetary system. If it is abandoned in time, all the malinvestments are unmasked and a major bust becomes unavoidable. Apparently central bankers like to be between a rock and a hard place. That wouldn’t be a problem if not for the fact that everybody else is affected by their actions as well.

See the original article >>

So What’s Up With Palladium?

by Greg Harmon

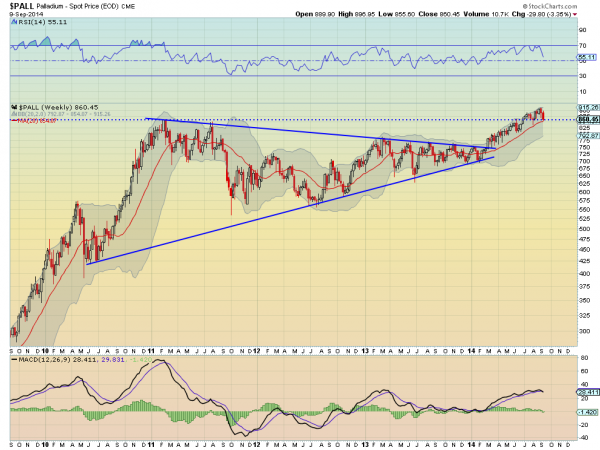
Palladium has been a metal on a mission. It has steadily risen throughout 2014 while Copper, Gold, Platinum and Silver have languished at best. But can it continue? The chart has some mixed messages. Take a look.

pall

The weekly chart above shows that the move higher in February broke out of a 3 and a half year long symmetrical triangle. The target for the move higher out of this pattern would be to about 1190, a far cry from where it is trading now near 860. So why the concern? First, the triangle break happened deep into the apex. The power zone for a break higher tends to be about 2/3 of the way through the triangle and this is closer to 90%. This often leads to a weak move higher. The momentum indicator, RSI, is also making a new lower low on this pullback, and the MACD is about to cross down, a bearish trigger.

But I said it has mixed messages. What about the positives. First there is that target of 1190 higher. Next, if the RSI were to move back up before the price broke the August 4th week low then a Positive RSI Reversal would trigger and target a new high. The 20 week SMA rising in red has been support for this move higher and it has not broken that yet. Finally the price is consolidating over the prior high from February 2011 and it can be expected to take some time to move away from that.

So what do you do? I am watching the 20 week SMA and a break of support could trigger a sell or short position with a target of the center of the triangle near 725. A move back higher over 910 could trigger a long position. This metal can be traded using the ETF $PALL, but I would stick to using the commodity price levels as your guide for entering and staying in the trade.

See the original article >>

Interest rates are up 200% in three years- Are you kidding me?

by Chris Kimble

2yr5yryieldbreakoutssept9

CLICK ON CHART TO ENLARGE

When one looks at the yields on very short term U.S. Government debt, yields on the 2 & 5-year notes are up a big percentage over the past three years.

Since 2011, the yield on the 2-year note is up over 200% (.17% to .56%) and the yield on the 5-year note is up over 100%. No doubt the actual rate remains very low on a historical basis.

The point of the two charts above is NOT the percentage increase in short-term yields we have seen over the past three years. The focus is to see if interest rate trends on a short term basis are changing and could they impact longer term rates?

The 2-year yield looks to be making an attempt to breakout of a falling channel at (1) and the yield on the 5-year note is at falling resistance and could be creating a bullish ascending triangle pattern.

New trends start from somewhere....I am watching to see if a trend change in short term rates will spill over into the longer end of the yield curve.

See the original article >>

A Win-Win Scenario for Gold Investors

by James Rickards

Volatility and price drops may be nerve wracking, but the bull market in gold is far from over. In fact, it has barely begun.

To understand why, it helps to look at two prior episodes in the relationship of gold and money that are most relevant to today. These episodes were a period of extreme deflation, the 1930s, and a period of extreme inflation, the 1970s. History shows that gold does well in both conditions.

…neither the inflation nor the gold price spike happened overnight. It took 15 years to play out from start to finish.

Commentators frequently observe that we are experiencing “price stability” or “low inflation” based on the fact that the consumer price index has averaged 2% over the past 12 months. However, this average hides more that it reveals.

The economy is experiencing strong deflationary forces as a result of weak employment and deleveraging associated with the depression that began in 2007. Simultaneously the economy is experiencing strong inflationary forces as a result of Fed money printing. The deflationary and inflationary forces offset each other to produce a seemingly benign average. But below the surface the forces struggle to prevail with some likelihood that one or the other will emerge victorious sooner than later.

Inflationary forces often appear only with significant lags relative to the expansion of the money supply. This was the case in the late 1960s and early 1970s. The Fed began to expand the money supply to pay for Lyndon Johnson’s “guns and butter” policy in 1965. The first sign of trouble was when inflation increased from 3.1% in 1967 to 5.5% in 1969.

But there was worse to come. Inflation rose further to 11% in 1974 and then topped off at 11.3% in 1979, 13.5% in 1980 and 10.3% in 1981, an astounding 35% cumulative inflation in three years. During this time period, gold rose from $35 per ounce to over $800 per ounce, a 2,300% increase.

The point is that neither the inflation nor the gold price spike happened overnight. It took 15 years to play out from start to finish. The Fed’s current experiments in extreme money printing only began in 2008. Given the lags in monetary policy and the offsetting deflationary forces, we should not be surprised if it takes another year or two for serious inflation to appear on the scene.

Another instructive episode is the Great Depression. The problem then was not inflation but deflation. It first appeared in 1927 but really took hold in 1930. From 1930-1933, cumulative deflation was 26%. The U.S. became desperate for inflation. It could not cheapen its currency because other countries were cheapening their currencies even faster in the “beggar-thy-neighbor” currency wars of the time.

Sign Up for the Daily Reckoning HERE

Finally, the U.S. decided to devalue the dollar against gold. In 1933, the price of gold in dollars was increased from $20 per ounce to $35 dollar per ounce, a 75% increase at a time when all other prices were decreasing. This shock therapy for the dollar worked, and by 1934 inflation was back at 3.1%, a massive turnaround from the 5.1% deflation of 1933. In short, when all other methods fail to defeat deflation, devaluing the dollar against gold works without fail because gold can’t fight back.

It is unclear if the world will tip into inflation or deflation, but one or the other is almost certain.

It is unclear if the world will tip into inflation or deflation, but one or the other is almost certain. The good news for gold investors is that gold goes up in either case as shown in the 1930s and 1970s. Yet patience is required.

These trends take years to play out and policies work with a lag. Meanwhile, investors can use recent setbacks to acquire gold at more attractive prices while waiting for the inevitable price increase to occur.

See the original article >>

Apple’s CEO Shakes Doubters as Stock Surge Greets iPhones

By Tim Higgins and Adam Satariano

When Chief Executive Officer Cook unveiled two new smartphone models 12 months ago, Apple’s stock was slumping and the company was losing market share to Samsung Electronics Co. and low-cost manufacturers such as Xiaomi Corp. Questions abounded about whether Apple could keep innovating without co-founder Steve Jobs.

Fast forward to a year later and the company’s stock is flirting with a record high. Anticipation is building for the bigger-screen iPhones, a wearable device and a mobile-payments system that people with knowledge of the matter have said Apple is set to announce today. Even the recent stolen pictures of naked celebrities such as Kate Upton from Apple’s iCloud service have done little to derail investor enthusiasm.

Full Coverage of the Apple Event:

Driving the change are shifts in the smartphone industry and how investors have come to accept that Cook is firmly in charge of Apple. Rival Samsung (005930) is losing momentum as its multiple-device strategy to please all people at all prices is stalling, making Apple’s decision to stick just with high-end phones look smart. Cook is also set to give investors what they’ve been seeking: a new category of products, and larger-screen devices that consumers have been craving.


Tim Cook, chief executive officer of Apple Inc., takes a photograph during the launch of the iPhone 5c and 5s at the company's new store in Palo Alto, California, on Sept. 20, 2013.

Tippy Top

“They’re on top of the world,” said Tim Bajarin, an analyst at Creative Strategies Inc. “The No. 1 difference between last year and this year is the fact that Wall Street and even the customers have embraced the fact that this is Tim’s company -- he’s proven that he not only can pick up the mantle of Steve Jobs but advance it.”

Even Cook’s venue choice for the event is symbolic, Bajarin said. Apple will reveal its latest gadgets near its Cupertino, California-based headquarters at the Flint Center for the Performing Arts. That’s where Jobs introduced the Macintosh computer in 1984 and the iMac in 1998, both of which triggered growth spurts at the company.

Cook still has a lot to do to maintain Apple’s growth streak. The wearable device, which may include features for tracking health and fitness activity, along with a push into mobile payments, will test Apple’s ability to integrate hardware and software to make the products easy to use. Competition against deep-pocketed Samsung remains stiff in smartphones and other mobile devices.

Trudy Muller, a spokeswoman at Apple, declined to comment.

Bigger IPhones

Apart from investors, software developers are also optimistic about Apple’s prospects. Mark Kawano, CEO and co-founder of Storehouse Media Inc., said he’s looking forward to iPhones with larger screens, a better camera and an operating system that will likely let his company’s storytelling application be better utilized.

“More and more, the iPhone is just getting better and better at things that a traditional computer used to be good at,” he said. “Those things are what we are really well positioned for.”

Apple’s perceived renaissance dates back to earlier this year. At the end of 2013, Samsung, with its panoply of multipriced Galaxy devices running on Google Inc.’s Android operating systems, loomed large. The Suwon, South Korea-based company’s share of the global smartphone market had surged to 31 percent, while Apple held about 15 percent, according to researcher IDC.

Facing Critics

Apple, meanwhile, faced criticism from analysts and investors for holding to a single phone style and high prices. Its then-new iPhone 5s started at $199 with a wireless contract and the less-expensive iPhone 5c was offered at $99 with a contract. The unsubsidized iPhone 5c was priced at $549 in the U.S. and 4,488 yuan ($733) in China while Xiaomi’s handset cost 1,999 yuan and Lenovo Group Ltd.’s flagship K900 IdeaPhone sold for 3,299 yuan.

“There was speculation in the tech media that the 5cs were going to be the low-price phones, so when they came out and the pricing didn’t really address the broader emerging markets that wanted cheaper phones, that obviously led to some level of disappointment and sell off,” Walter Piecyk, an analyst at BTIG LLC in New York, said.

Samsung Slowdown

Yet Samsung -- instead of ratcheting up its revenue at Apple’s expense -- began facing slowing sales growth as it got squeezed by competitors such as Xiaomi on the low end and Apple on the high end. Samsung’s global smartphone market share slid to 25 percent in the second quarter from 32 percent a year earlier, according to IDC. In July, Samsung reported sales and profit that missed analysts’ estimates.

“The loss of momentum at Samsung creates an unforeseen buffer globally -- and is timed perfectly into a launch of larger screened phones with the potential to even get customers to switch back to Apple,” Ben Reitzes, an analyst at Barclays, wrote in a July note to investors.

By contrast, Apple steadily reported increasing year-over-year iPhone sales that topped analysts’ estimates. The new handsets “primarily” fueled Apple’s 12 percent sales gain by unit during the first three quarters of the company’s 2014 fiscal year, according to a filing with the U.S. Securities and Exchange Commission.

Best Ever

At the same time, Apple executives began a drumbeat to raise anticipation for new products. In May, Eddy Cue, head of iTunes, said products to be introduced later this year are the the best pipeline Apple has had in 25 years. In July, Chief Financial Officer Luca Maestri echoed that by saying he was “expecting a very busy fall.” Cook chimed in and said the company has an “incredible pipeline” that “we can’t wait to show you.”

Cook has appealed to investors in other ways as well. In April, Apple said it would expand its shareholder payout program, increasing its share repurchase authorization to $90 billion from $60 billion and announcing a 7-for-1 stock split, as well as a bigger dividend. The company’s stock surged in the aftermath of the announcements.

The CEO has also shown he’s serious this year about boosting growth through acquisitions. In May, Apple agreed to pay $3 billion to buy headphones and streaming-music service Beats Electronics LLC, the company’s biggest-ever purchase.

By the end of trading yesterday, Apple’s stock was up 38 percent from a year ago, ending the day at $98.36. Shares are up 23 percent so far this year, exceeding the 8.3 percent gain of the Standard & Poor’s 500 Index.

There’s a new willingness by investors to see “the glass as half full rather than half empty,” Piecyk said. “They’ve earned more investor trust.”

See the original article >>

What Happens When the Fed Stops Propping Up Stocks?

By Anthony Mirhaydari

If you've followed the market and the economy over the last few years, you've probably got a rough understanding that the Federal Reserve is propping up stocks. Maybe you're not sure exactly how it works, but the idea is just sort of out there.

Such is the benefit of holding short-term interest rates near 0 percent since 2008 and of growing the monetary base from $850 billion then to more than $4 trillion now.

Related: The Threat That Could Scar the Economy for Decades

Technically, the Fed isn't directly helping the stock market. It's buying long-term government bonds and mortgage securities. But by lowering the cost of credit for corporations, it's helped dump trillions into stocks as CEOs have leveraged up their balance sheet by issuing debt cheaply and using that money to repurchase their own shares.

The thing is, with the Fed's latest bond buying program on track to end next month and with corporations saddled with loads of debt, the dynamic is already slowing down. In other words, stocks are already starting to feel what it's like to lose the Fed's support. And it's set to get worse.

The practice of using debt to repurchase shares has become so widespread and aggressive — no wonder, since executive compensation is often tied to stock price and earnings per share metrics that benefit from reduced share counts — that it is believed to be limiting actual physical investment in plants and equipment.

This could be one of the reasons that both labor productivity and the capital expenditures component of GDP growth have been weak recently (private nonresidential fixed investment is growing at around a 7 percent to 8 percent rate vs. peaks of near 12 percent hit during the last two economic expansion).

So far, this dynamic has continued because of the Fed's ongoing purchases, the bond market's ongoing appetite for risk and the ability of corporate balance sheets to handle growing debt loads. Free cash flow and profitability are the key factors here.

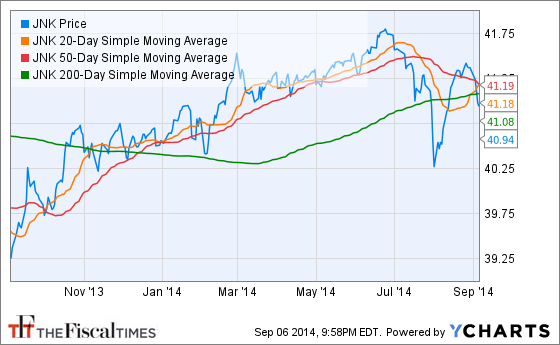
Some of this is starting to change. The high-yield corporate bond market — or junk bonds — has been showing signs of weakness over the past week. The Barclays High Yield Bond SPDR (NYSE: JNK) tested below its 20-day moving average on Thursday for the first time since July.

JNK Chart

JNK data by YCharts

If the weakness were to continue, it would limit the ability of companies to issue debt at low cost. Right now, there is a stampede to float debt after a summertime lull. Nearly $40 billion of high-grade debt was sold this past week, according to the The Wall Street Journal, the third-highest weekly total so far this year.

Overall, high-grade and junk-rated bond sales have already reached the $1 trillion issuance level for the year to date, the fastest pace on record (going back to the mid-1990s). This follows a strong performance last year. According to Andrew Lapthorne at Societe Generale, all this cheap debt has allowed corporations to be "the major net buyer of U.S. equity in recent years," with purchases totaling $500 billion in 2013.

Related: Commodity Prices, Bond Yields Send Warning Signals

With stock prices at all-time highs and the S&P 500 crossing the 2,000 level for the first time ever, these debt-fueled stock buybacks are growing increasingly expensive. And with the Fed's current bond purchase program expected to taper down to zero next month, given the strength of the economy and the steady pace of job creation, borrowing costs are likely to rise — further raising the total cost of these debt-fueled buybacks.

View photo

.

The chart above from Societe Generale shows, the combination of all this has resulted in a slowdown in the pace of share buybacks to levels not seen since late 2012. Further declines are likely, since without the Fed's bond buying "facilitating the extra debt, buybacks will have to be scaled back, undermining a key support to the equity bull market," according to Lapthorne.

At this point, we don't know how much of this drop is because of the Fed's tapering, or increasingly stretched corporate balance sheets, or simply folks realizing that this borrow-for-buybacks dynamic can't last forever. The more debt a company accrues, the more it's leveraged to the business cycle. In other words, any shift in revenue will have a larger and larger impact on net income because of the steady drag of fixed interest expenses.

According to Morgan Stanley, a large chunk of corporate debt will mature in the 2017-2018 timeframe. Should we get a recession between now and then and/or should interest rates rise significantly, corporate profits will get hit hard as free cash flow dries up and existing debt must be reissued at higher rates.

This behavior was also seen at the end of the last bull market, although the gap between buybacks and capital expenditures is more severe now than it was then. More simply, companies are neglecting real investment more than they did back in 2007.

An optimistic take is that when the Fed steps away, the stock market will cool its heels, but not collapse, as companies refocus on hiring, building and expanding. That'll be great news for the overall economy and America's workers. A pessimistic outlook is that, with the loss of a major source of support, stocks could drop in a way that hasn't been seen in years, potentially destabilizing the recovery.

What’s your take? Let us know in the comments section below.
See the original article >>

Platinum Volatility Near Lowest Since 2005 in New York

By Debarati Roy

Platinum volatility slumped to the lowest in nine years amid fading investor interest in the metal used in pollution-control devices for cars

The 60-day historical volatility was near 11 today, after dropping to 10.94 on Sept. 5, the lowest since June 2005, according to data compiled by Bloomberg. Open interest in New York futures and options has declined in seven of the past eight weeks, while holdings in global exchange-traded products are at the lowest since late May.

Prices have retreated 5.8 percent since the end of June, on pace for the biggest quarterly loss in more than a year, amid signs of slowing economic growth in Europe. The region accounts for 25 percent of global demand. The European Central Bank last week unexpectedly cut interest rates and announced a bond-buying program in a bid to revive expansion.

“The interest is diminishing as people are worried about Europe,” Bart Melek, the head of commodity strategy at TD Securities in Toronto, said in a telephone interview. “We expect prices to remain weak unless the stimulus program announced by the ECB is able to boost growth.”

Platinum futures for October delivery fell 1 percent to settle at $1,397.50 an ounce at 1:15 p.m. on the New York Mercantile Exchange, after touching $1,396.80, the lowest for a most-active contract since April 24.

Prices had climbed 7.9 percent in the first half of the year as a five-month strike disrupted mine production in South Africa, the world’s biggest producer. The stoppage ended in late June, and the metal retreated 3.9 percent over the next two months.

Open interest in the Nymex market has slumped 12 percent to 70,683 futures and options since reaching a 16-month high in July. Money managers lowered their bets on a price gain by 34 percent last month, the most since April 2012, Commodity Futures Trading Commission data show.

See the original article >>

We have hit PEAK gold

by Frik Els

Where will we find the gold?

The CEO of the world's most valuable gold miner Goldcorp (TSE:G) says "peak gold" will be reached this year or in 2015.

Chuck Jeannes told the Wall Street Journal global gold production will start to decline "as easy-to-mine gold deposits become harder to find" and in the absence of any major technological breakthrough:

"Whether it is this year or next year, I don't think we will ever see the gold production reach these levels again," he said. "There are just not that many new mines being found and developed."

Jeannes says a drop in mine supply from a high of 2,270 tonnes in 2013 will support the gold price and lead to further consolidation in the industry as gold majors opt to buy ounces.

Last year Goldcorp, worth $22.3 billion on the Toronto Stock Exchange, made an unsuccessful bid for fellow Canadian miner Osisko, but Jeannes could not be drawn on whether the Vancouver-based company plans to launch any other bids in the short term.

Goldcorp said last week its 2014 output could end up near the bottom end of its forecast range of 2.95 – 3.1 million ounces because of production problems at a Mexico mine.

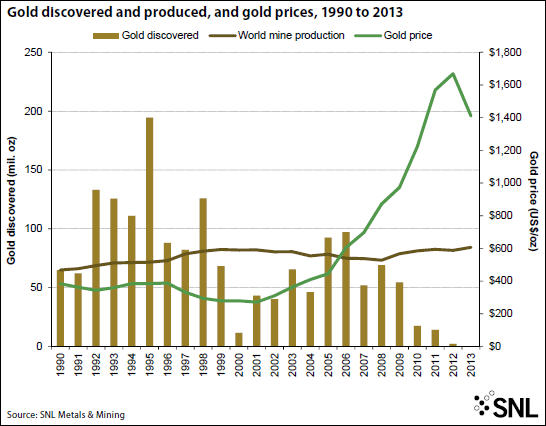
Over the past 24 years, mining companies discovered 1.66 billion ounces of gold in 217 major gold discoveries, according to a recent study by SNL Metals & Mining, a resources research house.

The amount of gold discovered and the number of major discoveries (defined as any deposit with a minimum of 2 million ounces of contained gold) have been trending downward over time, from 1.1 billion ounces in 124 deposits discovered during the 1990s to only 605 million ounces in 93 deposits discovered since 2000.

Only seven gold deposits holding more than 2 million ounces have been discovered this decade vs 22 in 1995 alone

The amount of potential production from these major discoveries is particularly concerning when looking at the discoveries made in the past 15 years. Assuming a 75% rate for converting resources to economic reserves and a 90% recovery rate during ore processing, the 674 million ounces of gold discovered since 1999 could eventually replace just 50% of the gold produced during the same period the  Strategies for Gold Reserves Replacement study found.
Considering that only a third of the discovered gold has been upgraded to reserves or has already been produced, and that many of these deposits face significant political, environmental or economic hurdles, the amount of gold becoming available for production in the near term is certainly much less, the report adds.

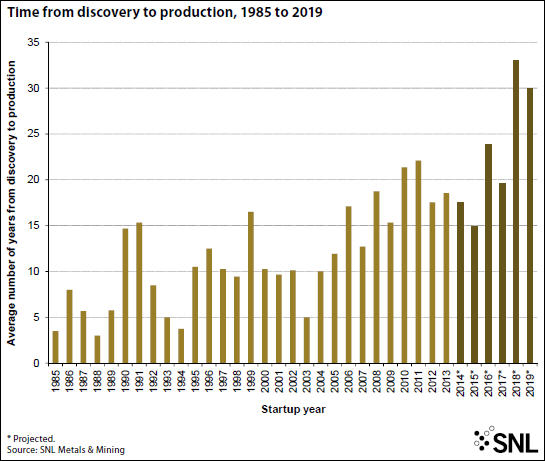
The time it takes to bring a deposit into production is also increasing significantly, slowing the rate at which production is replaced. Between 1985 and 1995, 27 mines with confirmed discovery dates began production an average of eight years from the time of discovery. The time from discovery to production increased to 11 years for 57 new mines between 1996 and 2005, and to 18 years for 111 new mines between 2006 and 2013.

The length of time from discovery to production is expected to continue trending higher: 63 projects now in the pipeline and scheduled to begin production between 2014 and 2019 are expected to take a weighted-average 19.5 years from the date of discovery to first production.

See the original article >>

Fiat's Marchionne to become new Ferrari chairman after Montezemolo quits

by Agnieszka Flak

Fiat Chief Executive Sergio Marchionne looks on during a meeting with Italian Prime Minister Matteo Renzi (not pictured) to mark the presentation of new 'Jeep Renegade' car at Chigi palace, in Rome July 25, 2014.  REUTERS/ Max Rossi

Fiat Chief Executive Sergio Marchionne

MILAN (Reuters) - Luca Cordero di Montezemolo will step down as chairman of Ferrari as of Oct. 13 and will be replaced by Sergio Marchionne, who also serves as the chief executive of parent group Fiat (FIA.MI).

The departure of Montezemolo, announced by Fiat on Wednesday, was widely expected after escalating clashes between the two executives over strategy and the role of the luxury sports car business within the Fiat group.

Fiat shares were up 2.4 percent by 0721 GMT (3.21 a.m. EDT), against a 0.1 percent fall for Milan's blue-chip index .FTMIB.

Montezemolo, Ferrari's chairman since 1991, has been wanting to keep Ferrari autonomous, while Marchionne has been pushing to better integrate the business within Fiat to boost the group's move into the premium end of the car market as it seeks to rival the likes of Volkswagen (VOWG_p.DE) and BMW (BMWG.DE).

The Oct. 13 resignation date coincides with the day when Fiat, which owns 90 percent of Ferrari, plans to list Fiat Chrysler Automobiles in New York after completing a merger with its U.S. business and cementing a shift of the Italian group from its home for the past 115 years.

"Ferrari will have an important role to play within the FCA Group in the upcoming flotation on Wall Street. This will open up a new and different phase, which I feel should be spearheaded by the CEO of the Group," Montezemolo said in a separate statement.

Marchionne said that he and Montezemolo had discussed the future of Ferrari at length and that "our mutual desire to see Ferrari achieve its true potential on the (Formula One racing) track has led to misunderstandings, which became clearly visible over the last weekend".

The Fiat CEO said on Sunday that the recent disappointing performance of Ferrari's Formula One racing team was "unacceptable" and that it was "absolutely non-negotiable" that Ferrari should win Formula One races

Under Montezemolo's more than two decade-long tenure, Ferrari raced to the top of the Formula One grid, increased revenues tenfold and tripled sales volumes as the Italian family business grew into one of the world's most powerful brands.

See the original article >>

Should Mario Draghi Spend More Time on Twitter?

By Todd Buell

    Reuters

    Should European Central Bank President Mario Draghi spend more time checking out social media to help him gauge the state of the economy?

    Two scholars from the Dutch national statistics agency CBS, Piet J.H. Daas and Marco J.H. Puts, argue in a recent paper that following social media might be a faster way for policymakers to gauge consumer confidence that waiting for more conventional surveys.

    Consumer confidence indicators typically give an early read on how the public responds to geopolitical events or changing economic policies – such as the rate cuts and bond buying programs announced by the ECB Thursday.
    With consumer spending accounting for the lion’s share of gross domestic product in advanced economies, confidence surveys are among the most closely-watched indicators and can influence stock and bond markets.

    Official data show that Dutch sentiment has increased through much of the year, but fell in August.

    The paper suggests that this key information can be gleaned earlier from looking at aggregate social media data.

    “Consumer confidence and monthly aggregated social media sentiment display a similar development,” write the authors. “Changes in the sentiment of social media routinely preceded changes in consumer confidence. This lag is in the order of seven days.”

    The authors suggest that Mr. Draghi and other policymakers should take social media more seriously.

    “If changes in social media sentiment are indeed related to Dutch consumer confidence, they could be used as a readily available indicator for changes in consumer confidence and, as such, may contribute to, or even provide an early indicator of, an important official statistic,” say the scholars. This knowledge could offer “important information on the state of the economy” to policymakers, write the authors.

    To conduct its study, the statisticians used both data used for official monthly consumer confidence reports and data on social media purchased from a Dutch company called Coosto, which has a collection of over 3 billion social media messages from 2009 to the present. Coosto automatically determines the sentiment of its collected messages as either positive, negative or neutral based on the types of words (in Dutch) that are used, and the use of smiley faces.

    The ECB is active on twitter; it has had a twitter feed for about five years. Still, there are limits to how far the ECB will go in the social media revolution. Remarks from then Executive Board member Joerg Asmussen over two years ago remain valid: “I would not expect every member of the ECB Governing Council to open a twitter account soon or to accept you as friends on Facebook.”

    Indeed, an ECB spokesman said that at present no members of the ECB’s six-person Executive Board has a twitter account.

    See the original article >>

    Gold may be a ‘buy’ as investors turn ever more bearish

    By Mark Hulbert

    The last time such gloom set in, the yellow metal staged a rally

    CHAPEL HILL, N.C. (MarketWatch) — Gold is finally getting close to a bottom in prices.

    That is the surprising conclusion of contrarian analysis, which for months now has stubbornly refused to turn positive on gold — even as the yellow metal has suffered a death by a thousand cuts. Just this week, for example, bullion hit a fresh three-month low — among indications that gold’s recent decline has violated some key technical levels.

    But what contrarians focus on is market sentiment, and on that front there has been a big change: For the first time in a long time, a large number of short-term gold timers have decided to throw in the towel.

    As a result, the market-timing community on balance is now more bearish than it has been in 14 months — which, according to the contrary logic of contrarian analysis, is a bullish development. The last time the typical gold timer was as gloomy as he is today, gold began a two-month rally in which it gained more than $200.

    Consider the average recommended gold market exposure level among a subset of short-term gold market timers tracked by the Hulbert Financial Digest (as measured by the Hulbert Gold Newsletter Sentiment Index, or HGNSI). This average currently stands at minus 40.6%, which means that the typical gold timer is recommending that clients allocate nearly half their gold-oriented portfolios to going short the market.

    That’s a particularly aggressive bet that gold will keep declining, and — at least according to contrarian analysis — these timers are unlikely to be right.

    As recently as last week, the HGNSI had not fallen below minus 21.9%. That was less than the lows to which this sentiment index fell last December (minus 36.7%) and in the summer of 2013 (minus 56.7%). And that, in turn, led me to conclude that contrarians were not yet ready to bet on even a short-term rally.

    That’s why, in mid-July — the last time I devoted a MarketWatch column to a contrarian analysis of gold — I argued that sentiment conditions were not yet favorable for gold. “Unless you have nerves of steel and are ready and willing to hold on to gold despite extraordinary volatility,” I concluded, “you might want to wait until sentiment conditions are more favorable.” Gold at that time was trading at around $1,310 an ounce.

    The usual qualifications apply, of course. Sentiment is not the only thing that moves the markets. And even when contrarian analysis is right, it doesn’t necessarily have pinpoint accuracy. But, because sentiment analysis has been on the correct side of this gold market in recent months, it’s definitely noteworthy that it’s now more optimistic.

    See the original article >>

    Follow Us