Tuesday, September 9, 2014

Apple Recap: All the Gadgets and News From the Big Event

By Christina Bonnington

apple-event-0909-1

Alex Washburn/WIRED

CUPERTINO, California—Today Apple unveiled a trifecta of new products that are surely sending worrisome ripples down the spines of the company’s competitors.

At a massive media event here at the Flint Center for Performing Arts, Apple announced two new large-screen iPhones, a new mobile payment platform, and an advanced touchscreen wristwatch. Judging by the numerous outbreaks of applause and the occasional standing ovation, the new products were met with great support by the huge audience of press, Apple employees, and VIPs from the entertainment, technology, and fashion industries.

But don’t worry if your eyes weren’t glued to the video livestream—or if you were one of the countless viewers who suffered from numerous drop-outs and technical problems and were left in the dark for much of the event. Here are the most important things you need to know about Apple’s big day.

The New iPhones: iPhone 6 and iPhone 6 Plus

After a dramatic introductory video, Apple senior vice president Phil Schiller unveiled two new iPhone models today, the iPhone 6 and iPhone 6 Plus. Both are styled with a smooth, brushed aluminum rear face that curves gently into the front face. They look like small iPads.

The iPhone 6 has a 4.7-inch display with a 1334×750 pixel resolution. The iPhone 6 Plus features a 5.5-inch screen with full HD 1920×1080 display resolution. Other than this size difference, the phones are essentially the same.

apple-event-0909-2

Alex Washburn/WIRED

On the rear, they’ve got an 8-megapixel shooter with an f/2.2 aperture 8-megapixel camera. It’s got a new sensor and speedier autofocus. The 6 has digital image stabilization, but the 6 Plus also has additional optical image stabilization that uses its gyroscope and the M8 coprocessor to cancel out extra shakiness. The front-facing camera gets some new features like HDR and a burst-shot mode.

Inside, an A8 processor promises to be up to 87 percent more efficient than its predecessor, offering CPU processing power up to 25 percent faster and GPU speeds up to 50 percent faster than the iPhone 5s’ A7 chip. The M8 motion coprocessor, in addition to aiding in image stabilization, can now tell when you’re walking, running or cycling, and can give you credit if you’re traversing up and down stairs thanks to a barometer that detects changes in air pressure.

Both devices feature Touch ID home buttons and NFC (more on that in a sec). The iPhone 6 goes on sale Friday, September 19th starting at $200 on contract for 16 GB, $300 for 64 GB, and $400 for 128 GB. The iPhone 6 Plus starts at $100 more.

ApplePay, Apple’s Mobile Payment Initiative

“Payments is a huge business. Every day between credit and debit, we spend $12 billion, and that’s just in the United States,” Cook said to introduce what a huge space payments is—a huge space digital payments have yet to crack.

apple-event-0909-3s

Alex Washburn/WIRED

Working with American Express, MasterCard, and Visa, the new ApplePay system as been designed to work with over 220,000 merchants at launch, including familiar locations like Walgreens, Whole Foods, Macy’s, and Target. Using NFC, you simply tap your phone on a payment terminal to purchase things. It’s that easy. How it works is a bit more complicated though. It uses a combination of NFC, Touch ID, and a secure chip Apple calls the Secure Element. You add a card by snapping a photo of it, then getting verification from your bank. During a transaction, a unique device number, rather than the actual credit card information, is sent to the merchant along with a dynamic security code. Apple doesn’t collect your data—what you buy is between you and the merchant. And if you lose your iPhone, you can suspend payments with Apple’s standard-issue Find My Friends app without needing to cancel your actual credit card.

It will launch in the U.S. in October as an update to iOS 8.

Apple’s Wearable: The Apple Watch

The biggest question mark surrounding today’s event was whether Apple would actually unveil its long-rumored wearable computing product. The company did not disappoint. The Apple Watch is officially here.

“Apple watch is the most personal device we’ve ever created,” Cook said after receiving a standing ovation and a round of wild applause. Apple’s CEO calls it “a new intimate way to connect and communicate direction from your wrist.”

The timepiece, which is accurate to within plus or minus 50 milliseconds, is not just technologically impressive. It’s also quite stylish. The faces and the different hardware choices let you trick out the watch to match your own personal style.

apple-event-0909-3

Alex Washburn/WIRED

The watch face looks very similar to a traditional watch, including a dial on the side that Apple calls the “digital crown” that translates movement into digital data. Apple kept some of the tech specs on the vague side—the product won’t actually ship until next year. What we do know is that the display is a sheet of sapphire, and inside is a custom designed chip encapsulated to protect the electronics. On the rear are four sapphire lenses which hold LEDs and photo sensors for detecting your heart rate.

With regards to looks, the Apple Watch is a bit of a chameleon. It comes in three editions: Apple Watch, Watch Sport, and Watch Edition. Apple Watch is the most basic, Watch Sport is more durable, and Watch Edition is more exotic and made of gold. There are six different straps you can mix and match to suit your needs: a quilted leather strap with a magnetic clasping band, a traditional leather buckle, a stainless steel link bracelet, and a mesh chain loop are among the choices. The device comes in not just two band sizes, but two watch face sizes, to suit folks with different-sized wrists.

But it’s not just the hardware that’s customizable. “With every breakthrough, Apple has also had to have a breakthrough in user interface,” Cook said. What Apple didn’t do, he says, is take the iPhone and shrink the interface and strap it on your wrist. The display is too small, and it would make for a terrible user experience. Instead the digital crown is a key part of the navigation experience, as are onscreen taps and swipes.

The menu screen is composed of bubbles of circular app icons you can arrange however you like, including grouping them by “neighborhood” of related apps. Twisting the crown zooms in and out on the group of apps. To open an app, you tap it. A feature called Glances lets you swipe upwards from the bottom of the screen to cycle through a customizable series of data screens. Siri is built into the watch, so you can dictate questions like “What movies are playing tonight?” A new feature called Digital Touch lets you select a contact then send a super-quick message just based on taps and drawings that your contact can then feel (via a vibration) when it reaches their wrist. It’s intended for messages that have a more personal context—and are a lot less wordy—than your usual text message.

The Apple Watch has a number of other apps including Maps, notifications from third-party apps, and a lot of customizable watch faces. Third-party apps, like ones from American Airlines and W Hotels, are also on the way. A pair of Apple-built health and fitness apps use both the watch and your iPhone’s sensors to give you a holistic view of your daily activities, combining the features of a general activity tracker and an advanced sport watch.

The Apple Watch charges using an inductive charger that fits on the back of its rectangular face. There’s no word about exact battery life yet. Few details were given about pricing, as well. All we know is that the Apple Watch will start at $350, and that it will go on sale in early 2015.

See the original article >>

Is Apple Watch a disappointment?

By Jennifer Booton

NEW YORK (MarketWatch) — Apple AAPL, -0.09%  unveiled Apple Watch on Tuesday after several months of hype, however the reaction in the tech world has been largely ho-hum, if not outright disappointment.

The smartwatch will hit stores shelves in early 2015 with a $349 price tag. It will feature virtually everything that was rumored, including compatibility with new payments service Apple Pay.

However, the watch needs the iPhone 5 or a later version to operate, which doesn’t make it all that different from the way Galaxy Gear 005930, -0.74%  and Motorola’s Moto 360 0992, +2.44%  work.

Apple is known to completely shake up markets, delivering products in pretty, easy-to-use packaging that blow the minds of even the earliest tech adapters. The question now is: are expectations just too high? Or is the first-generation Watch just not all that exciting?

“The initial reaction was that it looked and appeared more compelling than expectations,” said Brian Fenske, director of ITG’s sales and trading unit for technology, media and telecom. “But I think as people sat back and absorbed it, they wondered whether it’s a transformative product category, the way the iPad was a category creator.”

“The initial look at the Apple Watch does not appear to excite investors, but consumers will be the ultimate judge.” Walter Piecyk, BTIG Reserach

While the Watch will inevitably draw significant media attention over the next few months, Fenske said it’s the iPhone 6, expected to hit shelves later this month, that will really be the revenue driver out of everything unveiled in Cupertino on Tuesday -- at least for now.

The problem, tech analyst Roger Kay says, is that the market still hasn’t identified a real need for a smartwatch, unlike when Apple introduced the iPhone a decade ago, or even the iPad in 2010.

“There’s a learning curve, and no one yet has figured out what they want to do with a digital watch,” said Kay, who serves as president of Endpoint Technologies Associates. “People are all watching each other saying, ‘I don’t know, is this a good thing?’”

Ramon Llamas, research manager of smartphones at IDC, said the Apple Watch looks just as Apple intended: a first generation smartwatch.

“If you go through some of these applications, a lot of these are similar to what we see for other devices,” Llamas said. “But how do you turn that from novelty-ware to ‘what can I really do here?’ Apple hasn’t yet cracked the code.”

To be fair, there was similar skepticism initially when Steve Jobs introduced the iPad, which was at first criticized as just a larger iPhone.

2014-09-09_23-37-07

Shares of Apple closed down 0.38% to $97.99 on Tuesday after touching an intraday high of $103.08 during the event.

See the original article >>

Italy set for zero growth in 2014: PM Renzi


Italian Prime Minister Matteo Renzi grimaces as he addresses the Festa dell'Unita, the annual Democratic Party (PD) meeting, in Bologna on September 7, 2014

Italian Prime Minister Matteo Renzi grimaces as he addresses the Festa dell'Unita, the annual Democratic Party (PD) meeting

Rome (AFP) - Italy's economy will register "around zero" growth over the course of 2014, Prime Minister Matteo Renzi admitted on Tuesday.

It was the first time that Italy's centre-left leader had put a figure on the likely impact of the economy slipping back into recession for the third time in less than a decade during the first two quarters of this year.

"I am not optimistic," Renzi said in a pre-recorded interview due to be broadcast on Tuesday evening. "We are expecting (a figure) more or less around zero.

"It is not enough to restart. It is the end of the fall but it is not a recovery."

The unexpected slowdown of Italy's economy over the first half of this year has cast doubt on whether Renzi can deliver on his promise to comply with the budget rules that apply to members of the eurozone while also boosting growth and reversing the upward trend in unemployment.

Renzi also used Tuesday's interview to welcome the recent downward trend of the euro, arguing that a fall to around $1.20 (from a 14-month low of around $1.29 in trading Tuesday) would make European exports more competitive.

"For our companies, for our world, this would be a very, very important factor," Renzi added.

See the original article >>

Platinum Fixing Under the Microscope

by Dimitri Speck

Is it honest or is there fraudulent manipulation?

First fines have been imposed for manipulation of the gold fixing, the silver fixing is even discontinued entirely. But is everything in order with the platinum fixing? Have there been manipulations – and are they part of a larger manipulation campaign?

The precious metals fixings have the purpose of enabling large volume trades. However, they also provide reference prices, which are used by merchants and have an effect on subsequent trades. They are therefore an especially suitable target for price manipulations. There have already been statistical hints as far back as 2002 that systematic manipulation of the gold fixing was taking place; in 2011 similar hints emerged in the silver fixing.

We now want to examine the platinum fixing. It takes place twice daily, at 09:45am (AM fixing) and at 2:00pm (PM fixing) London time, which is equivalent to 4:45am and 9:00am EST. It takes a not precisely predetermined amount of time lasting several minutes until the fixing price is established.

There are reliable methods to trace price manipulations taking place at specific times of the day. Calculation of an average intra-day price trend over many days often provides clear evidence. Similar to gold and silver, this method can also be employed to uncover systematic manipulation in the platinum market. We use one-minute prices of futures contracts from December 1997 to April 2014. From these we calculate the average of intra-day price movements.

Fig.1 is therefore no normal intra-day price chart. It rather shows how the platinum price has behaved in the course of the average trading day over approximately the past 16 years. It shows the typical movements – calculated from millions of prices. The horizontal axis shows the time of the day (EST), the vertical axis the average price level (indexed to 100). Since it is an average over a great many days – 4189 all in all – the size of the moves is relatively small.

Chart-1-Platinum intraday averageFig. 1: 16 year average intra-day platinum price – the PM fixing stands out …
On the chart, several points in time can be discerned when the average price behaves conspicuously. Especially noteworthy is the decline at the PM fixing. There is, however, also a mild decline at the AM fixing and when the main trading period begins at the COMEX at 8:20am. Interesting also is the slightly accelerated advance near the close of COMEX trading at 1:05pm.

This indicates an upward price manipulation. Trading house Moore Capital was fined for precisely such manipulations at the close of trading – a nice confirmation of the method’s validity. However, most conspicuous are the price moves at the PM fixing. We want to examine these more closely. For this purpose, we take a closer look at average intra-day prices around the time of the PM fixing.

Fig.2 shows a close-up of the previous chart, including the 30 minutes before and after the beginning of the fixing. We can see that prices begin to slowly decline from 8:50am onward. Once the fixing begins at 9:00am, the price decline accelerates between 9:01 and 9:05. Thereafter, average intra-day prices already begin to embark on a counter-movement. From this progression it can be surmised that the typical duration of the fixing over these years was approximately five minutes.

Chart-2-close-up of fixing
A close-up of the time period surrounding the afternoon fixing (EST).

For the further examination we will limit ourselves to studying the interval between 9:00am and 9:05am (the “fixing period”). Any manipulations that take place at other times – including those in the minutes preceding the fixing – are not pursued further at this juncture. We thus analyze the price movements of the five-minute interval between 9:00am, the beginning of the fixing, to 9:05am, the time when the downward move on the average intra-day price chart ends. During this time period, the strongest part of the decline occurs. The PM fixing takes place concurrently.

The study includes the price moves of altogether 4189 days – a time period of 16 years. On average, platinum prices fell by 0.0272% in the five minutes of the afternoon fixing. Given that platinum actually rose from $376 to $1,440 during those years, a slight increase would normally have been expected. During the 4189 fixing phases there have been 1730 price increases and 2195 price declines. 271 times prices remained unchanged. One would have at least expected as many price increases as declines. Statistically, there is therefore an excess of 236 price declines at a minimum. A coincidence?

See the original article >>

The Dollar is about to Kill Bonds

by Greg Harmon

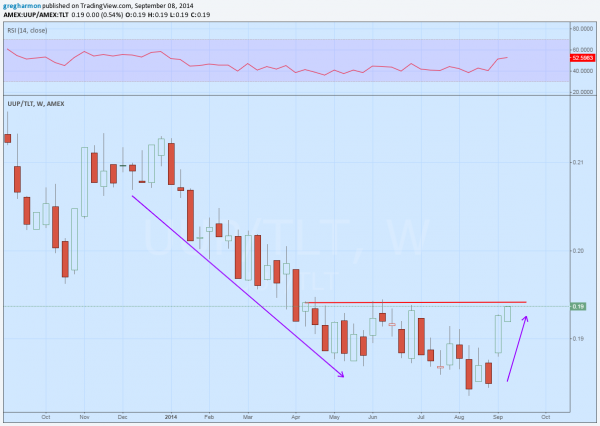
After a 8 month run lower, the US Dollar looks to be breaking the trend against US Treasuries. The chart below shows the price ratio of the US Dollar Index ($UUP) since the beginning of the year measured in terms of the US Treasury ETF ($TLT) fell about 15% in a steady move to start the year that slowed into the summer. This should come as no surprise as the US Dollar was steady all year until recently while US Treasuries have been in high demand. But with the last two weeks that trend is changing. Relative demand for the US Dollar Index has outstripped that for US Treasuries as the US Dollar Index has been strengthening. This may just be a blip in the markets but if the ratio can get above the red line it will confirm a reversal. The momentum indicator RSI is picking up, supporting that event happening.

uup-tlt

There are all sorts of macro economic interpretations that can be used to explain this. The week Sterling and Euro are leading to a stronger Dollar. Demand for US Treasuries is slowing as the conflict in the Ukraine settles. An increase in housing demand may lead to higher interest rates and or the Federal Reserve may see the growing economy as a reason to start tightening monetary policy. All of these or none of these may be true. But what are you going to do about it? The statements above may lead you to develop some macro economically driven trade. But the price action in the chart gives you an easy trade to put on.

Buy the US Dollar Index ETF UUP and sell the US Treasury ETF TLT

After you put that on you can come up with your own macro reason for it to work to talk about at cocktail parties and tailgates. But let your money follow the price action.

See the original article >>

Steady As She Goes or S&P at 2500?

by Tom Aspray

Ahead of the widely anticipated announcement by Apple, Inc. (AAPL), stocks drifted lower led by the gold miners and oil and gas stocks. More stocks declined than advanced as the McClellan oscillator has dropped back below the zero line, closing at -68.

It is difficult to imagine that AAPL can match the market’s expectations as seats closer to the front of the waiting line outside the NYC store were sold for $1250 each. The stock has already dropped over 5% from its high with monthly pivot support at $96.22. The market’s reaction to the announcement is likely to set the tone for the market over the next few days.

Apple stock is one of the picks from Barron’s mid-year survey of ten Wall Street strategists and the consensus view is for the “the bull to stay in charge for the rest of this year.”

One of their analysts became even more bullish as Federated Investor’s Stephen Auth “expects the S&P 500 to climb to 2500 in the next 18-24 months.”  He was one of the few strategists that was correctly bullish at the end of 2012. The bullish camp is becoming more crowded as two bearish market strategists from Deutsche Bank and Stifel Nicolaus have switched to the bullish camp.

Click to Enlarge

This does make me a bit nervous as following the crowd is often a dangerous strategy. Though it does not change the bullish intermediate-term outlook from the A/D lines, it does allow for a deeper correction within the major uptrend.

I do get some good ideas from the stock picks of these strategists as their fundamental research teams are top notch. The table above provides the top picks of each analyst and I have selected the four that look the best to me from a technical standpoint.

Click to Enlarge

Chart Analysis: Workday, Inc. (WDAY) is a $17.44 billion provider of cloud-based human resources software. It is trading 19.3% below its 52-week high but is still up over 13% YTD.

  • Monday’s close was just above the daily chart resistance, line a, at $92.15 from the early July high.
  • The monthly projected pivot resistance is at $98.02 with the quarterly resistance at $102.83.
  • The daily relative performance has closed above its resistance, line c, which indicates it is becoming a market leader.
  • The weekly RS line (not shown) has been above its WMA since early August and has turned up sharply.
  • The daily OBV has formed lower highs, line e, as there was heavy selling at the end of August.
  • The weekly OBV (not shown) has been leading prices higher as it broke out to new all time highs in the middle of last month.
  • There is minor support in the $91.55-$92 area.
  • The rising 20-day EMA and the monthly pivot are in the $88-$88.44 area.

Salesforce.com, Inc. (CRM) is a $37.4 billion company that is likely better known than WDAY but also provides cloud-based enterprise computing solutions. The stock is now 9.91% below its 52-week high but is still up 9.37% YTD.

  • The daily chart shows that CRM has been recently bumping into resistance (line f) that does back to March.
  • There is quarterly pivot resistance now at $62.23 with the weekly starc+ band at $64.68.
  • A convincing breakout of the daily trading range (lines f and g) has upside targets in the $67-$69 area.
  • The relative performance shows a similar trading range, lines h and i, that appears to have already been completed.
  • The daily on-balance volume (OBV) staged an impressive upside breakout last month as the resistance at line j, was overcome.
  • The weekly OBV (not shown) is just barely above its WMA.
  • There is initial support at $57.80 and the rising 20-day EMA.
  • There is more important support in the $55.20 (quarterly pivot) and $56.30 area.

Click to Enlarge

Comcast Corporation (CMCSA) is a $144.5 billion dollar communication giant that is trading just slightly below its 53-week high of $56.49.

  • The daily starc+ band is just a bit lower at $56.40.
  • The quarterly projected pivot resistance is at $58.24.
  • The daily RS analysis shows a gradually upward sloping trading channel, lines c and d.
  • The RS line has just moved back above its WMA and the weekly RS line is also in a trading range.
  • The daily OBV broke through its downtrend, line e, in July.
  • It has continued to rise very sharply as it surged powerfully in the past week.
  • The rising 20-day EMA is at $54.71 with the monthly pivot at $54.11, which corresponds to the daily support at line b.
  • There is more important daily chart support in the $52.50 area.

McKesson Corporation (MCK) is a $46.23 billion provider of drugs, medical supplies, and healthcare information technology. The stock is very close to its 52 week high and is up 24.13% YTD.

  • The daily starc+ band is not far above current levels at $201.63 with the weekly at $206.41.
  • MCK is currently trading 2.7% above its 20-day EMA at $194.81, so it is in a high risk area.
  • There is stronger support now at $192.20 and the monthly pivot.
  • The support going back to the June lows, line h, is now at $187.57.
  • The daily RS line has turned up sharply over the past few days as it appears to have held support at line i.
  • The weekly relative performance (not shown) has been positive since early 2013 and is still holding above its WMA.
  • The daily OBV shows a sharper uptrend (line j) then the RS line and is close to making new highs.
  • Overall volume has declined over the past month but the weekly OBV is still making new highs.

What it Means: The relative performance analysis clearly makes Workday, Inc. (WDAY) and Salesforce.com, Inc. (CRM) my two favorite picks. Both need a pullback so that a reasonable stop can be used as both stocks can be quite volatile.

Though the daily technical outlook is also positive for Comcast Corporation (CMCSA) and McKesson Corporation (MCK), they are both near their 52-week highs, which increases the risk at current levels. They may be, therefore, more vulnerable on a market correction.

How to Profit: For Workday, Inc. (WDAY) go 50% long at $90.52 and 50% long at $89.66 with a stop at $84.93 (risk of approx. 5.7%).

For Salesforce.com, Inc. (CRM) go 50% long at $58.03 and 50% long at $56.77 with a stop at $54.71 (risk of approx. 4.6%).

See the original article >>

Is Venezuela next?

By Sebastian Boyd and Ye Xie

Venezuelan debt traders are beginning to consider the possibility the country may run out of money.

The cost of insuring the country’s foreign-currency bonds against non-payment soared yesterday by the most since the aftermath of Lehman Brothers Holdings Inc.’s collapse in 2008 to 14.25 percentage points, the most expensive in the world. Investors are also demanding the biggest premium in six months to insure the South American nation’s notes over those from war- torn Ukraine.

While most analysts and investors expect Venezuela and its state-owned oil company to make $5.3 billion in bond payments coming due next month, concern is mounting the country may find itself without enough cash to service debt as soon as next year as foreign reserves drop to an 11-year low and oil prices sink. The nation’s notes tumbled yesterday after Ricardo Hausmann, a Venezuelan-born economist at Harvard University, questioned the government’s decision to keep paying bondholders in the face of shortages of everything from basic medicine to toilet paper.

“The bond market is finally beginning to wake up” to the possibility of Venezuela defaulting, David Rees, an economist at Capital Economics in London, said by phone. He predicts the country could default as soon as this year.

A spokeswoman for Venezuela’s Finance Ministry declined to comment on Hausmann’s remarks.

‘Moral Grounds’

The nation’s five-year credit-default swaps jumped 1.76 percentage points yesterday after Hausmann, a former Venezuelan planning minister who is now director of Harvard’s Center for International Development at Harvard University in Cambridge, Massachusetts, said in an interview with Bloomberg News that there were no “moral grounds” for the government to make its debt payments next month.

The comment came after he co-wrote a Sept. 5 article in Project Syndicate titled, “Should Venezuela Default?” In the piece, he and Harvard research fellow Miguel Angel Santos highlighted how billions of dollars in arrears with importers and shortages are imposing hardship on Venezuelans.

“The fact that his administration has chosen to default on 30 million Venezuelans, rather than on Wall Street, is not a sign of its moral rectitude,” they wrote. “It is a signal of its moral bankruptcy.”

Bond Losses

Venezuela’s bonds fell 4.4 percent yesterday, pushing the extra yield investors demand to own the nation’s debt instead of U.S. Treasuries to a six-month high of 11.95 percentage points, data compiled by Bloomberg show. The country’s notes now yield 3.31 percentage points more than debt from similarly rated Ukraine.

The probability of Venezuela missing a payment on its bonds in the next five years rose four percentage points to 63 percent yesterday, according to traders in the credit-default swaps market. The cost of insuring Venezuela’s debt passed Argentina’s after that country missed a July 30 payment deadline, causing trading to be suspended.

Venezuela has handed bond investors losses of 8.5 percent since President Nicolas Maduro took office on April 19, 2013, versus an average 3.6 percent gain for emerging-market sovereign bonds, according to Bloomberg indexes. During the 14-year tenure of Maduro predecessor Hugo Chavez, Venezuelan notes returned 677 percent, beating the 387 percent average advance for developing- nation debt, data compiled by JPMorgan Chase & Co. show.

The yield on Venezuela’s bonds due in 2022 fell 0.13 percentage point today to 15.67 percent as of 11:01 a.m. in New York from a six-month high of 15.8 percent yesterday.

Oil Prices

The OPEC member’s securities have also been punished by the 10 percent drop in benchmark oil prices during the past year, according to Michael Ganske, who holds the country’s bonds in the $8 billion of emerging-market debt he oversees at Rogge Global Partners Plc in London. Crude now trades at about $94 a barrel, down from a peak of $145 in July 2008.

While Venezuela’s bonds have tumbled this month, they’re still trading above two-year lows set in February, amid violent street protests against Maduro’s government that have left 43 people dead. The country last defaulted on its foreign debt in the 1980s, when a financial crisis swept across Latin America.

Barclays Plc analysts Alejandro Arreaza and Alejandro Grisanti recommended yesterday that investors take advantage of the bond sell-off to buy, saying the country has enough money to keep making debt payments and the cost of a default “could be very high.”

The country earns about $70 billion a year from oil exports, with total debt service equal to about 25 percent of that amount.

Soaring Inflation

One of the obstacles the government could face in defaulting is that bondholders may seek to seize the assets of Citgo Petroleum Corp., the U.S. refining and distribution arm of state oil company Petroleos de Venezuela, to recoup their money.

“Citgo itself is seen as a deterrent to default because it’s a physical asset offshore to attach,” Siobhan Morden, the head of Latin American fixed-income strategy at Jefferies Group LLC, said by phone.

Petroleos de Venezuela said last month it’s looking to sell Citgo for at least $10 billion. Even that amount wouldn’t cover arrears to importers that Morgan Stanley estimated in June may be as much as $13 billion, a figure that equals more than half the country’s $21.6 billion of foreign reserves.

The increasing difficulty of finding dollars is forcing Venezuelans to the government’s official distribution depots, where they line up for subsidized goods with numbered tickets that give them the right to buy items including frozen chicken, rice and cooking oil.

Economic Data

Venezuela has delayed regular reporting of economic statistics and has yet to publish inflation data for June, July or August after annual consumer-price increases reached 61 percent in May, the highest in the world.

“The reason there’s such a serious problem in Venezuela is horrible macroeconomic policies, and that can be fixed,” said Lars Christensen, the chief emerging-market economist at Danske Bank A/S in Copenhagen. “But if Venezuela defaults today, nothing would have changed in terms of the horrible policies of the Venezuelan government.”

See the original article >>

Brazil data sends sugar prices close to 4-year low

by Agrimoney.com

Sugar prices tumbled to within an ace of a four-year low after output of the sweetener from Brazil's main producing region was shown extending an August revival, despite talk of damage to the cane crop from drought.

Sugar futures for October touched 14.71 cents a pound in late morning deals in New York, down 1.5% on the day - and just 0.01 cents from matching the lowest level for a spot contract since June 2010.

The contract had been in positive territory before Unica, the Brazilian cane industry group, unveiled data showing that sugar production in the country's key Centre South district topped 3.0m tonnes in the second half of August.

That was the best performance for any half-month so far in 2014-15, which started in April, and up 8.1% from output in the first half of August.

Strong sugar levels

The increase reflected in part a rise in Centre South cane processing to 47.4m tonnes in the second half of last month, up 5.7% from production in the first half, although down 2.9% on volumes in the same period of 2013.

"The advancement of grinding in August was expected because this is usually the period of greatest sugarcane processing in the Centre South," said Antonio de Padua Rodrigues, the Unica technical director.

However, the concentration of sugars in cane - the so-called ATR - also rose to an unusually high level of 147.7 kilogrammes per tonne of cane, compared with an average of 132.7 kilogrammes so far in 2014-15.

"In some mills, the ATR determined exceeded 155 kilogrammes per tonne," Unica said.

In the second half of August 2013, the sugar level was 142.6 kilogrammes.

Drought effects

The high of level of sugars in cane allowed mills to elevate production of the sweetener despite allocating a bigger proportion of cane to making ethanol instead, at 54.7%, up 0.4 points from the level in the first half of August, and up 3.4 points year on year.

And it would appear to offer evidence of a positive effect from a period of persistent dry weather in the Centre South.

Drought, while lowering cane yields, concentrates sugar levels in the crop.

'Sudden death'

However, Unica, which two weeks ago cut its forecast for Centre South sugar production in 2014-15 by 1.15m tonnes to 31.35m tonnes, believes the benefit to cane sugar levels from dry weather will be more than offset by the dent to yields, resulting in a premature end to harvest.

The group last month also cut by 34m tonnes to 546m tonnes its forecast for the region's cane output.

Indeed, many commentators believe the cane harvest, which usually grinds to minimal levels in late November-early December, may wind up early – a so-called "sudden death" – mills run out of crop.

Unica said that three Centre South mills "have already closed" for the season.

See the original article >>

Hottest metal on the planet breaks support

by Chris Kimble

palladiumbreaksytdsupportsept9

CLICK ON CHART TO ENLARGE

When it comes to the metals complex, its not been that great of a year for Gold or Silver. On the flip side, Palladium has had a good year, as it was up near 25% YTD a couple of weeks ago.

Of late, Palladium is breaking a support line that has been in place the past 9 months.

I am of the opinion it pays to watch leadership...Keep a close eye here on Palladium price action over the next few weeks.

goldsilverfrancon10yrsupportsept2

CLICK ON CHART TO ENLARGE

What Palladium does going forward could have an impact on Gold & Silver, as they both set on support lines that date back 10-years above!

See the original article >>

Dollar to test new highs?

By David Goodman and Andrea Wong

The dollar touched the strongest in almost six years versus the yen as Treasury yields climbed on speculation U.S. economic reports this week will back the case for the Federal Reserve to boost interest rates next year.

An index of the greenback (NYBOT:DXZ14) advanced to a 14-month high after a Fed Bank of San Francisco report said yesterday markets may be underestimating the pace of rate increases. The pound (CME:B6Z14) rose from an almost 10-month low after Bank of England Governor Mark Carney said officials may increase their main rate in the spring. China’s yuan (CME:QTZ14) climbed to a six-month high as the central bank raised its fixing by the most in almost four years.

“A lot of focus was on the San Francisco Fed papers out yesterday—big moves on the bond market, and that definitely helps the dollar,” Brad Bechtel, managing director of Faros Trading LLC in Stamford, Connecticut, said in a phone interview. “That pressured euro lower, dollar-yen higher.”

The dollar rose as much as 0.3% to 106.39 yen (CME:J6Z14), the strongest since October 2008, before trading at 106.24 at 9:34 a.m. New York time, up 0.2%. The U.S. currency was little changed at $1.2887 per euro after appreciating to $1.2860, the strongest since July 2013. The euro gained 0.1% to 136.90 yen.

The Bloomberg Dollar Spot Index, which tracks the greenback against a basket of 10 major currencies, rose 0.3% to 1,048.06 and reached 1,048.69, the highest level since July 2013.

Fed Report

Low volatility across financial markets may reflect investors’ “relative certainty” about interest rates, San Francisco Fed researchers wrote. Investors may be less uncertain about their projections than Fed policy makers are about theirs, they wrote.

There’s a 60% chance the Fed will raise its benchmark interest-rate target to at least 0.5% by July 2015, futures trading shows. The likelihood was 52% at the end of August.

The Fed, which meets Sept. 16-17, is considering when to raise interest rates for the first time since 2006. It has held the key interest-rate target in a range of zero to 0.25% since 2008 to support the economy. Policy makers also are on track to end a bond-buying program in October.

U.S. initial jobless claims fell 2,000 to 300,000 last week, according to a Bloomberg News survey before the data on Sept. 11. Retail sales gained 0.6% in August from the previous month, when they stalled, a separate survey showed before the figures are published on Sept. 12.

‘New Highs’

“The dollar is likely to test new highs against the yen ahead of the Fed meeting next week,” said Kengo Suzuki, chief currency strategist at Mizuho Securities Co. in Tokyo. “The dollar broke out of the range as investors gained confidence in the U.S. economy and as the Fed deepens the debate about the policy after tapering ends.” The greenback may advance to 110 yen this year, he said.

The dollar jumped 4.1% in the past three months, the best performer among 10 developed-nation currencies tracked by Bloomberg Correlation-Weighted Indexes. The yen was little changed and the euro weakened 1.9%.

Treasury 10-year yields reached 2.51% today, the highest since Aug. 5, burnishing the appeal of U.S. dollar- denominated assets.

“It’s very supportive for the dollar that Treasury yields are now heading higher,” said Michael Sneyd, a foreign-exchange strategist at BNP Paribas SA in London. “When we had good data before, geopolitical risks kept yields down. Now that they are rising, the stars are aligning for the dollar.”

BNP forecast the dollar will climb to 110 yen by year-end, Sneyd said.

Carney Outlook

The pound jumped after Carney spoke at a conference in Liverpool.

“If interest rates were to follow the path expected by markets; that is, beginning to increase by the spring and thereafter rising very gradually” inflation would reach the 2% target and 1.2 million jobs would have been created, Carney said. “In other words, we would achieve our mandate.”

The U.K. currency gained as much as 0.3% to $1.6157 before trading little changed at $1.6094. It fell earlier to $1.6065, the lowest since November, after a poll of Scottish voters provided fresh evidence of a swing away from the U.K. and suggested the result of next week’s referendum on independence is on a knife edge.

The yuan strengthened as the People’s Bank of China boosted the currency’s daily reference rate by 0.3% to 6.1520 per dollar, the biggest increase since November 2010 and the strongest level in four weeks.

China’s trade surplus climbed to an all-time high in August, the Beijing-based customs administration said yesterday. Exports exceeded imports by $49.84 billion, beating the previous record of $47.30 billion set in July.

The yuan gained 0.1% from Sept. 5 to 6.1370 per dollar after appreciating to 6.1317, the strongest since March. China’s financial markets were shut yesterday for a holiday.

Copyright 2014 Bloomberg. All rights reserved. This material may not be published, broadcast, rewritten, or redistributed.

See the original article >>

Restructuring Debt Restructuring

by Barry Eichengreen

BERKELEY – Sometimes the worst intentions yield the best results. So it is, unexpectedly, with Argentine debt.

The story begins with Argentina’s financial crisis in 2001-2002. There is no question that the crisis left the country unable to service its debts. But Argentina made no friends by waiting four years to negotiate with its creditors and then offering settlement terms that were stingy by the standards of previous debt restructurings.

Still, the terms were acceptable to the vast majority of the country’s creditors, who exchanged their old claims for new ones worth 30 cents on the dollar. All, that is, except for a few holdouts who bought up the remaining bonds on the cheap and went to court, specifically to the US District Court of the Southern District of New York, asking to be paid in full.

This quixotic strategy met with unexpected success when Federal Judge Thomas Griesa ruled in the holdouts’ favor. Griesa idiosyncratically reinterpreted the pari passu, or equal treatment, clause in the debt contracts to mean that “vulture” funds refusing to participate in the earlier debt exchange should receive not 30 but 100 cents on the dollar.

Griesa’s ruling threatened to hold the Bank of New York Mellon, the Argentine government’s agent, in contempt if it paid other bondholders without also paying the vultures. Effectively barred from servicing its debt on the renegotiated terms, Argentina had little choice but to default again.

This was not an episode from which anyone emerged smelling like a rose. Argentina’s hardball tactics and erratic policies did not endear it to investors. The vultures showed no scruples in profiting at the expense of Argentine taxpayers. They are now deploying the same strategy against the Democratic Republic of the Congo, one of the world’s poorest countries.

Griesa, for his part, showed no compunction about upending a financial order in which market-based exchanges of old bonds for new ones are used to restructure the debts of countries unable to pay. By making it impossible for sovereigns to restructure, he effectively rendered them unable to borrow in the United States. Ignoring previous precedent and all economic common sense, he threw international financial markets into turmoil.

This prompted various suggestions for reforming sovereign-debt markets. Resuscitating ideas advanced in the wake of Argentina’s earlier default, some experts proposed creating an international bankruptcy court in the IMF. Others suggested that Argentina might issue bonds under European – or even domestic – law.

But experience has shown that bondholders are not inclined to subordinate their claims to some untested international bankruptcy court. The only thing they would like less are obligations whose terms were enforced by courts as easy to manipulate as Argentina’s. As for borrowing in European currencies, Griesa was quick to declare that his rulings would cover such bonds as well.

Fortunately, there is a simple solution to these problems. Investors could agree to insert language into bond contracts that leaves no room for vulture funds.

First, they could clarify the pari passu clause, specifying that it guaranteed comparable treatment for existing bondholders, not for existing bondholders and earlier bondholders whose claims were already extinguished.

Second, issuers could add “aggregation clauses” specifying that an agreement supported by a qualified majority of a country’s bondholders, say, two-thirds, would bind one and all. There was already movement after Argentina’s earlier default to add “collective-action clauses” that allowed the holders of an individual bond issue to take a binding vote to accept a restructuring offer.

But this still allowed the vultures to block the process by buying up a third of a particular bond issue. By contrast, purchasing a third of a country’s entire debt stock, as required for a blocking position when all bondholders vote together, is an altogether more costly proposition.

In 2003, in an article in the American Economic Review, Ashoka Mody and I made the case for these provisions. They are basically what the International Capital Market Association of leading investors and issuers has now agreed to implement, subject to some additional details that need not be examined here.

Why didn’t it happen sooner? The answer is that getting investors to agree is like herding cats. In this case, it required strong behind-the-scenes leadership from the US Treasury.

The agreement is not perfect, and problems remain. Because new contractual provisions are not easily retrofitted into old bonds, it will take years before the clauses are included in the entire stock of debt. Establishing an international bankruptcy court would be a far more efficient solution, but that doesn’t make it feasible. Investors were wise to acknowledge that, in international capital markets, the perfect is the enemy of the good.

See the original article >>

Central bank shock potential: Watch out

by Katrina Bishop

As the 2008 economic crisis took hold, central banks around the world scrambled to prop up their economies. The result: monetary easing on a global scale.

However there's been fierce debate over whether these stimulus efforts – such as the U.S. Federal Reserve's massive bond-buying program – could have done more harm than good.

David Tice, president of Tice Capital and founder of the Prudent Bear Fund, warned last month that a jolt to international confidence in central banks would lead to a 30 to 60 percent market decline.

We take a look at three of the world's key central banks, and the global risks they pose.

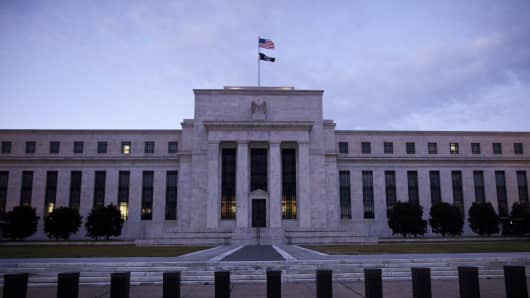
U.S. Federal Reserve

Brendan Smialowski | Bloomberg | Getty Images

U.S. Federal Reserve

The Fed cut interest rates and launched three bond-buying – or quantitative easing (QE) - programs between late 2008 and 2012 in an effort to stimulate the U.S. economy. The move has proved controversial, with some economists arguing that QE was nothing more than a temporary fix.

Now, the Fed is looking to end its QE program with a $15 billion reduction in monthly purchases in October – which, according to some experts – poses risks of its own.

Read MoreKey political risks to watch after the summer

James Rickards, economist and author of New York Times best seller "The Death of Money", highlighted that when the Fed tapered off its previous QE programs, the stock market and the economy stalled.

"It's happening again, but in slow motion because the QE3 taper was gradual and from a higher level," he told CNBC. "When this third taper is done in November, the weakness will become apparent."

Bank of England

Much like in the U.S., economists in the U.K. are also falling over themselves to predict when the first interest rate hike from its five-year low of 0.5 percent will come. For the first time in three years, Bank of England (BoE) policymakers were split at its August meeting, with Monetary Policy Committee (MPC) members Martin Weale and Ian McCafferty voting for a rise in interest rates.

"The possibility of an increase in the Bank rate is now 'in play'," Investec's Philip Shaw said in a note. "From here on, we might begin to see markets becoming a little jittery over a possible move ahead of each meeting."

Central bank head Mark Carney's reputation was called into question after he unveiled Fed-style forward guidance in August 2013, and said rates would not rise until the U.K. unemployment rate hit 7 percent. This, however, happened much quicker than happened; by April 2014, and Carney was forced to revise his guidance.

For Steen Jakobsen, chief investment officer at Saxo Bank, the BoE's credibility – or lack of it – also poses a risk.

Read MoreMarket movers—what's keeping traders up at night

"Economies are sophisticated," Steen said. "The BoE now needs to provide the market with a more sophisticated response – and there's a risk they won't be successful in this."

Poor communication is very dangerous for central banks, which rely on carefully-crafted statements to guide market expectations. If faith in a central bank's communication is lost, investor confidence could be hit, leading to volatility in stock and currency markets, and uncertainty the broader economy.

&ltp&gtLook at FX in world of central bank divergence: Pro</p> &ltp&gtNick Carn, founder of Carn Macro Advisors, says currencies could be a good trade in a world where central banks will begin to diverge in their policy.</p>

European Central Bank

In the euro zone, however, it's a very different story.

At its September meeting, the ECB unveiled yet more stimulus measures designed to bolster the region, where an economic recovery has struggled to take hold. Growth-sapping low price growth has dogged the euro zone, with inflation falling to just 0.3 percent in August and unemployment remaining stubbornly high at 11.5 percent.

The central bank cut its three main interest rates further, and announced it was going to start buying asset-backed securities in an effort to boost the availability of credit. The next step, according to some analysts, is the launch of a full-blown QE program, like that of the Fed's.

Nick Beecroft. chairman and senior market analyst at Saxo Capital Markets UK, told CNBC this will be launched by the end of the year, but added: "the ECB, and specifically the (German) Bundesbank, will have to be dragged kicking and screaming to this".

Andrew Kenningham, senior global economist at Capital Economics,added: "The risk is that they don't do actually do it... There's an element of bluff on the part of Mario Draghi. He can promise to do things, achieve quite a lot just by promising, and then don't have to do it."

Read MoreWhy the Fed should always be in focus: O'Neill

Even if Draghi does launch Fed-style QE, Kenningham questioned how successful it would even be. "It's worth trying, but we're not at all clear it would have a massive effect," he said.

If the ECB doesn't act in the way most expect, markets could be hit hard, as most investors have priced in further stimulus from Draghi. It could also hit the bank's credibility, limiting the power of any future policy announcements.

Be careful what you wish for

One further potential pressure point is a growing divergence between the major advanced economies, with speculation of Fed and BoE tightening as the ECB (and Bank of Japan) inch towards further stimulus.

Currency traders in particular should be watching the situation, Steen warned. The dollar has strengthened significantly against the euro in anticipation of Fed tightening and ECB easing.

But forex markets should be wary on counting on central bank to make the right move.

"I'm perplexed that the market continues to listen to and believe central banks," Steen added. "In the recent past, they have been very wrong."

See the original article >>

A forecast of when we'll run out of each metal


Here is one interpretation of when we’ll run out of each metal or energy source. While the technicalities of some of this information can be debated, I think the general theme runs the same. There is a limited supply of these commodities – and if there are no discoveries, no price changes, and no changes in consumption, we are running out relatively soon. In my opinion, there are two caveats that are always worth considering when looking at something like this.

1. “Reserves” are an engineering number that are based on economic viability. Technically speaking, there are small concentrations of gold everywhere. It is just not usually viable to mine 0.1 g/t gold. When we will “run out” of each mineral in this chart is based on current reserves and prices. If the gold price doubles, then suddenly it is economic to mine more.

2. This chart is a reminder that something has to give. Either prices are going to have to go up, or new amazing discoveries have to be made to keep prices down. It’s basic economics, and either way it seems that there are many opportunities in the mining industry for investors and speculators on both fronts.

A Forecast Of When We'll Run Out of Each Metal

See the original article >>

Crude Oil – North or South?

by Przemyslaw Radomski

Trading position (short-term; our opinion): In our opinion no positions are justified from the risk/reward perspective.

On Friday, crude oil lost 1.22% as disappointing jobs report and ceasefire agreement between Ukraine and pro-Russian separatists weighed on the price. As a result, light crude extended losses and approached the recent lows. Will we see a test of the strength of the Jan low in the coming days?

On Friday, the Department of Labor reported that the U.S. economy added 142,000 jobs in August, missing expectations for a 225,000 increase. Additionally, the report showed that the U.S. unemployment rate ticked down to 6.1% last month, from 6.2%, but in line with expectations. These disappointing numbers pointed to a potential weakening of the economy, fueling fears that the world’s largest oil consumer may demand less energy and fuel.

On top of that, Ukraine signed a ceasefire deal with pro-Russia rebels, which was also bearish for the commodity (as a reminder, Russia is the world’s second-largest exporter and such agreemnt eased fears over the instability in the eastern Ukraine and disruption of Russian oil exports). In this environment, crude oil hit an intraday low of $92.86, approaching the recent lows. Will we see further deterioration in the coming days? (charts courtesy of http://stockcharts.com).

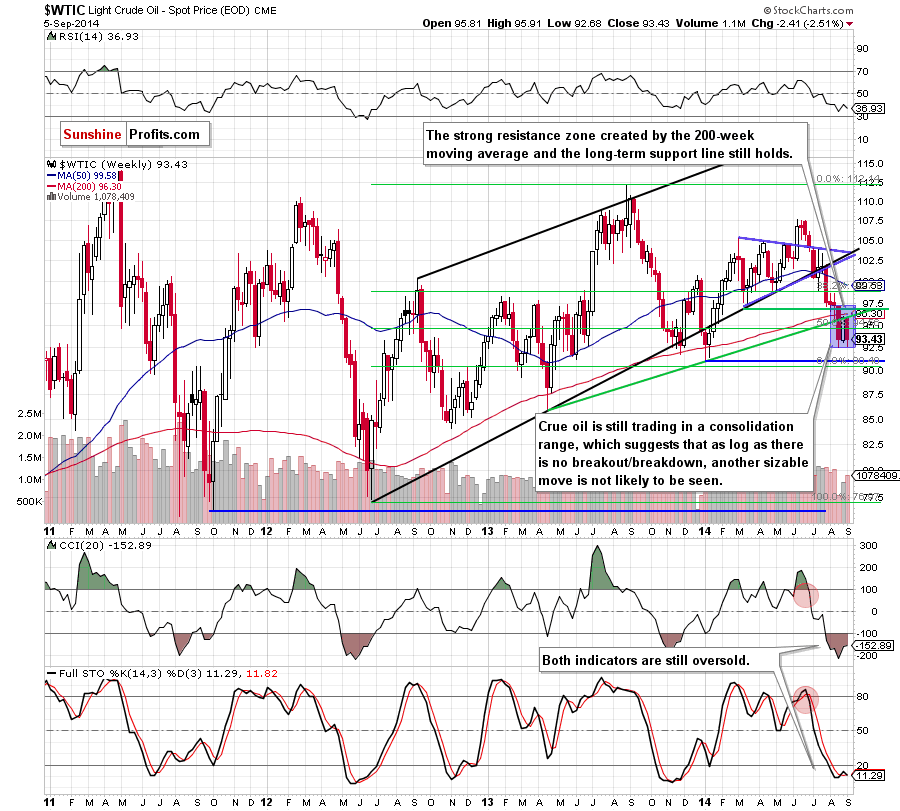
WTI Crude Oil weekly chart

From this perspective, we see that although crude oil moved lower in the previous week, losing 2.51%, the situation in the medium-term hasn’t changed much as crude oil is still trading in a consolidation (marked with blue) between the recent lows and the strong resistance zone created by the previously-broken 200-week moving average and the rising, long-term support line. Therefore, our last commentary is up-to-date:

(…) we still think that as long as there is no invalidation of the breakdown below these levels, the medium-term outlook remains bearish (..) if crude oil drops below the recent lows, the last week’s upswing will be nothing more than a verification of the breakdown and we’ll see a test of the strength of the Jan low of $91.24.

Can we infer something more from the very short-term chart? Let’s check.

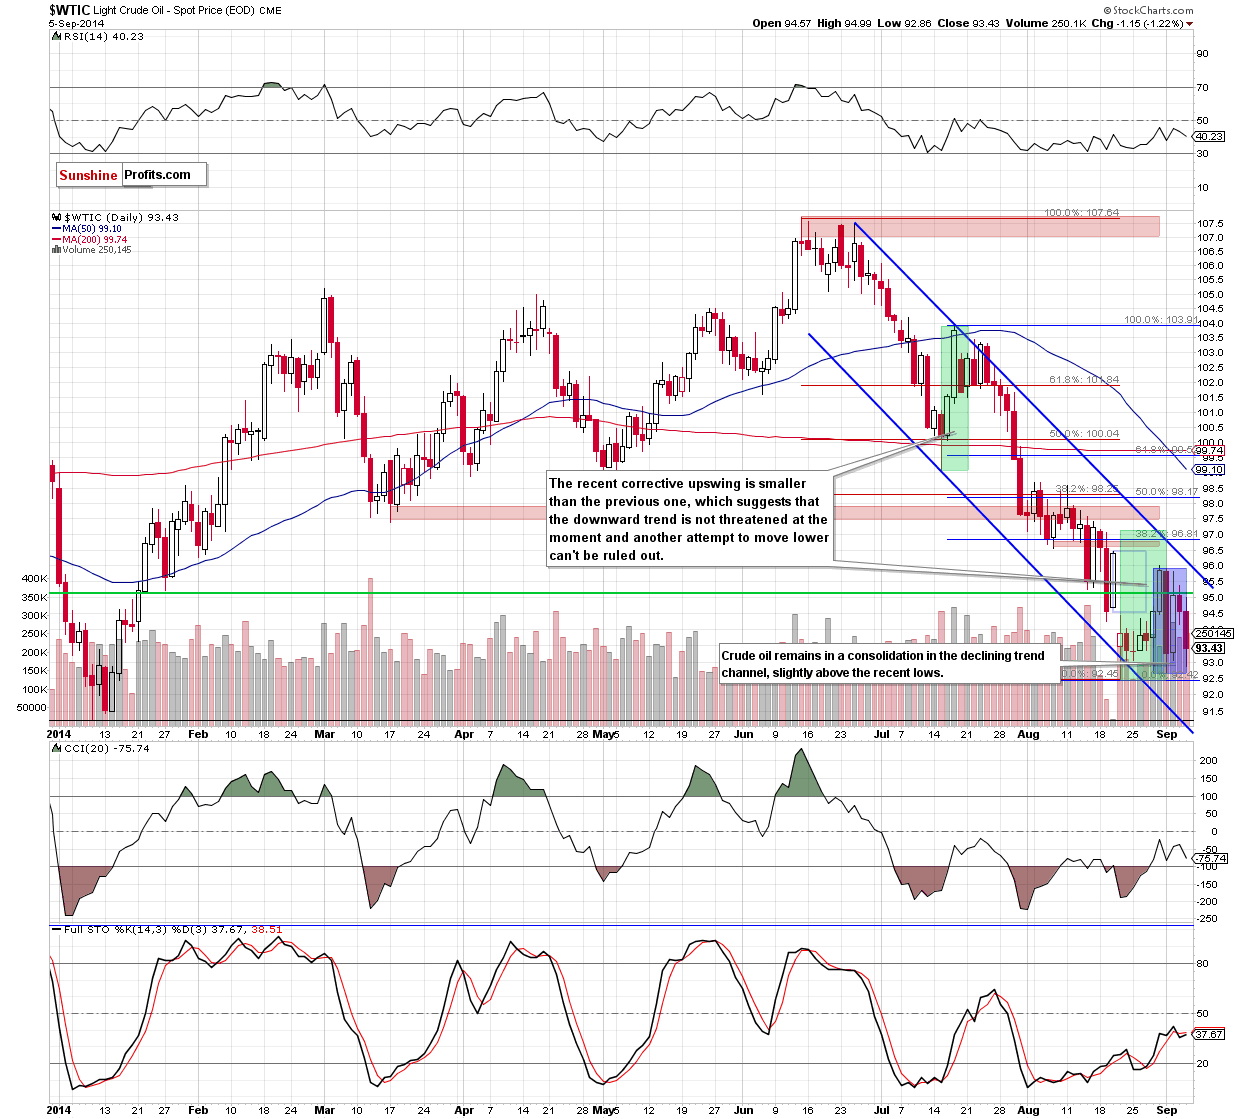
WTI Crude Oil daily chart

In our Friday's summary, we wrote the following:

(…) the major driving force behind today’s move might be the U.S. employment report. If it is bullish, the U.S. dollar will strengthen, which may push the commodity lower. On the other hand, if it’s bearish, it will likely fuel worries over the strength of the recovery in the labor market, which may also translate into lower price of crude oil. Taking all the above into account, it seems that the move to the downside is more likely at the moment.

As you see on the above chart, the situation developed in line with the above-mentioned scenario and crude oil declined, erasing the gains that had made on Wednesday and approaching the recent lows. Despite this drop, the overall situation in the very short-term hasn’t changed much as light crude is trading in a consolidation (marked with blue) between Tuesday’ s high of $95.91 and low of 92.68. Therefore, our last commentary is still up-to-date:

(…) we think that as long as there is no breakout above the upper line of the formation (or a breakdown below the lower border) another bigger move is not likely to be seen. (…) What could happen if currency bears show their claws once again? Without a doubt, the initial downside target will be the lower line of the formation. If it’s broken, the commodity will test the strength of the lower border of the declining trend channel, which intersects the Jan low of $91.24 at the moment.

Please keep in mind that the recent corrective upswing is much smaller than the previous one, which means that oil bulls are even weaker than they were in July. Therefore, in our opinion, the downward trend is not threatened at the moment and another attempt to move lower should not surprise us.

Summing up, crude oil extended losses, which approached the commodity to the lower border of the consolidation, increasing the risk of a breakdown. Taking this fact into account, we are convinced that opening long positions is currently not justified from the risk/reward perspective. At this point, it’s worth noting that we do not recommend opening short positions either as the space for further declines might be limited (especially when we factor in the fact that slightly below the Jan low is also the 61.8% Fibonacci retracement level based on the Jun 2012-Aug 2013 rally, which stopped the correction at the beginning of the year).

Very short-term outlook: mixed with bearish bias
Short-term outlook: mixed
MT outlook: bearish
LT outlook: bullish

Trading position (short-term): No positions are justified from the risk/reward perspective at the moment, but we will keep you informed should anything change.

See the original article >>

Indexes Search For New Direction Following August Rally

by Paul Rejczak

Briefly: In our opinion, speculative short positions are favored (with stop-loss at 2,030 and a profit target at 1,900, S&P 500 index)

Our intraday outlook is bearish, and our short-term outlook is bearish:

Intraday (next 24 hours) outlook: bearish
Short-term (next 1-2 weeks) outlook: bearish
Medium-term (next 1-3 months) outlook: neutral
Long-term outlook (next year): bullish

The main U.S. stock market indexes gained between 0.4% and 0.6% extending their recent consolidation, as investors reacted positively to worse-than-expected monthly jobs data release. The S&P 500 index remains relatively close to its all-time high of 2,011.17. The resistance level is at around 2,000-2,010. On the other hand, the nearest level of support is at 1,985-1,990, marked by recent local lows. There have been no confirmed negative signals. However, we can see negative technical divergences, accompanied by overbought conditions:

Daily S&P 500 index chart - SPX, Large Cap Index

Expectations before the opening of today’s session are slightly negative, with index futures currently down 0.1-0.2%. The European stock market indexes have been mixed between -0.8% and 0.0% so far. The S&P 500 futures contract (CFD) Continues to fluctuate along the level of 2,000. The nearest important level of resistance remains at around 2,005-2,010, and the support level is at 1,990, among others:

S&P500 futures contract - S&P 500 index chart - SPX

The technology Nasdaq 100 futures contract (CFD) follows a similar path, as it trades slightly below the level of 4,100. The resistance level is at 4,100-4,115, and the nearest important level of support remains at 4,050-4,060, marked by recent local lows, as we can see on the 15-minute chart:

Nasdaq100 futures contract - Nasdaq 100 index chart - NDX

Concluding, the broad stock market remains relatively close to all-time high as the S&P 500 index continues to fluctuate along the level of 2,000. We remain bearish, expecting a downward correction or uptrend reversal. Therefore, we continue to maintain our speculative short position. The stop-loss is at the level of 2,030 and potential profit target is at 1,900 (S&P 500 index). It is always important to set some exit price level in case some events cause the price to move in the unlikely direction. Having safety measures in place helps limit potential losses while letting the gains grow.

See the original article >>

Gold and Silver Potential Price Meltdown Scenario

By: Rambus_Chartology

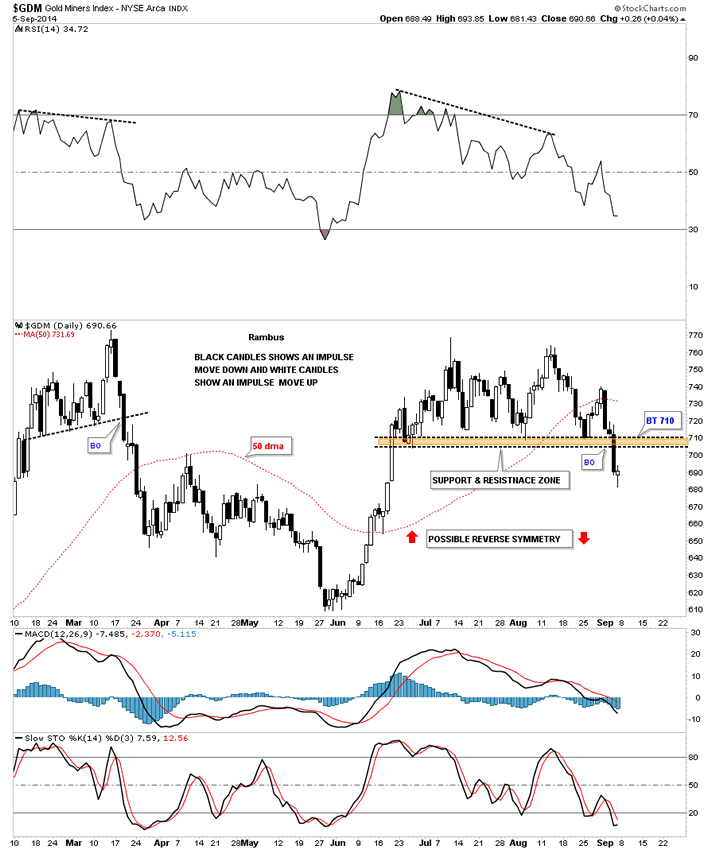
I believe last week marked an important turning point for the precious metals stocks. After two months of chopping in a tight trading range GDM, which I'm going to us as a proxy for the big cap precious metals stocks, finally broke below the critical brown shaded support and resistance zone. This was a big deal for me as now all those bottoms that had been holding support should now offer important resistance on any backtest.

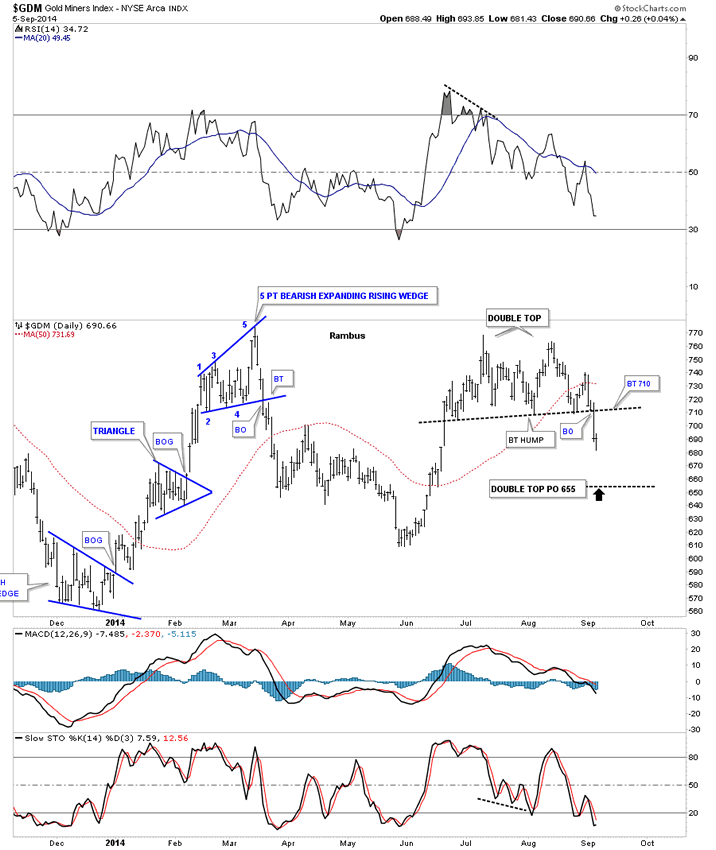
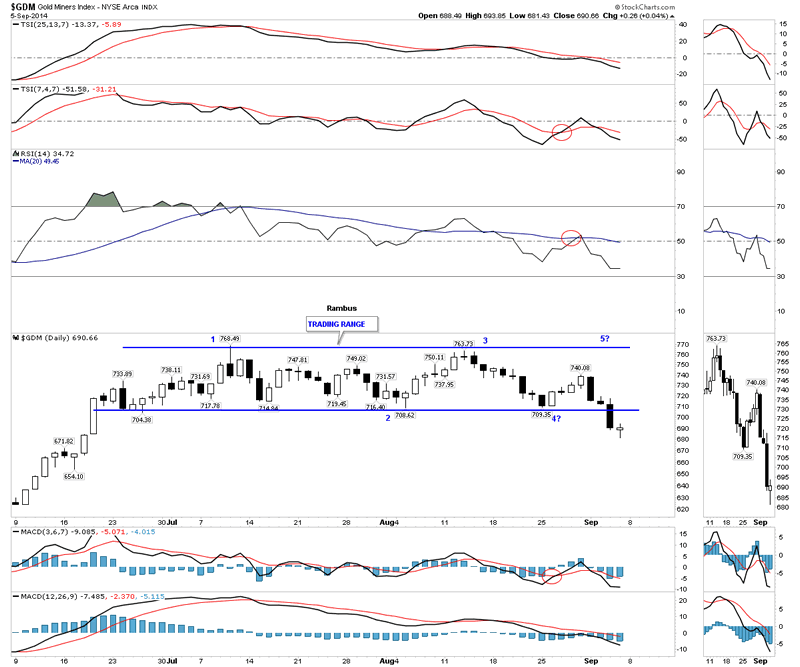
This first chart for GDM shows the two month trading range that one could call either a double top or if you use your imagination you can see a double headed H&S top with a small left and right shoulder. It really doesn't matter what you call the trading range above the brown shaded support and resistance zone, it's the S&R zone that matters the most. That S&R zone is now our line in the sand, above is bullish and below is bearish. If GDM is indeed starting a new impulse move lower we should start to see a bunch of black candles forming one below the next. Note all the white candles that formed during the rally off of the June low which told us the move was strong. One last point on the chart below. I've labeled the price action below the brown shades support and resistance zone as having a possible reverse symmetry move down which would look similar to the June rally only in reverse. The main thing to keep an eye right now is to see if we get a backtest to the previous support zone at 710 that should now reverse its role and act as resistance.


This daily bar chart for GDM shows the double top price objective which would come in around the 655 area at a minimum.


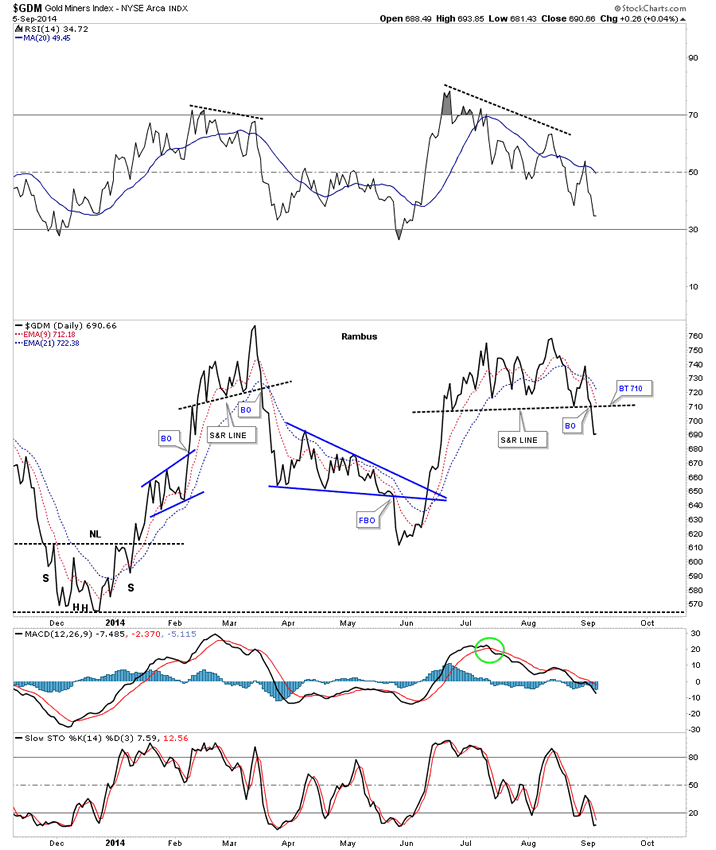
As you know I always like to look at a line chart as it can take out a lot of noise that a bar chart can make sometimes. This line chart shows the breakout and a possible backtest to the 710 area to confirm the top is in place.


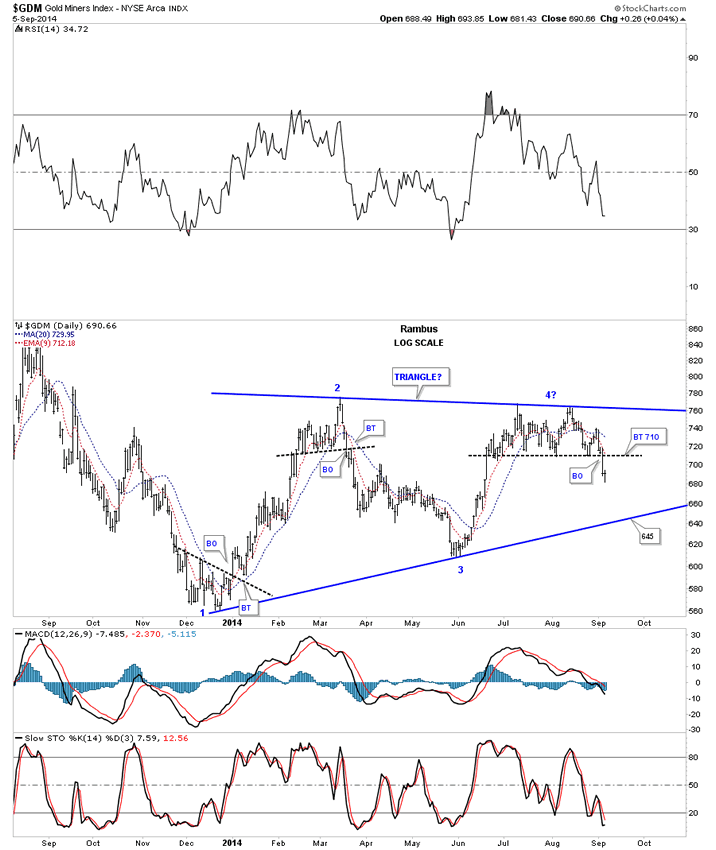
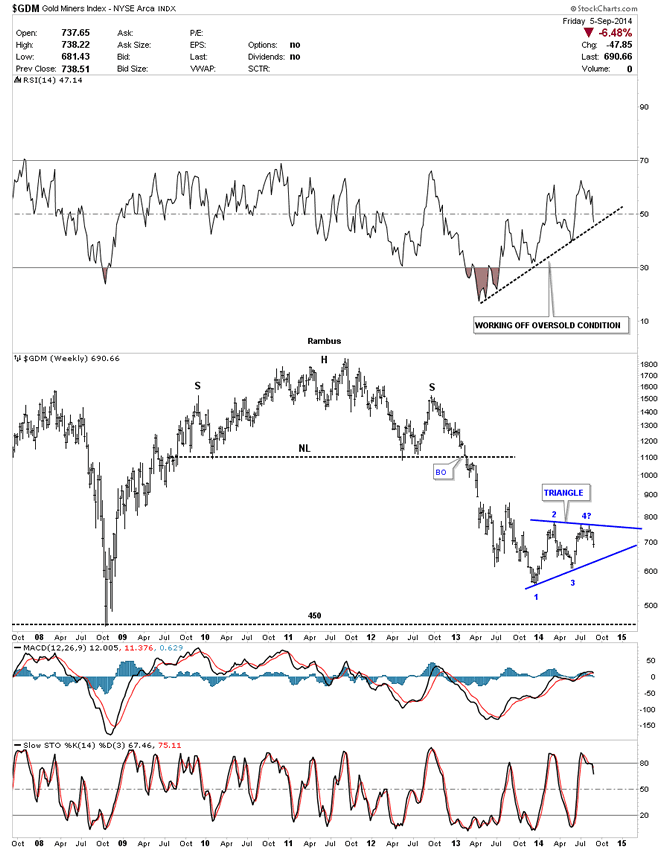
Next I would like to start painting the bigger picture if our current top is indeed the top we've been looking for. Last December GDM finally found support at the 560 area which led to a rally that took the price up to the March high. This created the first reversal point in a possible consolidation pattern or topping pattern. GDM then reserved direction and headed back down to the June low at reversal point #3 which was a higher low than reversal point #1.This completed the second reversal point. At that point reversal point #3 began which took GDM up to our current top completing the third reversal point that is making a lower high than reversal point #1 which is giving us a triangle looking pattern. The fourth reversal point won't be complete until the price action hits the bottom trendline at 645 or so. It may sound confusing but when you look at the chart below is becomes very obvious. So the next important area to watch, if indeed the top is in place, will be the bottom rail of the possible blue triangle at 645.


The GDM Four Horsemen.


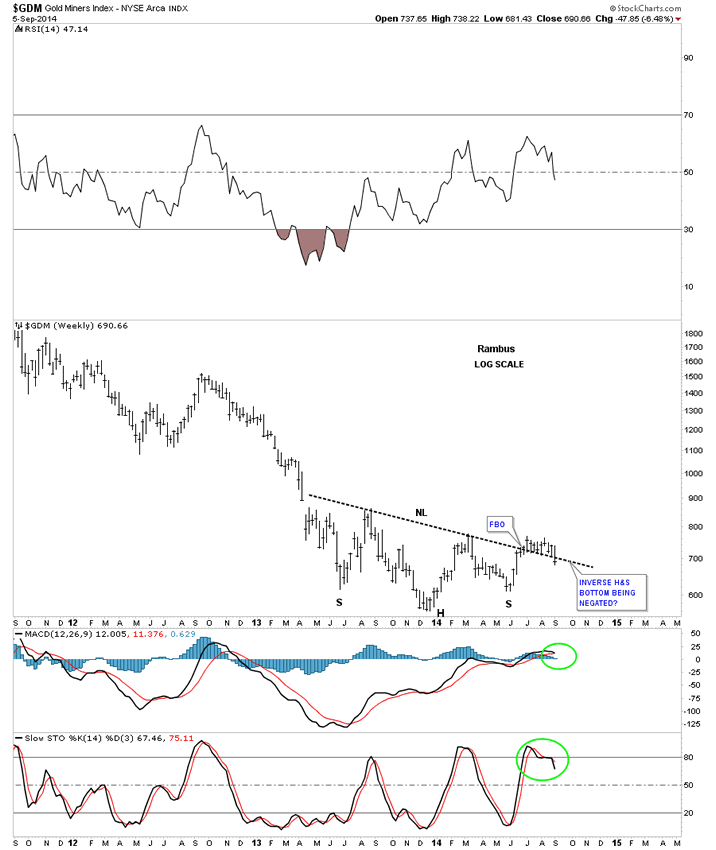
Another reason last weeks price action was so important is because GDM has broken down below the neckline of that potential inverse H&S bottom that has kept us in limbo for the last two months. It's looking more likely that the inverse H&S bottom maybe negated if we see more weakness coming into the big picture over the next week or two. If GDM was embarking on a new bull run it should be showing more strength instead of weakness in here which it's not.


On this next weekly chart for GDM I'm showing the potential blue triangle that we looked at earlier in this post. If you look at the RSI indicator at the top of the chart you can see how the 14 month chopping range has relieved the very oversold condition when GDM first started the correction. It now has plenty of room to run to the downside if it breaks below the black dashed rising trendline.


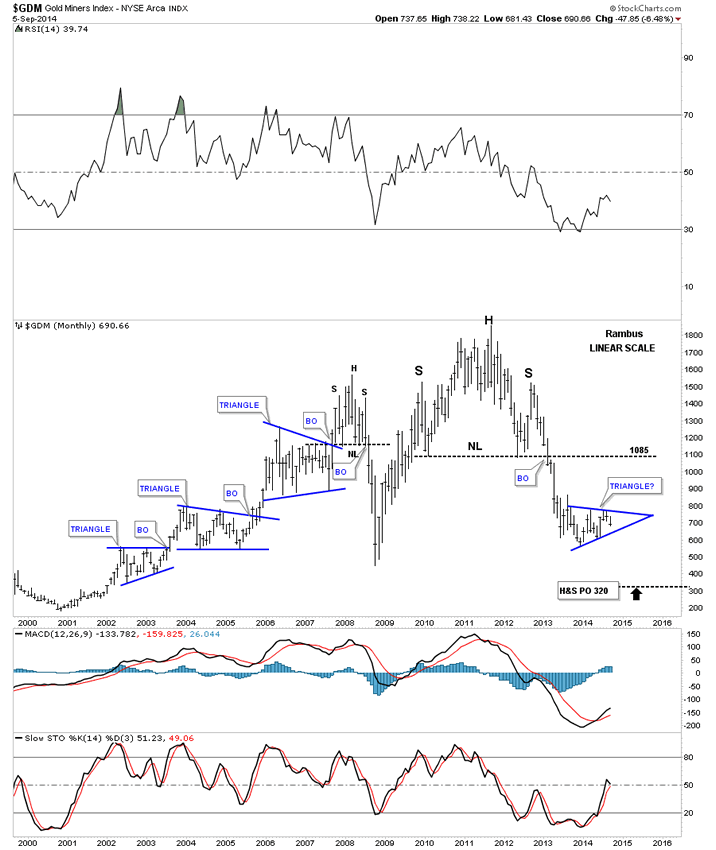
This last chart for GDM is a monthly look that shows the massive H&S top and the decline that ensued. This linear scale chart has a price objective down to the 320 area. Note the three blue triangles that formed during the bull market years and compare our current triangle that is similar in nature that has been forming during the bear market. In an uptrend a consolidation pattern will usually breakout to the upside and in a bear market the consolidation pattern will break out to the downside. The odds favor our current and possible triangle will breakout to the downside.


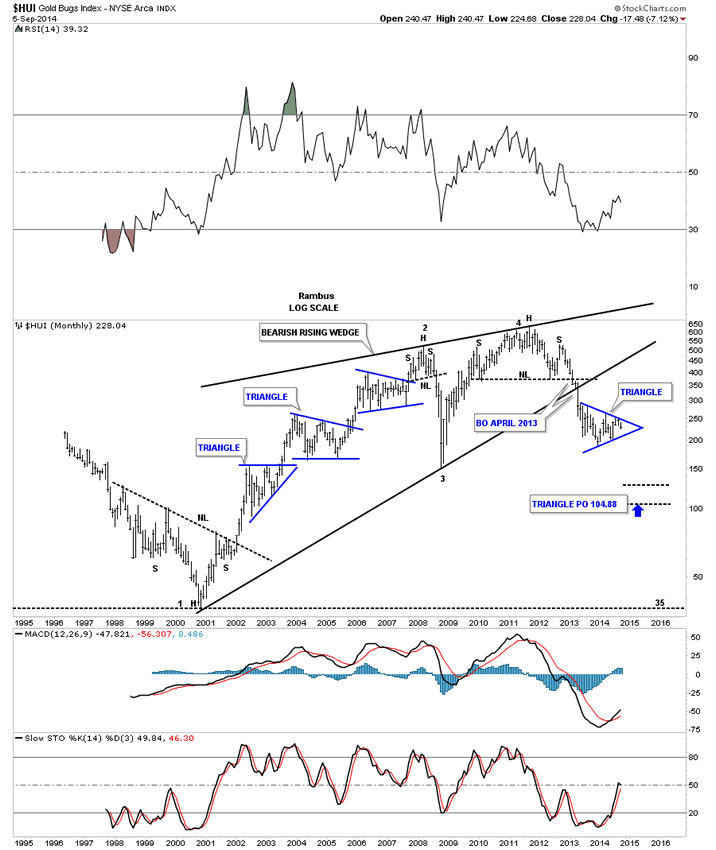
I would like to throw in this long term chart for the HUI that puts our potential blue triangle in perspective. Note that during the bull market years the HUI constantly made higher high and higher lows. Now compare that uptrend to our current downtrend that has made a series of lower highs and lower lows since the bull market peak in 2011.


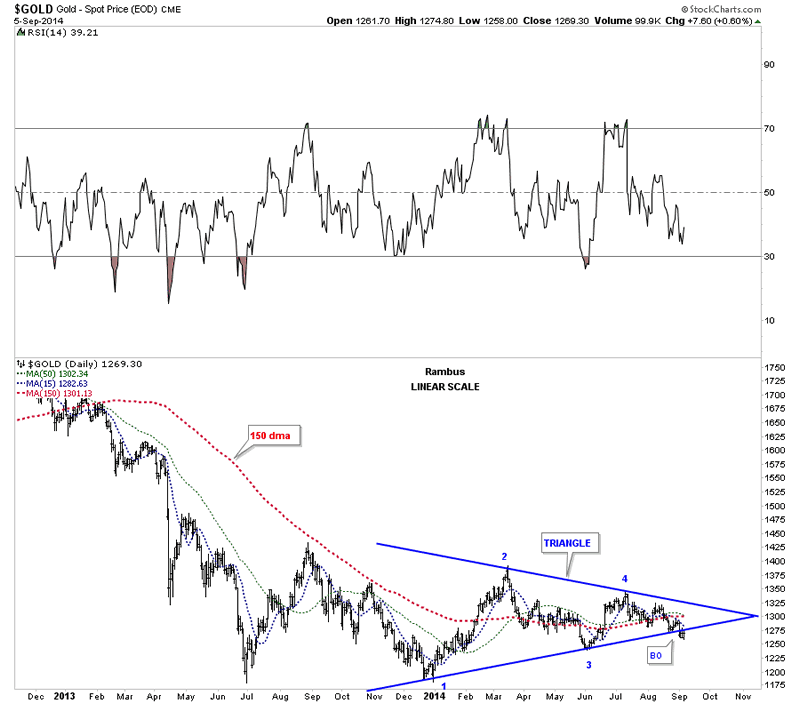
Lets now look at a few gold charts and see what's happening there. This first chart shows the blue triangle that started to form the same time GDM started to form its triangle. The big difference is gold has broken below its bottom rail while GDM is still trading in the middle of its potential triangle. Gold is trading below all the moving averages on this chart with the 150 ma being the most critical.


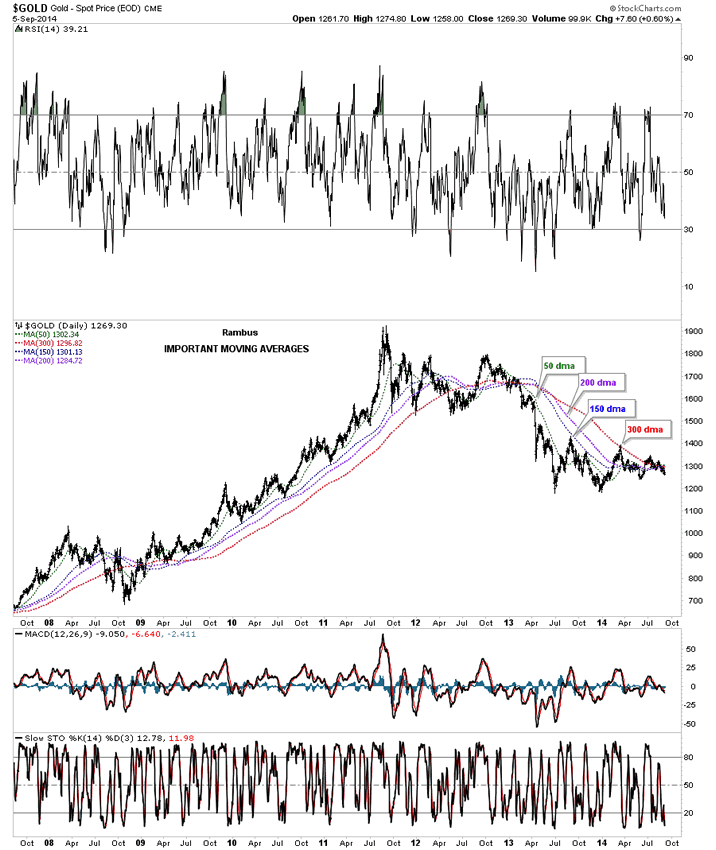
Below is a long term daily chart for gold that shows all the most important moving averages. As you can see the price of gold is trading below all the moving averages at this time. These moving averages actually work best when there is a strong move either up or down as show by how they aline themselves. When they are all bunched up together it tells you there is a top, bottom or consolidation pattern forming.


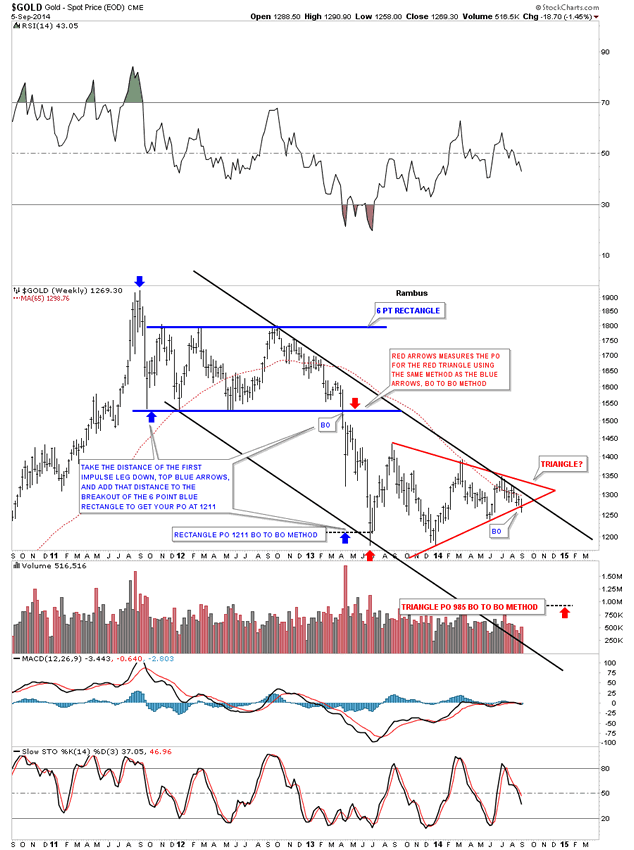
This next chart for gold is a weekly look that shows the 65 week moving average acting as resistance since early 2013. This weekly chart also shows you the downtrend channel that has the blue rectangle and the red triangle forming between the top and bottom rails. I've added instructions on how I measured for the price objective of the 6 point blue rectangle. If the red triangle plays out to the downside I used the same measuring technique that would give us a price objective down to the 985 area. Note the last bar on the far right hand side of the chart. Is this the beginning of the next impulse move lower or will we get a fake out breakout? I don't think we'll have to wait very long for an answer one way or the other.


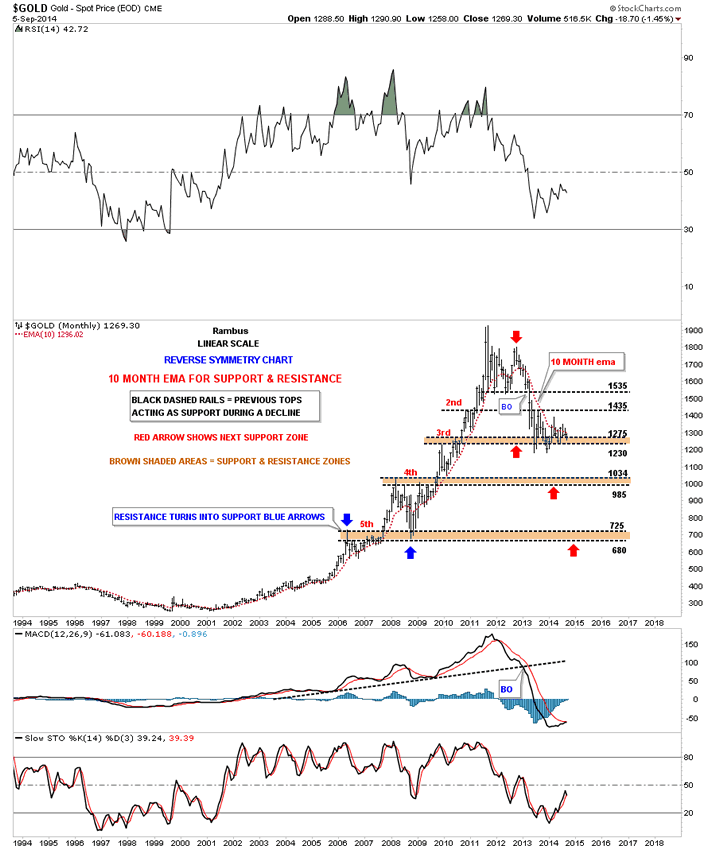
Lets look at one more long term chart for gold the monthly bar chart. This chart shows the 10 month ema that did an outstanding job during the bull market years for holding support. Even during this bear market it has done a good job of holding resistance. This chart also shows you where I would expect support to come into play if things breakdown for gold, the brown shaded S&R zones. As you can see the 985 to1034 would be the next critical support area for gold.


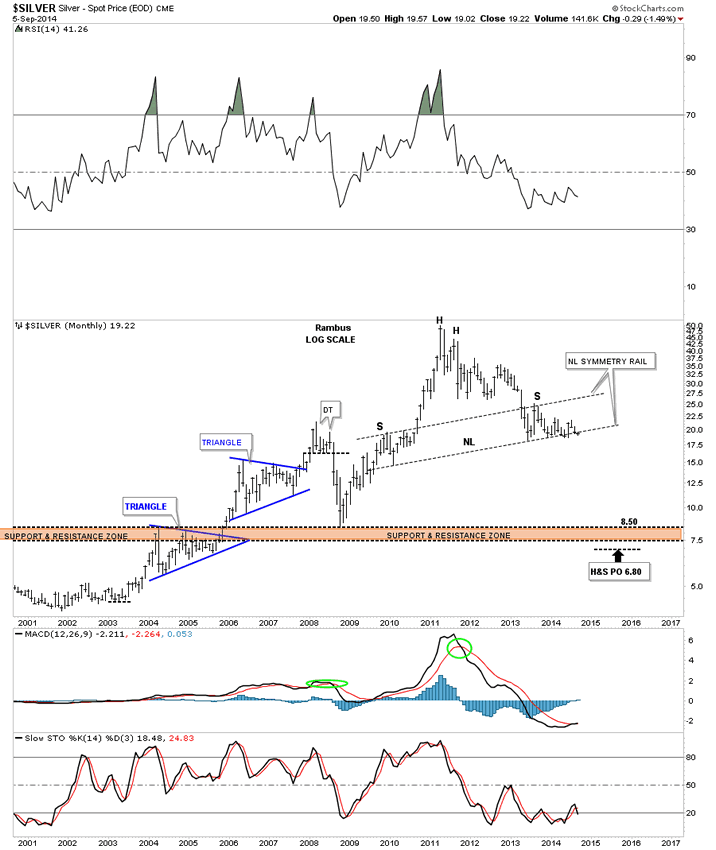
Lets take a look at the long term silver chart that we've been following for close to a year now. The price action hit that potential neckline in June of 2013 and has been finding support ever since. As long as neckline holds the potential H&S top is just that a potential H&S top but if the neckline ever gives way it would be a tough ride down if you were bullish on the white metal. One step at a time.


I think last weeks move to new multi week lows on GDM could very well be a warning shot across the bow for the big cap precious metals stocks. The possible backtest to the 710 area is going to be the most important area to keep track of. That's our line in the sand, give or take a few points, that will let us know which direction the big cap PM stocks want to go. The first part of the week maybe very choppy with some wild swings as the bulls and the bears fight it out for dominance of a new trend that should start to emerge anytime now.

See the original article >>

Connecting Apple’s dots…it will be different this time!

by Chris Kimble

appleiphone6introductionsept9

CLICK ON CHART TO ENLARGE

How time flies! Nine years ago Steve Jobs shared one of the most memorable commencement address's of all time at Stanford University (here speech) In that speech, Steve discussed connecting life's dots, by looking backwards.

As most of us are well aware, Apple will introduce the iphone 6 today. Speaking of new products introductions and connecting the dots looking backwards, does it seem odd that Apple's stock is almost the exact same price today as it was when they introduced the iphone 5?

Tim Cook introduced the iphone 5 in 2012, as Apples stock was hitting a 5 & 30-year resistance lines (see post here). It then proceed to lose a third of its value after hitting these resistance lines.

Odds are high the results will be different this time!

See the original article >>

Risk of soybeans freeze debatable

By Ryan Ettner, Jim McCormick

Soybeans (CBOT:ZSX14)

The bean market took off a big chunk of the frost premium that was added to the market Friday. There is still a risk of a frost freeze hitting the North West farm belt at the end of the week but the intensity of the cold is being debated. With the weakness seen today it seems that the majority of the markets participants believe that there will not be much damage being done. Some of the models are calling for temps below the freeze mark while others are keeping above the critical freezing levels.

Early Sunday night the market firmed on the GFS model calling for a great chance of a freeze. Weakness then set in at 2:00 A.M. Chicago time (this is when European markets open) as the Euro model did not suggest temps will drop to below freezing. The divergence of the models will keep the markets trade action choppy until all models agree or the weather event has played itself out. Also keep in mind that it isn’t just how cold it gets but how long the temps stay below freezing which will have an impact on how much damage is done to the crop.

The other event dominating the trade attention is Thursdays WASDE report. The Reuters newswire poll of analysts found the average analyst estimate for bean yields is expected to increase from 45.4 to 46.3. Production is seen increasing from 3.816 billion to 3.883. For new crop soybeans Allendale’s 25th annual Nationwide Producer Survey suggested yields of 46.4 vs. the 45.4 USDA August estimate. We expect new crop ending stocks to increase from 430 million up to 459. As for old crop beans its marketing year officially ended on August 30. We believe that the USDA won’t show the true ending stock changes on Thursday though.

In tight crop years they usually wait for the release of the quarterly Grain Stocks report (released September 30th) to see what the survey says. On that same report they usually go back and revise the previous year’s production. Allendale estimates actual old crop exports and crush ran 20 million and 10 million higher than USDA’s August estimate. We look for the coming old crop production increase, shown on the Sep 30 Grain Stocks, to offset this demand revision.

Tonight’s crop ratings remained unchanged at 72% good to excellent. This is way above the five year average of 53% for this week. Allendale continues to look for beans to fall to the $9.50 area when the fall low is scored and would recommend not chasing rallies. Producers should continue to sell into a price rallies if it were to occur.

Corn (CBOT:CZ14)

Overnight European traders were quick to sell as soon as their markets opened and the day session traders seemed happy to keep prices where the overnight closed. There is still some light concern over the cold temperatures as corn did bounce when the noon maps were still showing low temps. By the end of the day it was obvious that while there is concern about the cold, there is more concern over just how much the USDA could raise yields on Thursday. For the most part, it is likely that the cold weather will keep corn stuck close to where it is. Yield thoughts will keep pressure but cold fears could hold contract lows, at least until Thursday.

Bulls:

  • No change to the forecast maps with Wednesday still seeing temps 14 to 16 degrees below normal
  • Cold temps suggest that some ND low temps could reach right to freezing on this forecast
  • Buyers are best to defend contract lows but should not chase this market higher on weather with an upcoming USDA report on Thursday

Bears:

  • Analysts are expecting a yield increase of 3.3 bushel on Thursday up to 170.7
  • With more concern in this market based on yield, bears can keep selling weather bounces at least until Thursday
  • Last time the move to 343 3/4 saw good size buying at that level, before thinking corn will take that out there has to be more news than just a slow grind lower


Wheat (CBOT:WZ14)

Wheat finished lower today on lack of new news. No escalation between Ukraine and Russia which is keeping the markets subdued. This mixed with decent planting weather in the forecast for winter wheat over the next few weeks and temperatures that aren’t threatening would suggest we should keep this market fairly subdued. Thursday we have a USDA WASDE report and we are not expecting to see a lot of excitement on this as the end of the month has a small grains summary which will give us an idea about wheat and a hand full of additional markets. Export estimates were below trade estimates this week which is disappointing even after the drop in domestic prices the United States has had a difficult time gaining much in the export market. Over the last four weeks we have been behind the USDA’s pace for exports but due to better than expected early season booking we are still at 45% of USDA’s export goal and our 5 year average at this time is 42%. We would expect to find the USDA adjusting U.S. demand down in the coming months based on a major slowdown in demand for U.S. wheat. World buyers could be waiting to see how Australia and Argentina’s crops begin to take shape before rushing to find any wheat from the U.S. market. We are still going to expect sideways to lower range moving forward.

Export inspections totaling 530,773 within the range 550-675,000 tonnes.

See the original article >>

Big move to come for the EUR/GBP?

By Matt Weller

Much like an elementary student returning to school, European currencies wish they could turn the calendar back to the halcyon days of a few months ago.

Earlier this summer, the uptrends in euro (CME:E6Z14) and sterling (CME:B6Z14) seemed unstoppable, with EUR/USD reaching as high as 1.40 and GBP/USD setting a 5-year high above 1.7100. Unfortunately for euro and sterling bulls though, the two widely-followed currencies have sold off sharply against the U.S. dollar (NYBOT:DXZ14) and other rivals over the last few months.

Aggressive easing measures by the European Central Bank have driven the euro weakness, whereas the pound has been hit by growing concerns that Scotland could declare independence next week. To determine which of these beaten-down currencies is more likely to bounce, traders can analyze the chart of the EUR/GBP cross rate.

As we go to press, the EUR/GBP is testing the top of its 3-month range at .8030. Beyond representing horizontal resistance in late June and mid-August, this level also marks the falling 100-day MA, which the pair has not closed above since all the way back in March. More broadly, the pair remains in a longer-term bearish channel, suggesting that swing traders have been more concerned with the Eurozone’s economic issues than the UK’s Scottish Independence vote.

The daily RSI confirms this view, with the indicator remaining mired in bearish territory (<60) for over a year now. That said it has formed a quadruple bullish divergence at the recent lows, showing that the selling pressure is declining and foreshadowing a possible rally in the coming days.


Source: FOREX.com

Even if Scotland votes for independence on September 18th, prudent technical traders may want to wait for a bullish breakout from the 1-year channel around .8100 and a corresponding breakout in RSI above 60 before growing outright bullish on EUR/GBP. If we do see these developments, bulls may look to target the Fibonacci retracements of this year’s drop at .8137 (50%), .8199 (61.8%), or .8287 (78.6%) next. Meanwhile, a “no” vote (still our favored outcome) could push the pair back down to its 2-year lows at .7880 as traders turn their focus backed to the Eurozone’s entrenched economic concerns. Either way, EUR/GBP should be in for a big move next week.

See the original article >>

Germany offers plan B

By Brian Parkin, Helene Fouquet and Birgit Jennen

Germany and France are poised to take the first step toward a European investment program, as the euro (CME:E6Z14) area’s two biggest economies seek to resolve differences and spur growth without resorting to stimulus spending, government officials said.

The proposals, which enlist the European Investment Bank for loans to companies, aim to pave the way for a €300 billion ($388 billion) investment plan outlined in July, according to three euro-area government officials who asked not to be named because the document is in draft form. Germany and France plan to present the initiative at a meeting of European finance ministers in Milan, Italy on Sept. 12.

Germany’s emerging endorsement marks an attempt to shift the debate away from austerity and acknowledge the European Central Bank’s efforts to prod governments into action to combat low inflation and a weak economic outlook. It’s also intended to deter ECB President Mario Draghi from resorting to purchases of sovereign bonds and asset-backed securities to increase bank lending, a move viewed with anxiety in Germany.

Draghi “threw the kitchen sink” at German Chancellor Angela Merkel, Jacob Funk Kirkegaard, a senior fellow at the Peterson Institute for International Economics in Washington, said in an interview after the ECB’s policy decisions on Sept. 4. “Draghi’s message was plain: my back’s to the wall -- do something to push fiscal stimulus now or watch me buy bonds.”

No Stimulus

With Merkel opposed to fiscal stimulus, German backing for the investment plan requires avoiding pledges of cash and any suggestion that pressure on France and Italy to make their economies more competitive is easing, one official said.

At the same time, the French and German governments aren’t interested in providing state guarantees for Draghi’s asset- purchase program announced last week, according to a draft document obtained by Bloomberg News.

The separate proposal on investment is part of preparations for European Union leaders to discuss growth at a special summit on Oct. 6 and sign off on an investment-boosting plan by the end of the month. Without citing specific projects, the joint paper will refer to an investment gap in Europe in areas such as transportation, broadband and energy, one official said.

The Luxemburg-based EIB would be the favored conduit for investment loans, as outlined in the €300 billion ($388 billion) proposal to “re-industrialize” Europe that designated European Commission President Jean-Claude Juncker presented in July, according to the officials.

Earlier Attempt

Juncker plans to outline the program by February. It would follow a €120 billion growth boost pledged in 2012 that was based on a €10 billion increase in the EIB’s capital and assumptions about how much investment that would unleash.

Germany and France are working on joint proposals to strengthen investment, German Finance Ministry spokeswoman Marianne Kothe said yesterday, declining to comment on details. French government officials didn’t return calls seeking comment.

Pressure on governments is increasing as France’s economy failed to grow in the last two quarters and the government scrapped plans to cut the budget deficit to 4 percent of output this year. Italy is in its third recession since 2008 and Germany’s economy shrank by 0.2% in the second quarter.

Both sides also plan to back national efforts to attract private investors, such as Germany’s bid to harness insurance- industry capital to finance infrastructure projects, the officials said. Cross-border cooperation between national development banks or funds would also be conceivable.

German Model

Merkel’s government touts German development bank KfW Group, the country’s third-biggest lender by assets, as a possible model for other countries. KfW has aided in loans to Greek companies in the wake of the debt crisis, though such an engagement isn’t envisaged in other euro-area countries for now.

KfW development loans “are working well in Greece,” Ralph Brinkhaus, the finance spokesman in parliament for Merkel’s Christian Democratic Union, said in an e-mailed reply to questions. “It makes sense to build up a European development bank model. If supporting companies with tailor-made finance is needed, development banks are the right way.”

Copyright 2014 Bloomberg. All rights reserved. This material may not be published, broadcast, rewritten, or redistributed.

See the original article >>

Follow Us