Saturday, March 22, 2014

Control your risk with simple and winning rules - Free trading alert for 24 March

Super Stocks Trading Report
Latest Free Trading Alerts for 24 March
Open position value at 21 March $ 14,592.67 2014 P/L   +4.33%
Mixed long/short open position
Today no new entry orders
We stopped at breakeven on PG, at Stop Loss on WMT (Daily pos.)
5 Open Positions 
3 Long 
2 Short 
4 with Stop Loss at breakeven
In true signal service, attachments reports are shipped to customers also via email, in the evening after the markets close. Those who wish to receive them during the demo, please send me their email address.

I simulated 25% margining and modified initial  capital to $ 500K


Super Stocks Trading Report For 24 March
We are happy to offer free signal service for Super Stocks until the end of March
Please send me your email address so I can invite you on my server to do the demo. Mail me to take the offer and start the free service until the end of March michele.giardina@quantusnews.com
Material in this post does not constitute investment advice or a recommendation and do not constitute solicitation to public savings. Operate with any financial instrument is safe, even higher if working on derivatives. Be sure to operate only with capital that you can lose. Past performance of the methods described on this blog do not constitute any guarantee for future earnings. The reader should be held responsible for the risks of their investments and for making use of the information contained in the pages of this blog. Trading Weeks should not be considered in any way responsible for any financial losses suffered by the user of the information contained on this blog.

Suing JPMorgan and the COMEX

By: GoldSilverWorlds

Ted Butler writes: I’ve had some recent conversations with attorneys who were considering class-action lawsuits regarding a gold price manipulation stemming from reports about the London Gold Fix. I told them that while there is no doubt that gold and, particularly, silver are manipulated in price, I didn’t see how the manipulation stemmed from the London Fix. I wished them well and hoped that they may prevail (the enemy of my enemy is my friend), because you never know – if the lawyers dig deep enough they might find the real source of the gold and silver manipulation, namely, the COMEX (owned by the CME Group) and JPMorgan.

So I thought it might be constructive to lay out what I thought a successful lawsuit might look like, although I’m speaking as a precious metals analyst and not as a lawyer. I’ll try to put the whole thing into proper perspective, including the premise and scope of the manipulation as well as the parties involved.

The first thing I should mention is how unprecedented it is that I’m writing this in the first place. Here I am, directly and consistently accusing two of the world’s most important financial institutions of market manipulation (making sure I send each all my accusations) and I have received no complaint from either. I don’t think that has ever occurred previously. Now I am taking it one step further; presenting a guide for how and why JPMorgan and the CME should be sued for their manipulation of gold and silver (and copper, too).

Let me explain why I am doing this. I am still certain that the coming physical silver shortage will end the price manipulation, but I see nothing wrong with trying to hasten that day. Over the past quarter century, I petitioned the regulators incessantly to end the manipulation, but the CFTC refused to do so. Far from regretting my past efforts, I feel it has greatly advanced and legitimized the allegations of manipulation. After 25 years, however, one must recognize that the horse being beaten is dead and that the CFTC will never act.

So, instead of simply waiting for the silver shortage to end the manipulation, I thought it advisable to try a new approach that was completely compatible with the real silver story to date. Since I (we) couldn’t get the CFTC to do its job and end the manipulation; why not try a different approach? The truth is that I have long believed that the right civil lawsuit stood a good chance at ending the manipulation before a silver shortage hit. I had high hopes initially that the class-action suit that was filed against JPMorgan for manipulating the price of silver a few years ago might succeed; but it seemed to drift off track and I wasn’t particularly surprised that it was ultimately dismissed. My intent should be clear – I want to see the next lawsuit succeed.

The stakes in a COMEX silver/gold/copper manipulation lawsuit are staggering. Not only is market manipulation the most serious market crime possible, the markets that have been manipulated and the number of those injured are enormous. I don’t think it’s an exaggeration to say that any finding that JPMorgan and the COMEX did manipulate prices as I contend could very well result in the highest damage awards in history. That’s no small thing considering the tens of billions of dollars that JPMorgan has coughed up recently for infractions in just about every line of their business.

My point is that no legal case could be potentially more lucrative or attention getting than this one. Certainly, this also includes the pitfall that JPMorgan and the CME are legal powerhouses who are not likely to roll over easily. Because the silver manipulation has lasted so long and damaged so many, the stakes away from any monetary finding are staggering. It is no real stretch to suggest, with or without eventual criminal findings, the reputational and regulatory repercussions (from other countries) could threaten the existence of each institution in current form (or at least management).

What is the theory or premise of the legal case for market manipulation against JPMorgan and the CME? The COMEX has evolved into a trading structure that has allowed speculators to control and dictate the price of world commodities, like gold, silver and copper, with no input from the world’s real producers, consumers and investors in these metals. The CME has allowed and encouraged this development for the sole purpose of increasing trading fee income. Not only do the world’s real metal producers, consumers and investors have no effective input into the price discovery process on the COMEX; because the COMEX is the leading metals price setter in the world, real producers, consumers and investors are forced to accept prices that are dictated to them by speculators on the exchange.

Because so few of the world’s real producers, consumers and investors deal on the COMEX, the exchange has developed into a “bucket shop” or a private betting parlor exclusively comprised of speculators. Again, this is an intentional development as much more trading volume is generated by speculative High Frequency Trading (HFT) than by legitimate hedgers (like miners) transferring risk to speculators. Legitimate hedgers don’t day trade. It is no exaggeration to say that the COMEX has been captured by speculators and abandoned by legitimate hedgers.

In turn, JPMorgan has developed into the “King Rat” in the speculative bucket shop by virtue of its consistent market corners in COMEX gold, silver and copper futures. The COMEX market structure was already rotten when JPMorgan blasted onto the scene in March 2008 when the bank acquired Bear Stearns’ short market corners in gold and silver. Incredibly, the regulators engineered the Bear Stearns rescue, granting to JPMorgan a listed market control in addition to the OTC market share control that JPM held for years. Talk about a powerful manipulative combo – JPMorgan and the COMEX.

Perhaps the most compelling aspect of my premise for a legal case against the CME and JPMorgan for market manipulation is that it is based exclusively on public data available from the CFTC in the form of the agency’s weekly Commitments of Traders (COT) and monthly Bank Participation Reports. There is additional proof of JPM’s controlling market share in the Treasury Department’s OCC OTC Derivatives Report (please see my public comment to the Federal Reserve at the end of this piece). The CFTC data may seem somewhat complex at first, but there can be little question as to its general accuracy and government pedigree. In fact, the data is compiled from exchange information transmitted to the CFTC, so the CME can’t deny its accuracy. There’s no he said/she said or ambiguity in these data series. In short, it is type of data that will hold up in a court of law.

According to the CFTC’s data, there are two primary groups of speculators setting prices on the COMEX. One group are the technical funds, traders that buy and sell strictly on price movement. Also referred to as trend followers and momentum traders, the technical funds buy and continue to buy futures contracts as prices climb; and sell and continue to sell, including short sales, as prices fall until prices subsequently reverse. These traders are included in the Managed Money category of the disaggregated version of the COT report, primarily because they are investment funds trading on behalf of outside investors, also known as registered Commodity Trading Advisors (CTA’s).

One thing that can be said for certain about these technical funds is that they are pure speculators, as there is no mining company or user of metal in this category by CFTC and CME definition. By itself, there is nothing wrong with that as regulated futures exchanges need speculators to take the other side of the transaction when legitimate hedgers wish to lay off price risk in the normal course of their underlying business. This is the economic justification for why congress had authorized futures trading originally. The problem is that there are few, if any, legitimate hedgers involved on the COMEX nowadays; only other speculators that are falsely categorized as legitimate producers and consumers.

The second group of speculators are primarily categorized as commercials, mostly in the Producer/Merchant/Processor/User category, but also in the Swap Dealers category. Since these terms are quite specific and strongly suggest that only legitimate hedgers are included, most people automatically assume the traders in these commercial categories are just that – hedgers. But that is not the case, as most of the traders in these two categories are banks, led by JPMorgan, pretending to be hedging, but which are, in reality, trading on a proprietary basis strictly for profit. Simply put, JPMorgan and other collusive COMEX traders are just pretending to be commercially engaged in COMEX trading in gold, silver and copper when, in reality, they are nothing more than hedge funds in drag.

http://www.cftc.gov/MarketReports/CommitmentsofTraders/DisaggregatedExplanatoryNotes/index.htm

The lynchpin of any legal case against JPMorgan and the CME revolves around whether the traders in the commercial categories of the COT report are, in fact, hedging or simply speculating, as are the technical funds. The CME and JPMorgan will go to the ends of the earth to show that the commercials are hedging, not speculating and will hide behind the twin concepts that the commercials are either trading on behalf of clients or are actively involved in market making and are thereby providing much needed liquidity. It will sound legitimate if you believe in make believe stories instead of facts.

JPMorgan has a history of proclaiming it is hedging when confronted with an unnecessarily large speculative position. The first thing the bank declared when the London Whale debacle surfaced was that it was part of a hedge against the bank’s portfolio. But that was openly scoffed at and quickly discarded as an excuse. JPM is likely to trot out the hedging or market making justification, but any competent attorney will blow that away. No one (openly or legitimately) granted JPMorgan the right to maintain market corners in COMEX gold and silver.

In December 2012, JPMorgan held market shares on the short side of COMEX gold and silver that amounted to 20% and 35% of the net open interest in each market respectively. It is not possible that a reasonable person would not consider those market shares in an active regulated futures market to constitute market corners. After rigging prices lower by historical amounts in 2013, JPMorgan flipped its short market corner in COMEX gold to a long market corner of as much as 25% and reduced its short market corner in COMEX silver to under 15% from 35%, pocketing more than $3 billion in illicit profits. I’d like to see JPMorgan explain some connection to hedging with regards to its position change.

Undoubtedly, JPMorgan will claim it was “making markets” to explain away its huge position shifts in COMEX gold and silver (and copper), proclaiming it was always a buyer on the downside and a seller on the upside of prices. True enough, but far from being the market hero it will pretend to be, a closer examination will reveal something else entirely. The purpose of market making is to provide market liquidity and price stability. Legitimate traders are given some leeway from regulations limiting speculative positions and market shares from growing too large in order to enhance liquidity and price stability which benefits everyone.

But the record clearly indicates that JPMorgan, in cahoots with the CME, has used its dominant market shares in COMEX gold, silver and copper to instead engage in an evil form of market making whose intent is to constrict liquidity and create disorderly pricing. What record indicates that? The price record. Twice in 2011, the price of silver fell more than 30% ($15) in a matter of days and last year gold fell $200 and silver by $5 in two days. These price declines were unprecedented, had no legitimate supply/demand explanation and the regulators, including the CME did or said anything.

For sure, JPMorgan was a buyer on those deliberate price smashes and every other COMEX gold, silver and copper price smash for the past six years, but how does that make them a hero? This crooked bank and the CME and others arranged every COMEX price smash in order to create chaos, drain liquidity and disrupt pricing; the exact opposite of what legitimate market making is supposed to be. JPMorgan and the CME violated public trust in our markets as proven by the price record. For that, they should be made to pay dearly.

The key question is how did (and does) JPMorgan and the CME pull this off repeatedly? It all has to do with market mechanics, of which JPM and the CME are absolute masters. Since there are, essentially, two separate and competing speculative groups setting prices on the COMEX, it comes down one group scamming the other. (I know this is old hat to subscribers, but please remember I’m writing this to convince the right attorney to take on these crooks). So how does JPM get positioned to profit from a price smash (or price rise) and then rig prices to go in their direction? Basically, by scamming the technical funds by getting those funds to do what is profitable for JPMorgan and other collusive commercial traders and including the CME in the form of extraordinarily large trading volume.

How the heck does JPMorgan and the CME pull that off? They can pull it off because they know how the technical funds operate and because JPM and the CME also know how to cause the funds to buy and sell when JPM wants them to buy and sell. Since the technical funds only buy as prices are rising and only sell as prices are falling, particularly when prices penetrate key moving averages, all JPMorgan and the other collusive commercials have to do is occasionally set prices above and below those key moving averages. And thanks to an array of dirty trading tricks developed over the past 30 years, the most recent being HFT, JPMorgan can set short term prices wherever it chooses, whenever it desires.

In a very real sense, JPMorgan and other collusive COMEX commercials have become the puppet masters controlling the technical funds’ movements. It is an exquisite racket – JPMorgan gets the technical funds to buy or sell in order to take the other side of the transaction as counterparties. This can be seen in almost every price move in COMEX gold, silver and copper over the years. Let me try to present the data in graphic form, courtesy of some charts by my Aussie friend, Nick Laird of sharelynx.com.

Depicted below are the three main metals of the COMEX, gold, silver and copper and the net positions of the traders in the managed money category – the technical funds over the past couple of years. If you plot when the technical funds buy or sell, there is almost a 100% correlation to price. In other words, when the technical funds buy, prices for gold, silver and copper rise and when the technical funds sell, prices fall. The correlation is almost uncanny, to the point where some pundits have recently claimed that it is the technical funds, not the commercials, which are manipulating prices. But those claims melt away once one considers the nature of this bucket shop fraud.

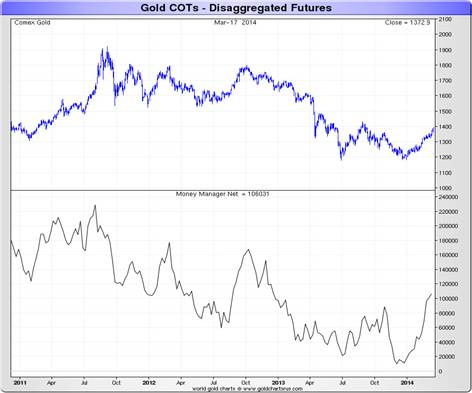
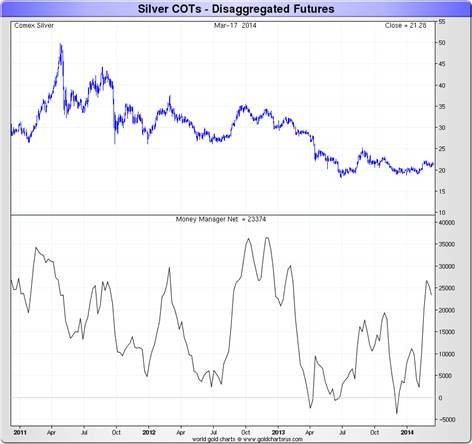
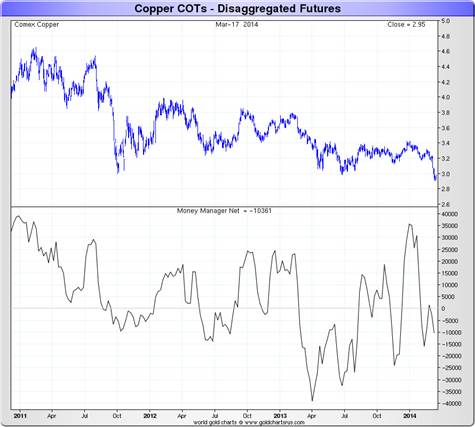
Sure, the technical funds move prices when they buy and sell, but that’s just what JPMorgan and the CME count on. If the technical funds weren’t mechanical and predictable there would be no scam possible. It is only because the technical funds can be counted on to do the same thing repetitively that allows JPMorgan and other collusive commercials to take counterparty positions. If the technical funds weren’t predictable, JPMorgan would never have made $3 billion+ last year in COMEX gold and silver and been able to flip a short market corner in COMEX gold to a long market corner. Or just ask yourself – why would the technical funds collude to harm themselves?

I also feel it is significant that I can now include copper in the JPMorgan/CME illicit scheme to manipulate. This broadens the manipulation in a systemically important way. If ever there was a case for the Racketeer Influenced and Corrupt Organizations Act (RICO), this must be it.

In one recent attorney conversation, I was asked to provide the name of a technical fund that was duped as I described and would like to seek legal redress. If I could have, I would have, but I don’t think that’s possible. It’s another reason I refer to this COMEX manipulation as almost the perfect crime. In this case, any technical fund would not likely seek redress as a victim (certainly not as the initiator of legal action) because to do so would involve having to admit being the mark at a crooked poker game, something not conducive to attracting additional investor funds. In fact, it would invalidate a technical fund’s core business and be tantamount to simply quitting a business that may have been in existence for decades. It just isn’t going to happen.

But that hardly matters because the nature of market manipulation means there are untold numbers of other victims, particularly considering the scope of the gold, silver and copper markets. Whereas the technical funds were both the enablers and sometimes victims of the scam I described above, there are many thousands of legitimate victims (including me and many of you) who did nothing to enable the scam.

I dare say that there are more potential victims of the JPMorgan/COMEX gold, silver and copper manipulations than in just about any previous financial fraud. Let’s face it, there is hardly a mining company or investor in gold and silver or mining company shares that hasn’t been damaged over the past six years to some extent. That’s when JPMorgan came to dominate COMEX trading. If a legitimate class-action lawsuit was initiated, I believe potential litigants would emerge in massive numbers. Then again, there’s only one way to find out for sure and that’s to have such a case filed.

On a number of occasions in the past, when there was still some slim hope that the CFTC might address the ongoing silver manipulation, I publicly requested that you should submit public comments on issues related to position limits. By my count, upwards of 10,000 comments were submitted collectively, for which I offered my profuse thanks. Unfortunately, because the agency appeared to be compromised on the issue, no real good came from it through no fault of our own. Therefore, I would hardly ask anyone to do that again.

But I was reminded by a subscriber that I should submit a comment in regard to the Federal Reserve’s open public comment period seeking input on whether banks should be allowed to deal in physical commodities and derivatives on such commodities. I had mentioned in a previous article that I was undecided whether to do so or not. The subscriber convinced me that it was the right thing to do in order to go on the record, to which I had to agree. I understand the comment period has been extended to April 14, for anyone wishing to submit comments for the record. There have been less than 80 comments posted thru today and mine are near the bottom http://www.federalreserve.gov/apps/foia/ViewAllComments.aspx?doc_id=R-1479&doc_ver=1

See the original article >>

The Week Ahead: Don't Let Anything Derail Your Investing Plan

by Tom Aspray

It was another rollercoaster week in the global equity markets but that has really been the trend so far in 2014, even though many of the US averages have made new all-time highs. The volatility is thought to be a friend of the trader, but I heard one commentator on national TV say that “he had been wrong for the last 60 points in the S&P.”

Of course, no active trader would ever risk that large an amount on their view of the market’s direction. It does illustrate that it hasn’t been an easy year for many traders as those who have been shorting the market since early in the year had to be very nimble in order to profit. But what is the investor to do?

chart
Click to Enlarge

This 30-minute percentage change chart tracks the S&P 500 futures and the 10-year T-note from Monday through Friday morning. The two-day uptrend in the S&P futures, line a, was broken on Wednesday at 2:00 pm Eastern time (see arrow). The futures were up around 1.8% and then quickly dropped to up just 0.75% early Thursday.

At the same time, yields were just as wild as they started to rise before the S&P futures broke support. The 10-year yield went from up 0.75% for the week to up over 4% in less than 24 hours. The actual yield jumped from 2.67% to 2.78%.

As I mentioned in Thursday’s column, I thought that the decline, Wednesday, was a mis-interpretation of Yellen’s comments and nothing had really changed for the stock market. Hopefully, investors ignored the market’s reaction but it’s events like this, as well as the sharp selloff in early February, that makes it imperative for investors to have a plan.

Depending on your age and your financial status, I think everyone should have a commitment to the stock market as long as the NYSE Advance/Decline stays positive and economic indicators like the LEI show no signs of a recession. For those who do not want to study the market, a passive approach that invests in low-cost index-tracking ETFs that follow US, as well as overseas stocks, would be the best bet. But what should the more active investor do?

chart
Click to Enlarge

The % change in the various asset classes show quite a few wide swings already this year. Gold as represented by the SPDR Gold Trust (GLD) has been the clear winner, up about 9.3%, but down from the mid-March high of 12.7%. Bonds are next as the iShares 20+ Year Treasury Bond ETF (TLT) is up just over 5%.

As of early Friday, the Spyder Trust (SPY) is up 2.6% while the Vanguard European Stock Index (VGK) is trailing a bit, up 1.9%. The emerging markets, as represented by the Vanguard Emerging Markets Index (VWO) were unchanged for the year in late January, but by early February, were down 7.6% for the year. VWO has improved from its worst levels as it is currently down just 2% for 2014.

I still think the emerging markets may be the surprise in 2014 as the technical outlook has improved but a bottom has not yet been confirmed. The more active investor should consider investing in several index-tracking ETFs, but in volatile areas, like the emerging markets, the percentage commitment should be kept low. One should consider not only the large-cap S&P 500 but also the small-cap sectors like iShares S&P 600 Small-Cap (IJR), which I recommended last Wednesday.

chart
Click to Enlarge

If you are willing to spend the time and do the work, I think you can become your own investment analyst. These more active investors should consider a core position in an S&P-500-tracking ETF and then allocate to other industry-specific ETFs. So far in 2014, the Select Sector SPDR Utilities (XLU) is up 8.8% for the year. Not too far behind is the Select Sector SPDR Health Care (XLV), which is up 7.8%.

With the recent decline in many of the high-flying biotechnology stocks, the PowerShares QQQ Trust (QQQ) is up 3.8%. Those who have been in either the Select Sector SPDR Energy (XLE) or the SPDR Dow Industrials (DIA) are pretty much flat for the year. This illustrates the importance of sector selection, and I have found relative performance to be the best tool. Using this approach to diversify your 401k in different sectors has shown to work quite well. (Learn to Drive Your Own 401k).

For those investors who want to spend at least a few hours each weekend working on their portfolios, a combination of market-tracking ETFs and individual stocks should give one the best upside potential. The correlation between stocks and the overall market has declined significantly from the same time last year and this is a plus for stock pickers.

In this week’s trading lesson, 6 Picks in Seasonally Strong Sectors, I focused on six picks and the recommendations for many were tweeted out before the stock market’s opening on March 19. Those who want to follow these recommendations, as well as those in the Charts in Play column, should also follow my Twitter feed.

Whatever type of investor you are, be sure to develop a plan and stick to it. Then, when the market is going through one of its volatile phases, you won’t sell out in a panic. I do not use stops on core mutual fund or long-term ETF positions that are established by dollar cost averaging, but I rely on the intermediate-term signals from the NYSE Advance/Decline.

For the more active approaches, it is critical that you focus on the risk of any new positions as it is those 15% or more losers that can really kill a portfolio’s performance. Be sure your stops are placed with regards to the entry, and therefore the risk, because if the risk is too high, you should find another stock or ETF to buy.

chart
Click to Enlarge

Beating the yield on the 10-year T-note will be important as living costs continue to rise. The current drought conditions in the West and the possible return of El NiƱo are likely to increase food costs even more. As the table indicates, the cost of Arabica coffee is already up over 71%, so far in 2013, with lean hogs up 42.5%. This is especially discouraging for those with families as their food costs are already high. The Wall Street Journal is projecting a 2.5-3.5% rise in food prices in 2014, so a 2.75% yield in T-notes won’t keep pace with rising food costs.

Last week’s economic data overall was good as Industrial Production and the Philadelphia Fed Survey were much better than expected. The Leading Economic Indicators also rose 0.5% this month and the strong uptrend in last week’s chart clearly points to a steadily improving economy.

The data on housing was mixed but it will be the next several months that are the key. The Housing Market Index and Existing Home Sales data were weaker than expected while the Housing Starts met expectations.

On Monday, we will get the flash PMI Manufacturing Index, followed on Tuesday by the S&P Case-Shiller Housing Price Index, New Home Sales, and Consumer Confidence. The latest data on Durable Goods comes out on Wednesday followed by the final 4th quarter GDP reading on Thursday. Also on Thursday we get the jobless claims and the Pending Home Sales Index.

The final reading on Consumer Sentiment from the University of Michigan is out on Friday as is the Personal Income and Outlays report.

What to Watch
The stock market won out last week though it was not an easy ride. The bond market was also quite volatile but last week’s argument for stocks over bonds has not changed. The action early in the week may tell us whether the S&P 500 is going to challenge the 1900 level or if it is going to meander in its trading range of 1820-1884.

The further new highs in the A/D line continues to favor an eventual move to the upside. There were signs from the retail sector last week that the consumer discretionary may be ready to come back strong.

It along with the financials and healthcare sectors are in a strong seasonal period. Several stocks and an ETF from these sectors were the focus of this week’s 6 Picks in Seasonally Strong Sectors. The action of the regional banks has been quite impressive as a few have broken out to the upside.

As I have been saying for several weeks, the relatively high bullish sentiment and moderately overbought status of the market does not warrant a complacent approach. Therefore, I updated the stops in the Charts in Play portfolio last week and took some more profits.

According to AAII, the individual investors are a bit less bullish now at 36.78%, down from 41.34%, as Yellen’s comments must have gotten their attention. Only 26.15% are bearish, which is still too low as it was 36.41% on February 6.

The five-day MA of the percentage of S&P 500 stocks above their 50-day MAs has fallen to 69.6% from the 76% area and the MA is trying to turn up again.

The daily chart of the NYSE Composite shows that the 10,266 level, line a, was tested last week and it has held so far. The monthly pivot support is at 10,209 with the quarterly pivot at 10,082. Based on current data, the quarterly pivot will be at 10,232 in April.

chart
Click to Enlarge

The daily starc- band is at 10,177 with further support in the 9900 to 10,000 area. Initial resistance stands now in the 10,400-500, and a close above this level, will confirm the resumption of the uptrend.

The McClellan oscillator popped up to +57 last Tuesday before dropping down to -63 on Thursday. It is trying to turn up and shows a short-term uptrend, line c. A strong move above the prior high and the downtrend, line b, will confirm higher prices.

chart
Click to Enlarge

The daily NYSE Advance/Decline made a convincing new high on Tuesday though it is not as clear from this chart. Those of you who follow the A/D line on stockcharts.com will be convinced. The A/D line is holding above its WMA.

S&P 500
The daily chart of the Spyder Trust (SPY) shows Friday’s spike to a new high at $189.02  as it held above its 20-day EMA at $186.20 on a closing basis all week. It ended lower for the day but still higher for the week. The daily starc- band is now at $182.72 with monthly pivot at $182.38, line a.

The resistance stands in the $189-$190 area and a close above $190 will signal a move to the weekly starc+ band now at $193.41.

The daily OBV is still lagging the price action as it has formed lower highs. The OBV is slightly below its WMA with next good support at line c. The weekly OBV (not shown) is still holding well above its WMA and did confirm the recent highs.

The daily S&P 500 A/D line bounced from its WMA last week and now has first strong support at the March 13th lows, with then further support at line d.

chart
Click to Enlarge

Dow Industrials
The SPDR Dow Industrials (DIA) surged in early trading Friday to a high of $164.20 but was not able to hold its gains in late trading. The quadruple witching action likely did not help. A strong close above the resistance at $164.77 would be quite positive and likely mean a rally to new highs.

There is important support now in the $160.52 area with the daily starc- band at $159.17.

The on-balance volume (OBV) still shows lower highs, line g, which is not a positive sign as it is still below its WMA. In contrast, the weekly OBV (not shown) has just moved back above its WMA.

The daily Dow Industrials A/D line did bounce off good support two weeks ago and is just holding above its WMA.

Nasdaq-100
The PowerShares QQQ Trust (QQQ) closed the week higher but well below its best levels. Last week, a low close doji sell signal was triggered and the QQQ needs to move above $91.36 to reverse this signal.

There is next support at $88.45 and the monthly pivot. The 20-week EMA is at $86.17 and the trend line support is at $85.50. This also coincides with the weekly starc- band.

The weekly relative performance will close the week below its WMA as it had broken its daily support several weeks ago when the uptrend, line b, was broken. At this point, one can’t tell whether this is a real change in leadership or just a pause like we saw in the IWM earlier in the year.

The weekly OBV continues to look very strong and it is close to its all-time highs as it rose last week. It is well above the support at line c and its rising WMA. The daily AOT moved firmly into the sell mode on March 6 and has not moved back into the buy mode.

The Nasdaq 100 A/D line did make not make a new high last week and has dropped below its WMA. There is first resistance now at $90.65-$91.

chart
Click to Enlarge

Russell 2000
The iShares Russell 2000 Index (IWM) has moved sideways for the past three week after testing its weekly starc+ band, but is still the best major sector ETF. This band is now at $123.67, which corresponds nicely with the projected monthly pivot resistance at $123.40.

There is minor support now at $117.50-$118 and then in the $115.60-$116.30 area. The strongly rising 20-week EMA is at $113.36.

The weekly relative performance has now moved to new highs as it overcame resistance at line e, signaling that it is still a market leader. There is key support at the early February lows.

The weekly OBV still looks strong as it is above its flat WMA. It made a new high just a few weeks ago. The daily OBV is ready to close below its WMA so the multiple time frame OBV analysis is still mixed.

The Russell 2000 A/D line has held above good support and its flat WMA.

See the original article >>

The bitter medicine of quantitative easing

by SoberLook.com

Barry Ritholtz wrote an opinion piece on Bloomberg today arguing that it's hard to criticize the Fed's QE programs simply because we don't know what would have happened without them. Since this is not a "controlled" experiment in which we can compare a patient taking experimental medication with the one taking a placebo, there is no way to tell if the therapy had worked. All we know is that the patient has undergone a slow recovery and according to the "doctor" may have been worse off without the "treatment".

"If you are testing a new medication to reduce tumors, you want to see what happened to the group that didn't get the test therapy. Maybe this control group experienced rapid tumor growth. Hence, a result where there is no increase in tumor mass in the group receiving the therapy would be considered a very positive outcome."
This argument was used a number of times in recent years, including for example with the American Recovery and Reinvestment Act of 2009 - the $840 billion "stimulus" bill. There are all sorts of estimates on how many jobs the bill saved/created and how many GDP points were added. Was it effective relative to other job creation programs? We of course will never know because we can't peer into an "alternative universe" where the stimulus bill had not passed.
But maybe we are asking the wrong question. Let's for a moment stay with the medication analogy that Mr. Ritholtz introduced. Experimental medication is usually applied in dire cases when the patient's health is deteriorating and traditional therapies had not worked. The use of the first round of quantitative easing, QE1, was just such a case. It was necessary to stabilize the banking system that was frozen - an extreme problem that called for radical measures. But what about QE3? Mr. Ritholtz argues that with other parts of the federal government dysfunctional, the Fed was simply the only game in town to get the economy moving.
However was the US economy in such a disastrous shape in the summer of 2012 that it called for another extreme intervention? Clearly growth was uneven and the labor markets remained wobbly. Nevertheless a recovery was taking place. A patient who is getting better, albeit slowly, is generally not given an ever larger dose of experimental medication in hopes of miraculously accelerating the recovery.

Rather than Mr. Ritholtz's tumor analogy, let's think about QE as delivering excessive doses of experimental pain killers. Yes the patient may feel better at first, but as we all know, prolonged use could create some nasty side effects. The key side effect of course is addiction - which over a long period of time requires one to administer ever larger doses in order to obtain the same effect. And now you are not just fighting the disorder but also the withdrawal symptoms. That is precisely what is taking place these days (see post). Furthermore, the uncertainty surrounding the QE "withdrawal symptoms" is what had put some of the economic activity on hold, activity that is only now beginning to return (see post).

What's particularly troubling about QE is that even after the "injections" are taken away, the nation's banking system is saddled with the "long-term side effect". The US monetary base is now near $4 trillion, with some $2.5 trillion of it sitting on banks' balance sheets in the form of excess reserves - a situation with no precedent. Removing it would require the Fed to sell its securities holdings - something the central bank is not planning to do. This bloated monetary base is going to be with us for a while even as the Fed's securities purchases end - an "experimental drug" whose long-term effects remain unknown.

See the original article >>

weekend update

by Elliott Wave Theory

REVIEW

The market started the week gapping up after last Friday’s decline to SPX 1840. The rally carried it into FOMC Wednesday to SPX 1874. Then right after the FOMC statement was released the market dropped to SPX 1850. Another rally carried the market to match the all time high at SPX 1884 on Friday. Then right after the open Techs sold off and the market pulled back again. Another choppy week, only this time to the upside. For the week the SPX/DOW were +1.45%, the NDX/NAZ were +0.7%, and the DJ World index rose 0.7%. Economic reports for the week were positive. On the uptick: NY/Philly FED, capacity utilization, industrial production, NAHB, housing starts, building permits, CPI, leading indicators and the monetary base. On the downtick: existing home sales, and weekly jobless claims edged higher. Next week: Q4 GDP, Durable goods orders, and more Housing reports.

LONG TERM: bull market

We continue to count this bull market as a five Primary wave Cycle wave [1]. Primary waves I and II completed in 2011 and Primary wave II has been underway since then. Primary I divided into five Major waves with a subdividing Major wave 1. Primary III has also divided into five Major waves. However, Major waves 1 and 3 subdivided and likely Major 5 is subdividing as well.

SPXweekly

From the Major wave 4 low in August 2013, we have labeled Intermediate wave one at SPX 1851, Int. two at SPX 1738, and Int. three underway now. Int. wave three has already made a new bull market high at SPX 1884, and the NDX/NAZ have made new highs too. However, the DOW continues to lag as noted with the three chart illustration in last weekend’s report. The DOW has still not exceeded its December 2013 high. Nevertheless, we see Primary wave III continuing in at least the SPX/NDX/NAZ in the coming months.

MEDIUM TERM: uptrend

The bull market in the SPX matched its all time high this week, but the DOW/NDX/NAZ did not. As a result the market remained choppy for the fifth week in a row. This may make sense to some as the first wave of this uptrend, Minor 1, was quite strong and unfolded in less than three weeks. Some choppiness was then expected, as we have been anticipating this uptrend to last for a few months with only an upside target of SPX 1962+.

SPXdaily

We are counting this Int. wave three uptrend as five Minor waves. Minor 1 completed at SPX 1868. Minor wave 2, however, appears to have formed an irregular failed flat SPX: 1834-1884-1840. The rise above SPX 1868 makes it irregular, and the failure to reach the wave A low at 1834 makes it a failed flat. At the recent SPX 1840 low we had an oversold condition in all four major indices, and a positive divergence on the hourly chart. The market responded by rallying this week. Once SPX 1884 is cleared we will feel more confident about labeling Minor wave 3 underway. Thus far we have maintained tentative green labels for all of the activity since the Minor 1 high at SPX 1868. Medium term support is at the 1841 and 1828 pivots, with resistance at the 1869 and 1901 pivots.

SHORT TERM

Short term support is at the 1841 and 1828 pivots, with resistance at the 1869 pivot and SPX 1884. Short term momentum declined to oversold after hitting quite overbought on Friday. The short term OEW charts have been vacillating of late, ending the week positive with the reversal level still at SPX 1869.

SPXhourly

As noted above the market activity from the Minor wave 1 high at SPX 1868, and even before, has been quite choppy. It does look like Minor wave 2 bottomed recently at SPX 1840. The rally from that low, however, is also a bit choppy: 1874-1850-1884-1863. Either the market is setting up, with subdividing waves, for a surge higher. Or this week’s rally is corrective as well, and a retest of SPX 1834-1840 is next. With the SPX hitting its high right after the open on Friday, and then pulling back during options expiration. We lean towards the former rather than the latter. Once SPX 1884 is cleared we will likely label the two recent highs as Minute i at SPX 1874, and Micro 1 at 1884. Best to your trading!

FOREIGN MARKETS

The Asian markets were quite mixed on the week losing 0.4%.

The European markets were all higher on the week gaining 2.3%.

The Commodity equity group also rose gaining 4.3%.

The DJ World index is still uptrending and gained 0.7%.

COMMODITIES

Bonds continues to downtrend losing 1.0% on the week.

Crude appears to be downtrending but gained 0.6% on the week.

Gold appears to entering a downtrend and lost 3.5% on the week.

The USD set up a positive divergence for a potential uptrend, it gained 1.0% on the week.

NEXT WEEK

Tuesday: Case-Shiller, FHFA housing, Consumer confidence and New home sales. Wednesday: Durable goods orders. Thursday: Q4 GDP, weekly Jobless claims and Pending home sales. Friday: Personal income/spending, PCE and Consumer sentiment. On Monday, FED governor Stein gives a speech at 9am. Best to your weekend and week!

See the original article >>

Tech momentum hits levels not seen since 2000 bubble highs!

by Chris Kimble

CLICK ON CHART TO ENLARGE

Since the 2009 lows, tech has done very well, up over 190% in the past 5 years. This rally has pushed momentum to levels not seen in 14 years! We have to go back to the dot.com peak to find momentum this high. At the same time momentum is lofty, the NDX 100 is hitting a line in the sand that has been important for the past 24 years!

I believe that it can be rewarding to pay attention to leadership. Even though tech has done well, Bio tech has been white hot over the past 24 months. The inset chart reflects that two leading bio tech companies and Bio tech ETF (IBB) have broken support lines of late.

Should we pay attention to tech due to momentum and patterns? I think so!

See the original article >>

SPY Trends and Influencers

by Greg Harmon

Last week’s review of the macro market indicators suggested, heading into the March Options Expiration week and ahead of the widely expected invasion of the Ukraine the markets were jittery if not tired or weak. Specifically it looked for Gold ($GLD) to continue higher in its uptrend while Crude Oil ($USO) slowed in its pullback and might be ready to reverse higher. The US Dollar Index ($UUP) looked to continue lower while US Treasuries ($TLT) were biased higher and near a break of major resistance. The Shanghai Composite ($SSEC) and Emerging Markets ($EEM) were biased to the downside with a risk of the Chinese market consolidating and then a possible reversal. Volatility ($VIX) looked to remain low but moving higher cutting the breeze at the back of the equity index ETF’s $SPY, $IWM and $QQQ. Their charts suggested that the SPY and IWM are a bit stronger than the QQQ and may be ready to consolidate and reverse higher, while the QQQ is biased lower.

The week played out with Gold falling back to support while Crude Oil consolidated. The US Dollar found its footing and bounced while Treasuries ended nearly unchanged after a early pullback. The Shanghai Composite did consolidate while Emerging Markets bounced around in a tight range. Volatility made a move back lower, settling in among the Simple Moving Averages (SMA). The Equity Index ETF’s bounced off of the lows from last Friday, with the SPY making a new intra-day high, before they gave back most of it Friday. What does this mean for the coming week? Lets look at some charts.

As always you can see details of individual charts and more on my StockTwits feed and on chartly.)

SPY Daily, $SPY
spy d
SPY Weekly, $SPY
spy w

The SPY started the week higher, confirming the doji reversal candle from last Friday. The move Tuesday found resistance then at the top of the bearish engulfing candle from last week and consolidated there the rest of the week, until it briefly poked to a new all time high Friday. The RSI on the daily chart suggests that the bounce may be short lived, currently failing to reach the previous high, and the MACD only briefly blinking and then continuing lower. The weekly view shows an inside week on the real body, but broadly consolidation over the last 4 weeks at the highs. The RSI is holding over 60 and bullish while the MACD failed to cross higher. These suggest it may need some further consolidation. There is resistance at 188 and 189 and then a Measured Move higher to 193 and then 209. Support lower comes at 185 and 184 followed by 181.80. Consolidation in the Uptrend.

Heading into the last full week of the First Quarter the equity markets again look tired. Outside of them directly though look for Gold to consolidate or continue higher while Crude Oil has a similar feel for a reversal in its case. The US Dollar Index is showing strength in the short run while US Treasuries are consolidating tin the short term uptrend. The Shanghai Composite looks good for more upside price action and Emerging Markets look as if they may want to continue the consolidation. Volatility looks to remain subdued keeping the bias higher for the equity index ETF’s SPY, IWM and QQQ. Their charts are not so sure of that though with all 3 consolidating under the highs on the shorter timeframe but the IWM and SPY looking healthy, and a little better than the QQQ on the longer timeframe. Use this information as you prepare for the coming week and trad’em well.

See the original article >>

Follow Us