Thursday, March 20, 2014

EUR/USD Elliott Wave outlook

By Elliott Wave Forecast

The U.S. Dollar Index is on the move since yesterday when the FED said it would reduce its monthly bond purchases by an additional $10 billion to $55 billion. The U.S. Dollar Index also recovered on hints from Fed Chair Janet Yellen that the bank could begin to raise interest rates sooner than anticipated.

Gold is moving down, the S&P 500 is falling as well, and USD is up against all other major currencies. Our focus today and tomorrow will be on EUR/USD. A decline from 1.3966 March high is in three legs, and now we need to have to wait on important evidences, either to confirm a corrective retracement which would allow us to look for longs once the market bottoms or we wait more signs for a bearish impulse as this one is also one of the possibility.

However, for a bearish case we would need to see further impulsive weakness down 1.3700/40, to make sure it’s an extended wave (iii).

The bearish count has my special attention because of the S&P 500 that can revisit 1820 level from last week. EUR/USD and S&P 500 has positive correlation now. In fact EUR/USD is even weaker than the S&P 500 so if S&P 500 will fall down, which is expected then Euro may lose even more value against the USD. 


See the original article >>

What History Says About Fed Rate Hikes

by Lance Roberts

Yesterday, Janet Yellen gave her first post-FOMC meeting press conference.  In her prepared statement, she stated exactly what was already expected:

1) accommodative policy will remain in place for a considerable amount of time after the current quantitative easing program ends this fall,

2) employment is improving,

3) the economy is recovering but has more work to do, and;

4) the current quantitative easing program would be "tapered" from $65 to $55 billion per month beginning in April.

The problem for the markets came during her press conference when she was asked what a "considerable amount of time" between the end of the current QE program and the first rate hike would be.  She replied: "About six months."  It took the markets about 5-seconds to understand exactly what that meant: "Rate hike in early 2015."  If you want to know the precise moment that those words were uttered, just look at the chart below to see if you can figure it out.

FOMC-ratehike-2015

The question is this:

"If the Fed begins to hike interest rates, what effect does that have on the economy and the markets?"

According to Jim Cramer last night, he said the idea of rising interest rates shocked the markets, however, in the long-term it's a positive sign. Rates rise as the economy does better.


The assumption he makes is that as the economy "catches fire" and corporate profits increase, then it is natural for interest rates to rise also.  If a growing economy is a function of expanding profitability, then what is wrong with the chart below. (For more detail read: 50% Profit Growth)

"The chart below shows corporate profits, per the BEA, divided by GDP.  (You can substitute GNP but the result is virtually identical between the two measures.)"

Corporate-Profits-GDP-112613

"The current levels of profits, as a share of GDP, are at record levels.  This is interesting because corporate profits should be a reflection of the underlying economic strength.  However, in recent years, due to financial engineering, wage and employment suppression and increase in productivity, corporate profits have become extremely deviated."

Cramer, also correctly states that much of the profitability increases for corporations have come from stock buybacks and cost cutting.  However, many of those stock buybacks and dividend increases (as with AAPL) have been financed with low interest rate debt issuance.  If rates rise, this is no longer an option.  The "cash on the sidelines" story is true to some degree as total liquid assets as a percentage of total assets is near all time highs.  However, corporations have relevered balance sheets to a large degree due to the cheap cost of debt.  The chart below shows the ratio of cash to debt.

Total-Asset-Liabilities-032014

As far as cost cutting goes, much of that has come from reducing employment.  However, as the chart below of full-time employment relative to the population shows, corporations have likely "milked that cow dry."

Employment-Fulltime-population-031214

The problem is that the data suggests that artificially low interest rates and ongoing monetary interventions have been a key driver of both market returns and corporate profitability.  However, what has been lacking is sustainable, organic, economic growth.

With this background, the consequence of a hike in overnight lending rates (Fed funds rate) will likely have far more significant impact on corporate profitability, economic growth and market returns than currently believed.

In order to support that conclusion a historical look at Federal Reserve actions can give us clues about future outcomes.  The first chart below shows the fed funds rate as compared to economic growth.

Fed-Funds-GDP-032014

What is interesting is that a case can be made that the Federal Reserve's monetary policies are potentially complicit in both economic booms and busts.  When the Federal Reserve has historically begun raising interest rates the economy has slowed down, or worse.  Subsequently, the Fed has to reverse its policies to restart economic growth.

It is significant that each time the Fed has lowered the overnight lending rate, the next set of increases have never exceeded the previous peak.  This is due to the fact, that over the last 35 years, economic growth has been on a continued decline.  I have detailed this declining trend in the Fed funds rate below as compared to the S&P 500.

Fed-Funds-SP500-032014

Increases in interest rates are not kind to the markets either.  I have highlighted, with the vertical dashed black lines, each time the Fed has started increasing the overnight lending rates.  Each time has seen either market stagnation, declines, or crashes.  Furthermore, it is currently implied that the Fed funds rate will increase to 3% in the future, yet the current downtrend suggests that an increase to 2% is likely all that can be withstood.

As I stated in yesterday's missive, I am currently fully allocated to the markets only because the markets are rising.  However, it is important to understand investment risks are rising due to the changing fundamental environment.  Rising interest rates will negatively impact earnings as borrowing costs rise, housing as mortgage costs increase, disposable incomes as debt costs rise, etc.  With an economy that is nearly 70% driven by consumption there is little wiggle room for increased costs when incomes remain primarily stagnant.

My suspicion is that while Ms. Yellen stated that interest rates could rise as soon as 2015, it is possible that it will be far longer than that.  That is unless we do somehow achieve an economic growth miracle starting six years into an ongoing recovery.  Just because it has never happened in the past, doesn't mean it can't happen this time...right?

See the original article >>

At last, fundamentals outweigh Fed speak

By Joseph Ciolli and Callie Bost

U.S. stocks rose after better-than- forecast data on leading indicators and regional manufacturing fueled optimism in the economy, overshadowing comments that interest rates may rise in the middle of next year.

Microsoft Corp. gained 2.4 percent after Morgan Stanley said the company’s anticipated Office software for Apple Inc.’s iPad could deliver $1.2 billion a year in billings. AT&T Inc. jumped 3.3 percent to lead a rally in phone stocks. Guess? Inc. slipped 4.9 percent after its full-year earnings projection trailed analysts’ predictions.

The S&P 500 gained 0.5 percent to 1,870.73 at 12:29 p.m. in New York. The Dow Jones Industrial Average added 113.12 points, or 0.7 percent, to 16,335.29. Trading in S&P 500 stocks was 2.5 percent above the 30-day average at this time of day.

“The market has digested and even discounted a bit what Yellen said, and put things into perspective,” Stephen Carl, principal and head equity trader at New York-based Williams Capital Group LP, said in a phone interview. “We have to see how the economy continues to move along. People are back focusing on signs of economic growth.”

The equities benchmark fell 0.6 percent yesterday after Federal Reserve Chair Janet Yellen said the central bank’s stimulus program could end this fall and benchmark interest rates could rise about six months later. The Fed had previously said it would not raise rates for a considerable period, without specifying a time frame.

Fed Stimulus

Quarterly Fed forecasts also showed more officials predicting that the benchmark rate, now close to zero, will rise to at least 1 percent at the end of 2015 and 2.25 percent a year later. The central bank said it would trim its monthly bond purchases by $10 billion to $55 billion.

Three rounds of Fed stimulus and low interest rates have helped boost the equity gauge as much as 178 percent from a 12- year low as U.S. stocks enter the sixth year of a bull market.

Yellen also said harsh winter weather was a significant reason for weakness this year in economic data from housing to jobs.

Data today showed the world’s largest economy will strengthen after the weather-induced slowdown in the first quarter, as the index of leading indicators rose more than forecast in February.

Data Watch

Jobs data today indicated the number of Americans filing applications for unemployment benefits held last week near the lowest level in almost four months, a sign the labor market continues to strengthen.

The Philadelphia Fed’s manufacturing gauge rose to 9.0 in March from minus 6.3 the prior month. The average estimate was for an increase to 3.2. Separate data showed purchases of previously owned homes declined in February to the lowest level since July 2012.

Investors also watched the situation in Ukraine, where the government in Kiev said yesterday it plans to reinforce its eastern border with Russia and withdraw troops from Crimea, ceding control of the Black Sea peninsula as tensions remained high over Russian moves to annex the breakaway region.

President Barack Obama said today the U.S. is imposing financial sanctions on a wider swath of Russian officials and a Russian bank as he authorized further penalties that would directly target sectors of the economy.

Volatility Gauge

The Chicago Board Options Exchange Volatility Index, a gauge for U.S. stock volatility, fell 2.1 percent at 14.81.

Eight of the 10 main industries in the Standard & Poor’s 500 Index advanced, with phone and bank stocks rising at least 1.3 percent to pace gains. AT&T jumped 3.3 percent, the most since January 2013, to $34.06 for the biggest jump in the Dow.

The KBW Bank Index jumped 2 percent before the results of annual reviews known as stress tests, due today and on March 26. The outcome may enable America’s lenders to unlock more than $75 billion that they hold in excess capital.

JPMorgan Chase & Co. rallied 2.8 percent to $59.93, the highest since 2000.

If the banks pass the Federal Reserve’s capital-planning simulations, they may increase their dividends and buybacks by 69 percent over the next 12 months, according to analyst estimates compiled by Bloomberg.

Microsoft gained 2.4 percent to $40.23, the highest since July 2000. Chief Executive Officer Satya Nadella is expected to debut a version of Office for the iPad at an event next week. Morgan Stanley maintained its equalweight view on the stock.

Guess declined 4.9 percent to $27.36 after forecasting earnings for fiscal-year 2015 of $1.40 to $1.60 a share, missing the average analyst estimate of $2.03 a share. The apparel maker predicted a first-quarter net loss of 5 cents to 9 cents a share.

See the original article >>

Stocks Extend Short-Term Consolidation Following FOMC Statement Release

By: Paul_Rejczak

The U.S. stock market indexes lost between 0.6% and 0.7% on Wednesday, as investors reacted to the FOMC statement release. The S&P 500 index moved away from its March 7 all-time high of 1,883.57, extending few week long consolidation. The resistance remains at around 1,880-1,900, and the nearest important support level is at 1,840-1,850, marked by the recent local low, among others. There is no clear short-term direction, as we can see on the daily chart:

Expectations before the opening of today’s session are negative, with index futures currently down 0.3%. The main European stock market indexes have lost 0.9-1.2% so far. Investors will now wait for some economic data releases: Initial Claims at 8:30 a.m., Existing Home Sales, Philadelphia Fed indicator and the Leading Indicators at 10:00 a.m. The S&P 500 futures contract (CFD) extends its consolidation along the level of 1,850, following a rebound from Monday’s low. The resistance is at 1,865-1,870, and the nearest support is at around 1,840, as the 15-minute chart shows:

The technology Nasdaq 100 futures contract (CFD) bounced off the psychological resistance at around 3,700, as it trades along the level of 3,660. For now, it looks like a rather flat correction within short-term downtrend:

See the original article >>

Stock Market Broadening Wedge Trendline May Break Today

By: Anthony_Cherniawski

SPX has declined in the Pre-market to near 1856.00. That was expected as a high probability, since it had closed beneath mid-Cycle support/resistance at 1861.54. A break of the lower trendline of the Broadening Wedge at 1850.00 gives us the confirmed sell signal of that formation.

It is possible, based on the futures activity, that SPX may open beneath 1850.00. The VIX and Hi-Lo are both on sell signals, so we may see more downside action today, with rising volume.

See the original article >>

Gold & Silver Stocks Breakdown Alert

By: P_Radomski_CFA

Briefly: In our opinion short speculative positions in silver (half) and mining stocks (full) are justified from the risk/reward perspective.

The dollar’s rally and the precious metals’ decline were seen right after comments from the Fed about the planned $10 billion cut in asset purchases. They will now amount to “only” $55 billion per month.

The dollar’s rally and the precious metals’ decline had been already seen in the charts and the Fed comments served as a catalyst.

Let’s see how much has actually changed (charts courtesy of http://stockcharts.com):

Gold moved  lower once again but still not low enough to break below the rising support line. Gold is still outperforming silver and mining stocks (taking this month into account), but now the extent of the outperformance is much smaller. Still, with the situation in Ukraine still being tense, gold might hold up relatively well even if the rest of the precious metals sector declines.

At this time we see that gold’s reaction to the events in Ukraine has been very limited. When markets don’t react to factors that should make them move in a certain direction, they will likely move in the opposite direction relatively soon. In this case, it seems that gold will move lower.

The move below the rising support line (marked in red) could symbolize the start of another big downleg regardless of the geopolitical tensions. For now, the price of gold is already close to this support, but not yet below it.

Silver’s decline was not as big as the one that we saw in gold but in today’s pre-market trading silver is once again declining more visibly than gold is. It seems that the decline will accelerate after the breakdown below the long-term rising support lines, and then accelerate further as silver moves below its 2013 low.

Yesterday, we wrote the following:

The miners‘ invalidation of the move above the 61.8% Fibonacci retracement level resulted in further declines, as expected. The GDX ETF hasn’t moved below the rising support line, though, which means that the situation hasn’t become more bearish as far as short term is concerned. It was bearish and still is, but it’s not really more bearish.

For mining stocks, however, the rising support line is much closer than it is the case with gold. If miners break below it (and they likely will), gold might follow.

The GDX ETF is now visibly below the rising support line and also closed below the 50% retracement, which are both bearish factors. We generally wait for a breakdown to be confirmed before opening or adding to short positions, but...

We saw a big downswing also in the HUI Index and it resulted in a major sell signal from the Stochastic indicator. In the past 3 years all cases (and many cases before 2011) when we saw this signal were followed by major downswings.

Perhaps the GDX ETF’s move below the rising support line is not confirmed yet, and we would normally not take action based on it, but combined with the major sell signal for the HUI Index and the Stochastic indicator, that seems justified.

Before summarizing, let’s take a look at the currencies.

We previously wrote that the Euro Index was likely to decline based on the long-term resistance line being reached and that the precious metals were likely to decline significantly based on that – and they have.

The same goes for the situation in the USD Index. The U.S. currency was about to rally and it finally did. It took only one day to erase the declines of many previous days. Back in 2013 an analogous rally was even bigger, so it might be the case that the rally is not over just yet. In fact, we think the USD Index has much further to go.

All in all, we can summarize the current situation in the precious metals market in the same way we have been summarizing it for the last couple of days:

It seems that the precious metals sector will move lower in the coming weeks, but just in case the situation in Ukraine deteriorates, we are keeping half of the long-term investment position in gold. In fact, gold has been outperforming both silver and mining stocks since Russian troops entered Crimea.

At this time however, the technical picture for mining stocks has deteriorated significantly, and thus in our opinion adding to the currently opened short position in mining stocks is justified from the risk/reward perspective.

It seems to us that if it weren’t for the events in Ukraine, the precious metals sector would be already declining and perhaps testing the 2013 lows or moving below them. This could still take place and it’s quite likely to happen once the situation in Ukraine stabilizes.

To summarize:

Trading capital (our opinion): Short positions: silver (half) and (full) mining stocks.

Stop-loss details:

- Silver: $22.60
- GDX ETF: $28.9

Long-term capital (our opinion): Half position in gold, no positions in silver, platinum and mining stocks.
Insurance capital (our opinion): Full position

You will find details on our thoughts on gold portfolio structuring in the Key Insights section on our website.

As always, we'll keep our subscribers updated should our views on the market change. We will continue to send them our Gold & Silver Trading Alerts on each trading day and we will send additional ones whenever appropriate. If you'd like to receive them, please subscribe today.

See the original article >>

Europe needs a new energy supplier

By Ewa Krukowska

European Union leaders want a road map by mid-year for reducing reliance on Russian natural gas as they seek to punish Russia for its annexation of Crimea, according to a draft EU document.

The EU’s 28 chiefs plan to ask the European Commission, the bloc’s executive arm, to outline within three months ways to diversify energy sources away from Russia, which is the main supplier of gas and oil to Europe. The crisis in Ukraine, a transit country for Russian energy consumed by the EU, is set to dominate a two-day meeting of prime ministers and presidents in the European Council.

“Efforts to reduce Europe’s high gas energy dependency rates should be intensified, especially for the most dependent member states,” according to a draft statement to be adopted at the summit in Brussels tomorrow. “The European Council calls on the Commission to conduct an in-depth study of EU energy security and to present by June 2014 a comprehensive plan for the reduction of EU energy dependence.”

The EU’s energy dependency rate is set to rise to 80 percent by 2035 from the current 60 percent, according to the International Energy Agency. Gas from Russia accounted for almost 32 percent and oil for about 35 percent of the bloc’s imports in 2010, according to EU data.

Ukrainian Crisis

EU leaders may discuss energy security in the context of the Ukrainian crisis over a dinner today and are scheduled to hold a first debate on the 2030 climate and energy framework for the bloc tomorrow. They also plan to urge member states to step up integration of electricity and gas markets in order to help reduce prices, which in some regions of Europe are double those in the U.S., where shale-gas production has brought the world’s biggest economy toward energy independence.

Europe’s oil and gas import bills rose to more than 400 billion euros ($551 million) in 2012, representing about 3.1 percent of the region’s gross domestic product, according to EU data. That compares to about 180 billion euros on average in 1990-2011.

In addition to greater diversification of energy sources, the leaders also want the commission to examine ways to boost Europe’s bargaining power vis-a-vis suppliers, according to the draft statement.

Poland, which relies on Russian gas monopoly OAO Gazprom for about two-thirds of its consumption, supports the planned EU call to increase the bloc’s bargaining power. Prime Minister Donald Tusk said he discussed various options for tightening cooperation among governments with German Chancellor Angela Merkel last week so that the EU can have stronger purchasing leverage.

Commission Plan

“I hope that we will be able to start this process today,” he told reporters in Brussels as the EU summit was getting underway. “The most important thing will be to oblige the European Commission to start preparations.”

The plan to be prepared by the commission should take into account that the EU needs to boost energy efficiency and continue to develop renewable and other indigenous energy sources, the draft summit conclusions say. That reflects calls by countries including the U.K and Poland, where shale-gas reserves promise to create new jobs and cut reliance on imported fuels.

The U.K. also wants EU leaders to ask the commission to present an in-depth study of Europe’s energy security and a 25- year plan to improve it, according to a government document for the summit.

Options for the bloc to diversify its energy sources include gas imports from the U.S. and development of the so- called southern corridor for gas from the Caspian region and Iraq, and increased cooperation with Norway and North Africa, said the U.K. It cited interruptions in the supply of Russian energy to the EU because of price disputes with Ukraine during the previous decade.

“Crises in Ukraine in 2006, 2009 and more recently have repeatedly illustrated the need to ensure Europe is not over- reliant on a limited number of sources of energy or vulnerable to external pressure,” according to the U.K.

See the original article >>

Fed continues taper despite slowing growth

By Press Release

Information received since the Federal Open Market Committee met in January indicates that growth in economic activity slowed during the winter months, in part reflecting adverse weather conditions. Labor market indicators were mixed but on balance showed further improvement. The unemployment rate, however, remains elevated. Household spending and business fixed investment continued to advance, while the recovery in the housing sector remained slow. Fiscal policy is restraining economic growth, although the extent of restraint is diminishing. Inflation has been running below the Committee's longer-run objective, but longer-term inflation expectations have remained stable.

Consistent with its statutory mandate, the Committee seeks to foster maximum employment and price stability. The Committee expects that, with appropriate policy accommodation, economic activity will expand at a moderate pace and labor market conditions will continue to improve gradually, moving toward those the Committee judges consistent with its dual mandate. The Committee sees the risks to the outlook for the economy and the labor market as nearly balanced. The Committee recognizes that inflation persistently below its 2 percent objective could pose risks to economic performance, and it is monitoring inflation developments carefully for evidence that inflation will move back toward its objective over the medium term.

The Committee currently judges that there is sufficient underlying strength in the broader economy to support ongoing improvement in labor market conditions. In light of the cumulative progress toward maximum employment and the improvement in the outlook for labor market conditions since the inception of the current asset purchase program, the Committee decided to make a further measured reduction in the pace of its asset purchases.

Beginning in April, the Committee will add to its holdings of agency mortgage-backed securities at a pace of $25 billion per month rather than $30 billion per month, and will add to its holdings of longer-term Treasury securities at a pace of $30 billion per month rather than $35 billion per month. The Committee is maintaining its existing policy of reinvesting principal payments from its holdings of agency debt and agency mortgage-backed securities in agency mortgage-backed securities and of rolling over maturing Treasury securities at auction. The Committee's sizable and still-increasing holdings of longer-term securities should maintain downward pressure on longer-term interest rates, support mortgage markets, and help to make broader financial conditions more accommodative, which in turn should promote a stronger economic recovery and help to ensure that inflation, over time, is at the rate most consistent with the Committee's dual mandate.

The Committee will closely monitor incoming information on economic and financial developments in coming months and will continue its purchases of Treasury and agency mortgage-backed securities, and employ its other policy tools as appropriate, until the outlook for the labor market has improved substantially in a context of price stability. If incoming information broadly supports the Committee's expectation of ongoing improvement in labor market conditions and inflation moving back toward its longer-run objective, the Committee will likely reduce the pace of asset purchases in further measured steps at future meetings. However, asset purchases are not on a preset course, and the Committee's decisions about their pace will remain contingent on the Committee's outlook for the labor market and inflation as well as its assessment of the likely efficacy and costs of such purchases.

To support continued progress toward maximum employment and price stability, the Committee today reaffirmed its view that a highly accommodative stance of monetary policy remains appropriate. In determining how long to maintain the current 0 to 1/4 percent target range for the federal funds rate, the Committee will assess progress--both realized and expected--toward its objectives of maximum employment and 2 percent inflation. This assessment will take into account a wide range of information, including measures of labor market conditions, indicators of inflation pressures and inflation expectations, and readings on financial developments.

The Committee continues to anticipate, based on its assessment of these factors, that it likely will be appropriate to maintain the current target range for the federal funds rate for a considerable time after the asset purchase program ends, especially if projected inflation continues to run below the Committee's 2 percent longer-run goal, and provided that longer-term inflation expectations remain well anchored.

When the Committee decides to begin to remove policy accommodation, it will take a balanced approach consistent with its longer-run goals of maximum employment and inflation of 2 percent. The Committee currently anticipates that, even after employment and inflation are near mandate-consistent levels, economic conditions may, for some time, warrant keeping the target federal funds rate below levels the Committee views as normal in the longer run.

With the unemployment rate nearing 6-1/2 percent, the Committee has updated its forward guidance. The change in the Committee's guidance does not indicate any change in the Committee's policy intentions as set forth in its recent statements.

Voting for the FOMC monetary policy action were: Janet L. Yellen, Chair; William C. Dudley, Vice Chairman; Richard W. Fisher; Sandra Pianalto; Charles I. Plosser; Jerome H. Powell; Jeremy C. Stein; and Daniel K. Tarullo.

Voting against the action was Narayana Kocherlakota, who supported the sixth paragraph, but believed the fifth paragraph weakens the credibility of the Committee's commitment to return inflation to the 2 percent target from below and fosters policy uncertainty that hinders economic activity.

See the original article >>

There is no plot for Je Ne Sais Quoi

by Marketanthropology

Over the past month since the 1929 analog made the rounds on the likes of daytime television, we've been asked by several readers for our opinion or rebuttal of the broader criticism levied against comparative analysis. The main reasons we've kept our thoughts to ourselves was - a.) it wasn't our work;  and b.) we didn't share the sentiment expressed in the comparison. To be honest though, we don't really spend much time focusing on what the skeptics and pundits think, because their opinions are often made before you can even try to open their eyes to another perspective. Ironically, it's their own cognitive biases - based on their previous experience with other comparative "research", that leads them to form an opinion the second they see two asset trends overlaid on one another.
Does it frustrate us at times when an ignorance is more broadly slandered? Definitely. But if there's one thing that Wall Street projects in its echo chamber, is ego and the notion that if you don't practice at the alter with certain conventions - you're a heretic (we prefer mystic). Moreover, if its not strictly empirical or presented on a scatter plot, it's quickly deemed spurious by the high priests in finance. What do you think this is a social science? Conversely, we actively use correlation and regression analysis in determining different asset relationships that can lead to a better understanding of a market. However, just as any self-respecting artist doesn't paint by numbers, for appraising the more qualitative essence of a market - there is no scatter plot for je ne sais quoi
In the past three years since first creating Market Anthropology in March 2011, we have strived at presenting both compelling and accurate market research by incorporating our unique blend of comparative perspectives into our work. What has been the unifying constant between these different and varying timeframes, scales, periods and assets? The refrained observation that our invariant behavior in the market does not change much despite the asset class, scale or time period. We have found repeatedly that our reflexes and emotionalities are remarkably self similar and scale invariant. With that said, if it's a Rembrandt you seek, you will not find it hung on these walls. We practice impressionism. I.e. we don't day trade.
We approach comparative analysis from a different point of view than most. We typically do not start our work from correlations in price, rather triangulate a market through several different perspectives - such as momentum, intermarket relationships and historic asset trends. Like most methodologies applied in the behavioral sciences, it is a moving target with an ever shifting backdrop to appraise. We view markets through a qualitative lens that reflects on both the quantitative framework many participants perceive and the physical reflection of underlying market psychology.
We form perspectives based on the belief that although the markets on a day-to-day basis may flutter with all the uniqueness of a random walk, over time will tend to conform to a collective market psychology that travels a rather defined behavioral continuum - irrationality included.
Is it the holy grail or the Rosetta Stone to unlocking the market? Certainly not. Anyone that actively participates is bound to be offsides, downed and tackled throughout the game. But applied with a balanced perspective and qualitative rigor, the methodology can provide a greater depth of view that has helped us remain on the right side of many different markets through the years. Stepping off the soap box, precious metals are presenting an interesting juxtaposition sailing through another Fed decision this afternoon. The retracement window we had thought could open this week - has obliged,  and we expect it should be closing going into the next.


To accomodate for the greater nuances provided by the 60 minute series, we normalized current positions to the momentum profile of the historic Nasdaq chart. Often times, and a function of being scale invariant comparisons, we will estimate a bearing and work with the current market as it navigates a prospective pivot on the profile. More critical for us in the series is the impression of the pivot as reflected and contrasted in their respective momentum signatures.

For further information regarding our thoughts on precious metals, see:

Back to the Bull Market Highway for Silver & Gold 

Still Waters Run Deep
Mining for Gold
Esoterica

See the original article >>

Euro and Gold create “Bearish Engulfing patterns!”

by Chris Kimble

CLICK ON CHART TO ENLARGE

The Euro and Gold look to be creating "Engulfing Bearish" patterns this week at falling channel resistance. Many use these assets to help them with portfolio construction and to judge macro conditions around the world.

See the original article >>

The Russian Godfather

by Adam Michnik

WARSAW – Russian President Vladimir Putin is behaving like a Mafia boss. In invading, occupying, and finally annexing Crimea, he pointed Russia’s guns at Ukraine and said: your territorial sovereignty or your life. So far, extortion has worked – and Putin knows it.

Indeed, in his speech announcing the annexation of Crimea, Putin spoke his mind: his regime fears no punishment and will do whatever it pleases. Crimea is just the first step toward realizing his dream of revived Russian greatness.

His address in the Kremlin was a tissue of lies and manipulation, though a subtle analysis would be a waste of time. The simple fact is that the president of one of the world’s most powerful countries has embarked on a path of confrontation with the entire international community. His speech smacked of the fevered, paranoid world of Fyodor Dostoyevsky’s Demons, conjuring as it did a delusional alternative universe – a place that does not exist and has never existed.

What does Kosovo, where the Albanians suffered persecution and ethnic cleansing, have in common with the situation in Crimea, whose people have never been oppressed by Ukrainians? What is the point in displaying open contempt for Ukraine’s government, parliament, and people? Why label Ukrainian authorities “fascist and anti-Semitic”? Crimean Tatars pay no heed to the fairy tales about fascists ruling Ukraine; they can still remember the brutal and murderous mass deportations of their parents and grandparents, ordered by Stalin and carried out by the NKVD.

In Putin’s mind, the whole world has discriminated against Russia for the last three centuries. Russia’s bloody despots – Catherine II, Nicholas I, or Stalin – apparently never discriminated against anyone.

Putin also warns that “you and we – the Russians and the Ukrainians – could lose Crimea completely.” Yet he fails to specify who – perhaps Poles and Lithuanians again? – are setting their sights on Sevastopol.

Russia could not, according to Putin, leave the people of Crimea “alone in their predicament.” These words prompt a sad smile; Leonid Brezhnev used precisely the same phrase in August 1968 to justify the Red Army’s intervention in Czechoslovakia to help beleaguered Communist hardliners there crush the Prague Spring reform movement.

“We want Ukraine to be a strong, sovereign, and independent country,” says Putin. Stalin said the same thing about Poland in 1945. Brave Russian democrats who have not yet been silenced have already remarked on the similarity between Putin’s appeal to ethnic solidarity in annexing Crimea and Hitler’s stance during the Anschluss and the Sudeten crisis in 1938.

This is the real end of history – the history of dreams about a world governed by democratic values and the market economy. Unless the democratic world understands that now is not the time for faith in diplomatic compromise, and that it must respond strongly enough to stop Putin’s imperial designs, events could follow a logic that is too dreadful to contemplate. It takes force to stop a thug, not sharp words or cosmetic sanctions.

I commend and take pride in Poland’s prudent and determined policy and the attitude of its public, which do us great credit. But we must recognize that the best quarter-century in the last 400 years of Polish history is about to end before our very eyes. A time of tectonic shifts has begun. We must appreciate what we have managed to achieve – and learn to protect it.

Mafia bosses often meet an unhappy fate, and I do not think that Putin will fare much better in the end. Unfortunately, many people are likely to be hurt in the meantime, not least those who now support him.

See the original article >>

U.S. Debt Crisis Is Coming With or Without China

By Gail Tverberg

Credit Problems are a Very Current Issue


In the past several years, the engine of world’s growth has been China. China’s growth has been fueled by debt. China now seems to be running into difficulties with its industrial growth, and its difficulty with industrial growth indirectly leads to debt problems. A Platt’s video talks about China’s demand for oil increasing by only 2.5% in 2013, but this increase being driven by rising gasoline demand. Diesel use, which tracks with industrial use, seems to be approximately flat.

The UK Telegraph reports, “Markets hold breath as China’s shadow banking grinds to a halt.” According to that article,

A slew of shockingly weak data from China and Japan has led to a sharp sell-off in Asian stock markets and the biggest one-day crash in iron ore prices since the Lehman crisis, calling into question the strength of the global recovery.
The Shanghai Composite index of stocks fell below the key level of 2,000 after investors reacted with shock to an 18pc slump in Chinese exports in February and to signs that credit is wilting again. Iron ore fell 8.3pc.
Fresh loans in China’s shadow banking system evaporated to almost nothing from $160bn in January, suggesting the clampdown on the $8 trillion sector is biting hard.

Many recent reports have talked about the huge growth in China’s debt in recent years, much of it outside usual banking channels. One such report is this video called How China Fooled the World with Robert Peston.

Why Promises (and Debt) are Critical to the Economy


Without promises, it is hard to get anyone to do anything that they really don’t want to do. Think about training your dog. The way you usually do this training is with “doggie treats” to reward good behavior. Rewards for desired behavior are equally critical to the economy. An employer pays wages to an employee (a promise of pay for work performed).

It is possible to build a house or a store, stick by stick, as a person accumulates enough funds from other endeavors, but the process is very slow. Usually, if this approach is used, those building homes or stores will provide all of the labor themselves, to try to match outgo with income. If debt were used, it might be possible to use skilled craftsmen. It might even be possible to take advantage of economies of scale and build several homes together in the same neighborhood, and sell them to individuals who could buy the homes using debt.

Adding debt has many advantages to an economy. With debt, a person can buy a new car or house without needing to save up funds. These purchases lead to additional workers being employed in building these new cars and homes, adding jobs. The value of existing homes tends to rise, if other people are available to afford them, thanks to cheap debt availability. Rising home prices allow citizens to take out home equity loans and buy something else, adding further possibility of more jobs. Availability of cheap debt also tends to make business activity that would otherwise be barely profitable, more profitable, encouraging more investment. GDP measures business activity, not whether the activity is paid for with debt, so rising debt levels tend to lead to more GDP.

Webs of Promises and Debt


As economies expand, they add more and more promises, and more and more formal debt. In high tech industries, supply lines using materials from around the world are needed. The promise made, formally or informally, is that if more of a supply is needed, it will be available, at the same or a similar price, in the quantity needed and in the timeframe needed. In order for this to happen, each supplier needs to have made many promises to many employees and many suppliers, so as to meet its commitments.

Governments are part of this web of promises and debt. Some of the promises made by governments constitute formal debt; some of the promises are guarantees relating to debt of other parties (such as nuclear power plants), or of the finances of banks or pensions plans. Some of a government’s promises are only implied promises, yet people depend on these implied promises. For example, there is an expectation that the government will continue to provide paved roads, and that it will continue to provide programs such as Social Security and Medicare. Because of the latter programs, citizens assume that they don’t need to save very much or have many children–the government will provide funding sufficient for their basic needs in later years, without additional action on their part.

What is the Limit to Debt?

While our system of debt has gone on for a very long time, we can’t expect it to continue in its current form forever. One thing that we don’t often think about is that our system or promises isn’t really backed by the way natural system we live in works. Our system of promises has a hidden agenda of growth. Nature doesn’t  have a similar agenda of growth. In the natural order, the amount of fresh water stays pretty much the same. In fact, aquifers may deplete if we over-use them. The amount of topsoil stays pretty much the same, unless we damage it or make it subject to erosion. The amount of wood available stays pretty constant, unless we over-use it.

Nature, instead of having an agenda of growth, operates with an agenda of diminishing returns with respect to many types of resources. As we attempt to produce more of a resource, the cost tends to rise. For example, we can extract more fresh water, if we will go to the expense of drilling deeper wells or using desalination, either of which is more expensive. We can extract more metals, if we use as our source lower grade ores, perhaps with more surface material covering the ore. We can get extract more oil, if we will go to the expense of digging deeper wells is less hospitable parts of the world. We can even use substitution, but that will likely be more expensive yet.

A major issue that most economists have missed is the fact that wages don’t rise in response to this higher cost of resource extraction. (I have shown a chart illustrating that this is true for oil prices.) If the higher cost simply arises from the fact that nature is putting more obstacles in our way, we end up spending more for, say, desalinated water than water from a local well, or more for gasoline than previously. Much of the cost goes into fuel that is burned, or building special purpose equipment (such as a desalination plant or offshore drilling rigs) that will degrade over time. Our system is, in effect, becoming less and less efficient, as it takes more resources and more of people’s time, to produce the same end product, measured in terms of barrels of oil or gallons of water. Even if there are additional salaries, they are often in a different country, around the globe.

At some point, the amount of products we can actually produce starts shrinking, because workers cannot afford the ever-more-expensive products or because some essential “ingredient” (such as fresh water, or oil, or an imported metal) is not available. Since we live in a finite world, we know that at some point such a situation must occur, even if  the shrinkage isn’t as soon as I show it in Figure 2 below.

Figure 1. Author's image of an expanding economy.
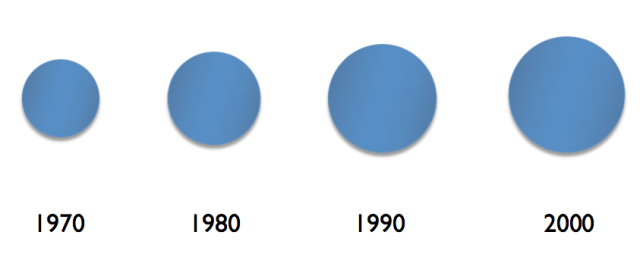
Figure 1. Author’s image of an expanding economy.

Figure 2. Author's image of declining economy.
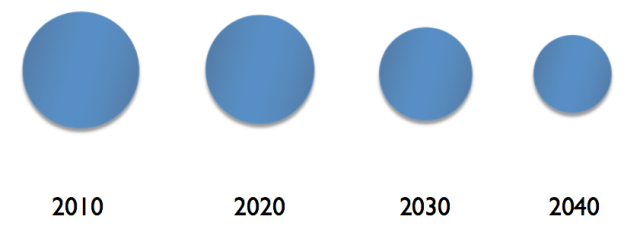
Figure 2. Author’s image of declining economy.

The “catch” with debt is that we are in effect borrowing from the future. It is much easier to pay back debt with interest when the economy is growing than when the economy is shrinking.  When the economy is shrinking, there is less in the future to begin with. Repaying debt from this shrinking amount becomes a problem. Even promises that aren’t formally debt, such as most Social Security payments, Medicare, and future road maintenance become a problem. With fewer goods available in total, citizens on average become poorer.

Governments depend on tax revenue from citizens, so they become poorer as well–perhaps even more quickly than the individual citizens who live in their country. It is in situations like this that richer parts of countries decide to secede, leading to country break-ups. Or the central government may fail, as in the Former Soviet Union.

Which Promises are Least Affected?


Some promises are very close in time; others involve many years of delay. For example, if I bring food I grew to a farmers’ market, and the operator of the market gives me credit that allows me to take home some other goods that someone else has brought, there are some aspects of credit involved, but it is very short term credit. I am being allowed to “run a tab” with credit for things I brought, and this payment is being used to purchase other goods, or perhaps even services. Perhaps someone else would offer some of their labor in putting together the farmers’ market, or in working in a garden, in return for getting some of the produce.

As I see it, such short term promises are not really a problem. Such credit arrangements have been used for thousands of years (Graeber, 2012). They don’t depend on long supply lines, around the world, that are subject to disruption. They also don’t depend on future events–for example, they don’t depend on buyers being available to purchase goods from a factory five or ten years from now. Thus, local supply chains among people in close proximity seem likely to be available for the long term.

Long-Term Debt is Harder to Maintain


Debt which is long-term in nature, or provides promises extending into the future (even if they aren’t formally debt) are much harder to maintain. For example, if governments are poorer, they may need to cut back on programs citizens expect, such as paving roads, and funding for Social Security and Medicare.

Governments and economies are already being affected by the difficulty in maintaining long term debt. This is a big reasons why Quantitative Easing (QE) is being used to keep interest rates artificially low in the United States, Europe (including the UK and Switzerland), and Japan. If interest rates should rise, it seems likely that there would be far more defaults on bonds, and far more programs would need to be cut. Even with these measures, some borrowers near the bottom are already being adversely affected–for example, subprime loans were problems during the Great Recession. Also, many of the poorer countries, for example, Greece, Egypt, and the Ukraine, are already having debt problems.

Indirect Casualties of the Long-Term Debt Implosion


The problem with debt defaults is that they tend to spread. If one major country has difficulty, banks of  many other countries are likely be to affected, because many banks will hold the debt of the defaulting country. (This may not be as true with China, but there are no doubt indirect links to other economies.) Banks are thinly capitalized. If a government tries to prop up the banks in its country, it is likely to be drawn into the debt default mess. Insurance companies and pension plans may also be affected by the debt defaults.

In such a situation of debt defaults spreading from country to country, interest rates can be expected to shift suddenly, causing financial difficulty for those issuing derivatives. There may also be liquidity problems in dealing with these sudden changes. As a result, banks issuing derivatives may need to be bailed out.

There may also be a sudden loss of credit availability, or much higher interest rates, as banks issuing loans become more cautious. In fact, if problems are severe enough, some banks may be closed altogether.

With less credit available, prices of commodities can be expected to drop dramatically. For example, during the credit crisis in the second half of 2008, oil prices dropped to the low $30s per barrel. It was not until after  QE was started in November 2008 that oil prices started to rise again. This time, central banks are already using QE to try to fix the situation. It is not clear that they can do much more, so the situation would seem to have the potential to spiral out of control.

Without credit availability, the prices of most stocks are likely to drop dramatically. In part, this is because without credit availability, it is not clear that the companies listed in the stock market can actually produce very much. Even if the particular company does not need credit, it is likely that some of the businesses on which it depends for supplies will have credit problems, and not be able to provide needed supplies. Also, with less credit availability, potential buyers of shares of stock may not be about to get the credit they need to purchase shares of stock. As a result of the credit problems in 2008, the Dow Jones Industrial Average dropped to $6,547 on March 9, 2009.

Furthermore, lack of credit availability tends to lead to low selling prices for commodities, making production of these commodities unprofitable. Production of these commodities may not drop off immediately, but will in time unless the credit situation is quickly turned around.

Can’t governments simply declare a debt jubilee for all debt, and start over again?


Not that I can see. Declaring a debt jubilee is, in effect, saying, “We have decided to renege on our past promises. In fact, we are letting others renege on their promises as well.” This means that insurance companies, pension plans, and banks will all be in very poor financial situation. Many who depend on pensions will find their monthly checks cut off as well. In fact, businesses without credit availability are likely to lay off workers.

If it is possible to start over, it will need to be on a much more restricted basis. Everyone will be poorer, so there won’t be much of a market for expensive new cars and homes. Instead, most demand will be for will be the basics–food, water, clothing, and fuel for heat. Unfortunately, it is doubtful that prices will be high enough, or the chains of supply robust enough, to again produce fossil fuels in quantity. Without fossil fuels, what we think of as renewables will disappear from availability quickly as well. For example, hydroelectric, wind and solar PV all work as parts of a system. If the billing system is unavailable because banks are closed, or if the transmission system is in need of repair because lines are down and the diesel fuel needed to make repairs is unavailable, electricity may not be available.

As indicated above, demand will be primarily for basics such as food, water, clothing, and fuel for cooking and heating. It will still be possible to use local supply chains, even if long distance supply chains don’t really work well. The challenge will be trying to shift modes of production to new approaches in which goods can be made locally. A major challenge will be training potential farmers, getting needed equipment for them, and transferring land ownership in ways that will allow food to be produced in ways that do not depend on fossil fuels.

Belief in credit will be severely damaged by a debt jubilee. The place where credit will be easy to reestablish will be in places where everyone knows everyone else, and supply lines are short. Debt will mostly be of the nature of “running a tab” when one type of good is exchanged for another. Over time, there may be some long-term trade re-established, but it is likely to be much more limited in scope than what we know today.

Conclusion


Long-term debt tends to work much better in a period of economic growth, than in a period of contraction. Reinhart and Rogoff unexpectedly discovered this point in their 2008 paper “This Time is Different: A Panoramic View of Eight Centuries of Financial Crises.” They remark “It is notable that the non-defaulters, by and large, are all hugely successful growth stories.”

Slowing growth in China is likely to mean that world economic growth is slowing. This will add to stresses, making failure of the system more likely than it otherwise would be. We can cross our fingers and hope that Janet Yellen and other central bankers can figure out yet other ways to keep the system together for a while longer.

See the original article >>

S&P 500 fell over 30% last two times the Nikkei did this…

by Chris Kimble

CLICK ON CHART TO ENLARGE

The Nikkei was a leader to the downside in 2000 & 2007.  The Power of the Pattern suggests to pay close attention to the Nikkei in the weeks ahead!

See the original article >>

Control your risk with simple and winning rules - Free Trading Alert For 21 March


Super Stocks strategy

Latest Free Trading Alerts for 21 March

 
Open position value at 20 March $ 12,667.64 2014 P/L   +1.10%
 
Super stocks Report for 21 March

Dowload Trading Report


Mixed long/short open position
Today no new entry orders
We stopped at breakeven on V 
7 Open Positions 
3 Long
4 Short 
4 with Stop Loss at breakeven

We are happy to offer free signal service for Super Stocks until the end of March


Please send me your email address so I can invite you on my server to do the demo. Mail me to take the offer and start the free service until the end of March michele.giardina@quantusnews.com


Material in this post does not constitute investment advice or a recommendation and do not constitute solicitation to public savings. Operate with any financial instrument is safe, even higher if working on derivatives. Be sure to operate only with capital that you can lose. Past performance of the methods described on this blog do not constitute any guarantee for future earnings. The reader should be held responsible for the risks of their investments and for making use of the information contained in the pages of this blog. Trading Weeks should not be considered in any way responsible for any financial losses suffered by the user of the information contained on this blog.

21 Billion Global Trades

by Attain Capital

We’re almost a quarter of the way through 2014, and the folks at the FIA (Futures Industry Association) have finished crunching the numbers on just how many trades there were across all derivative exchanges last year in releasing its annual survey, and the numbers – as always – are eye-popping; with over 21 BILLION futures and options trades done last year across the globe.

That’s up a slight 2.1% after a decline of 15% in 2012, and nearly four times higher than 10 years ago – but still well below the record number of futures and options contracts traded back in 2011:

“According to statistics gathered by FIA from 84 exchanges worldwide, 21.64 billion futures and options contracts were traded in 2013, an increase of 2.1% from the previous year, but still well below the number of contracts traded in 2012 and 2011.”

Futures and Options Futures 2013(Disclaimer: Past performance is not necessarily indicative of future results)
Chart Courtesy: FIA

Now here’s where things get tricky for those of us dealing with exchange traded futures and options on futures in the US; as a huge portion of this overall volume comes from stock options. When you pull those out of the equation, and look at just the trades us futures folks are involved in day in and day out – we can see futures trading was actually up 10%, while Options Trading was down -6.8%.

Futures vs Options(Disclaimer: Past performance is not necessarily indicative of future results)
Chart Courtesy:FIA

10% more futures trades might not seem like all that much, until you see that’s 1.2 Billion more contracts traded in 2013 – somebody somewhere in the clearing business had a good year! Where’s it coming from?  Asian trading as a whole was down, but Asian stock indices was anything but.

“One of the more interesting trends of the year was the surge in the volume of equity derivatives based on Asian stock indices. For example, greater investor interest in the Japanese stock market led to much heavier trading in futures and options based on the Nikkei 225, the leading index of Japanese stocks.

At the Osaka Securities Exchange, trading in the regular size Nikkei 225 futures and the mini Nikkei 225 futures rose 58.3% and 79.3% to 30.91 million and 233.86 million contracts. At the Singapore Exchange, Nikkei 225 futures rose 39.6% to 39.09 million contracts. At the CME, the yen-dominated Nikkei 225 jumped 105.1% to 11.79 million and the dollar-denominated Nikkei 225 futures jumped 176.9% to 4.68 million contracts.”

Now, we’ve discussed multiple times what exchange (CME vs ICE) holds dominance over each other (here, here, & here), and the CME was able to hold the number one position in contracts traded, despite the ICE’s international push to take over global exchanges, as well as the battle over which Oil contract gets traded more, WTI or Brent.

CME vs ICE

WTI vs. Brent(Disclaimer: Past performance is not necessarily indicative of future results)
Chart Courtesy: FIA

If we’re discussing future contract volume, we can’t omit the most common futures contract, the Eurodollar. It not only keeps its position as #1 in volume, but experienced a 21% growth in just a year.

Eurodollar(Disclaimer: Past performance is not necessarily indicative of future results)
Chart Courtesy: FIA

What’s it all mean… well, for one – that the CME should reconsider the removal of the trader waiver for data fees (you guys seem to be doing alright, leave the small retail trader alone).  But the overall take is that futures markets remain one of the most voluminous trading markets there is – providing that all too important ingredient for the professional who play their trade on the futures markets – liquidity

See the original article >>

Using Your NCAA Bracket to Help Your Investing

by Jeff Miller

Regular readers know that I love using sports to find investment insights. There are three reasons:

  1. Plentiful data – both before the event and afterwards;
  2. Specific odds from prediction markets and pundits – even better than we have in stocks;
  3. The comparison forces investors to abandon market preconceptions, thinking about questions in a different way.

What can we learn from the problem of filling out your NCAA bracket?

The Popular NCAA Upset

Investors who listen to the "bracketology pundits" for a few minutes will find it familiar. There are plenty of buzzwords and opinions, but little supporting data.

One popular theme is that you should search for a good upset in your brackets and the best place to start is when the Regional 5-seed plays the 12-seed. There is some logic here. Let's look at the actual a priori odds for these games, taken from the excellent TeamRankings site:

These are the odds of advancing for each round, so the last column is "winning it all."

5     Oklahoma     West     65.3%     34.1%     10.0%     4.2%     1.4%     0.5%

5     Cincinnati     East     61.5%     26.8%     11.6%     5.7%     2.3%     0.9%

5     Saint Louis     MidW     56.8%     14.4%     4.3%     1.6%     0.5%     0.2%

5     VCU         South     69.9%     37.5%     13.3%     6.4%     3.0%     1.2%

Using these percentages, which have proven accurate over time, what is the chance of all four five seeds wining?

That is an easy probability question. It is the product of the four percentages or about 16%. It would be very surprising if we did not see a 12 seed beat a 5 seed. The problem for figuring out your bracket is simple: Which one?

Investment Application

This same probability blunder is a daily feature in investment commentary. Instead of bogging down in the technical definitions, let me just call this backward reasoning. The pundit starts with a conclusion (like the 12 versus 5) and then grabs any single instance as a likely candidate.

To take one of many current examples, let us consider margin debt and market tops. Investors are bombarded with charts showing the history of market tops at times of high margin debt, implying that this is a high-risk factor. Try putting the question the other way:

In all of the occasions where margin debt reached a peak, what were the investment results? Bespoke Investment Group (via Jeff Saut and Raymond James) provide the results:

Conclusion

The popular margin debt meme is yet another misleading argument, a trap for investors who do not understand how to analyze causality. Here is an investment tip to save money:

See the original article >>

To Eliminate Flight 370 Theories, Start with a Ruler, Pencil and Map

by Charles Hugh Smith

No conventional scenario accounts for the methodical disabling of the communications systems, the bizarre altitude changes and professional navigation to way points, or the presumed turn south and a flight path that extended to at least 8:11 a.m.

UPDATE ON POSSIBLE DEBRIS: the 24-meter (79-feet) object is located far to the south of the search field indicated on the map below. The remote area is known as a floating junkyard, so while this could be yet another false lead, it appears to be the only credible lead at this point: If this is the debris of Malaysia Airlines Flight 370, what happens next?
Every plausible theory about what happened to Flight 370 has to not only fit the most reliable facts (radar tracks and satellite data) but basic geography. A widely circulated scenario proposed by Chris Goodfellow theorizes that a fire (from either a smoldering front tire or electrical fire) filled the cockpit with smoke and caused the pilots to head for the nearest major runway which happened to be to the west on Langkawi.
The reason why the transponder and ACARS systems were deactivated is the pilots pulled all the fuses in an attempt to control the electrical fire.
In Goodfellow's reconstruction, this gallant effort failed and the pilots were overcome by fumes and lost consciousness. The aircraft then flew on the westward heading on autopilot until it ran out of fuel and crashed into the sea.
THis scenario has been critiqued on a number of points: Here's What Pilots Think About The New Idea That The Missing Plane Flew For Hours After A Fire Killed The Pilots documents that full-face oxygen masks were easily accessible, nixing the notion that the pilots could not possibly have had time to radio air traffic control.
A “Startlingly Simple Theory” About the Missing Airliner is Sweeping the Internet. It’s Wrong addresses other problems with the scenario.
I've prepared a map with the "it has to be somewhere along this line" arc based on satellite data and Flight 370's last known west-bound heading. This heading has been confirmed by both Malaysian and Thai military radar.
if the pilots lost consciousness and the aircraft continued west on autopilot, the 777 would have been approaching India before its fuel ran and and it ditched into the sea. This is not even close to the arc traced by the satellite transmission at 8:11 a.m.

The satellite data also conflicts with theories that have Flight 370 being diverted to Diego Garcia, a U.S./British military base 1,200 southwest of Sri Lanka, which is well away from the arc.
The problem is that various pieces of data do not support conventional scenarios based on past losses of commercial airliners. We can start with the fact that the Boeing 777 is one of the safest aircraft in commercial use. The only fatalities occurred quite recently as a result of pilot error.
The fire scenario in which pilots can't find time to radio ATC (air traffic control) but they manage to navigate multiple way points using the flight computer is not plausible. Not only do the masks and the safety record of the 777 make this a stretch (not to mention that a DC-8 is not necessarily a useful analogy to a 777) it's not yet clear (due to conflicting reports) whether the pilots could deactivate the ACARS system from the cockpit; some reports suggest that requires opening a floor compartment in the aisle outside the cockpit.
The methodical disabling of the two separate communications systems is inconsistent with an emergency that allowed the pilots enough time to change course via the flight computer, navigate to way points and change altitude.
The bizarre altitude changes (climbing to 45,000 feet, well beyond the aircraft's designed ceiling and then descending to 23,000 feet, according to Malaysian military radar) and lengthy flight path along navigational way points do not align with the pilot suicide scenario. In the two previous instances of pilot suicide (both denied by the host nations for reasons of face), the suicidal pilot dove the aircraft into the sea early in the flight.
The complex flight path westward does not align with this unless the pilot was aiming to ditch the aircraft beyond the reach of recovery. And if this were the goal, why climb to 45,000 feet and then descend to 23,000?
My pilot sources report that the 777 (along with all other commercial aircraft) are designed to fly within a narrow envelope of efficiency to conserve fuel. It's pushing the envelope hard to take an almost fully loaded airliner above its designed ceiling (around 43,000 feet). What possible motivation could there have been for this action, and the subsequent drop to 23,000 feet?
A struggle with hijackers comes to mind, but there is no solid evidence that any of the passengers or other crew members had the motivation or training to hijack the aircraft and either fly the 777 in the professional manner demonstrated or coerce the pilots to disable the communications systems and proceed west.
The passage over known Malaysian military bases suggests to some observers that the pilots may have been trying to draw a response, i.e. force the Malaysian Air Force to scramble fighters, but this did not happen.
That leaves a struggle between captain and co-pilot as one explanation for the wild changes in altitude, but if that occurred, the rogue pilot retained control and the communication systems remained off.
Since there is no evidence (after 12 days) that Flight 370 headed north and landed or crashed on land, official speculation has turned to the southern arc.
In order to reach the southern reaches of the arc, Flight 370 had to have turned south sometime after Malaysian and Thai military radar lost contact with the 777 around 2:30 a.m. Once again, this decision (the only possible choice left if the northern route has been ruled out) does not align with hijacking aimed at stealing the aircraft or holding the passengers hostage, given the paucity of potential landing sites. And if the presumed hijacking was intended to be an act of terrorism that murdered all 239 people on board, why fly the 777 six hours beyond the point when the presumed hijackers took control of the cockpit?
While it is certainly possible that the pilots were incapacitated by some event after they turned the aircraft south and the 777 flew on autopilot until it crashed somewhere close to this arc, the fact that the aircraft was obviously being piloted up to that turn south only deepens the mystery.
No conventional scenario accounts for the methodical disabling of the communications systems, the bizarre altitude changes and professional navigation to way points, or the presumed turn south and a flight path that extended to at least 8:11 a.m., almost six hours after the aircraft flew beyond the Malaysian military radar's range.
As noted in my previous entries on Flight 370, it is possible that the U.S. Navy's SOSUS (Sound Surveillance System)(Wikipedia) may be active in the region of interest. According to this article on the Sound Surveillance System (SOSUS), an advanced version was put in place in the mid-2000s.

On 26 April 1999 Lockheed Martin Corp., Manassas, Va., was awarded a $107,031,978 firm-fixed-price contract for Phase II of a deep water, undersea surveillance system. This system is a long life, passive acoustic surveillance system that can be configured for multiple mission applications. It has the capability to provide long-term barrier and field acoustic surveillance, long-range acoustic surveillance coverage of open ocean areas, and acoustic surveillance in areas with high ambient noise. This contract contains one option, which, if exercised, would bring the total cumulative value of this contract to $153,234,288.

Although there is no public indication that the SOSUS system detected an acoustic signal that could have been Flight 370 crashing into the sea, we can anticipate that no public announcement would be made. Rather, various naval assets would be directed to search in the appropriate area.
Unfortunately, even if the black box is recovered, we may never know what transpired in the cockpit from 1:00 a.m. on, as the black box only records the previous two hours of cockpit voice data (it records 25 hours of other flight data). If the aircraft was on autopilot those last two hours (or was flown by a silent human pilot), there may well be little record of events in the cockpit prior to the two-hour mark.
It increasingly appears to be a mystery that will never be solved with any certainty.

See the original article >>

US monetary policy moving in the right direction

by SoberLook.com

The Fed struck a somewhat more hawkish tone today - certainly enough to spook the markets. Expectations for the first rate hike have shifted forward by nearly a quarter, pointing to late spring of 2015 as the starting point.

This monetary stance, combined with another $10bn taper was the right move. Here are the reasons:
1. The $10bn cut per meeting removes much of the remaining uncertainty around taper trajectory. The reductions are on autopilot. Often it's not the policy itself but the uncertainty surrounding it that creates issues for the economy. That was one of the key problems with this open-ended QE - the fear of a painful exit put the economy on hold.
2. It is unclear if extremely low rates stimulate credit growth at all, and in fact some argue it could be the opposite. At the same time, savers, including many retirees, have been punished by negative short term real rates for years. This zero rate policy needs to end.
3. The US economy is stronger than is commonly believed. "How dare you say that, you heretic - don't you read all the financial blogs?" That has been the response from many. Perhaps. But it may behoove some folks to pay attention to the data ... More on this later. The point here is that the US economy will be fine without QE and with higher interest rates.
4. The current environment has created such hunger for yield that investors are increasingly taking higher risk in order to target the same performance they experienced in the past. Insurance firms, pensions, individuals - the behavior can be seen in a number of areas. The Fed's exit should help adjust some of the distortions.

See the original article >>

Beef Prices Surge Most In A Decade As Food Inflation Soars

by Tyler Durden

Just a month ago we warned that food inflation was on its way. Today we got the first confirmation that problems are on their way. While headline data washes away the nuance of what eating, sleeping, energy-using human-beings are paying month-in and month-out, the fact, as WSJ reports, that beef prices surged by almost 5% in February - the biggest change since Nov 2003 - means pinching consumers and companies pocketbooks that are still grappling with a sluggish economic recovery. "Things are definitely more expensive," exclaimed on mother of three, "I can't believe how much milk is. Chicken is crazy right now, and beef - I paid $5 a pound for beef!" Just don't tell the Fed!

Via WSJ,

Of course, it's not just beef...

...prices also are higher for fruits, vegetables, sugar and beverages, according to government data. In futures markets, coffee prices have soared so far this year more than 70%, hogs are up 42% on disease concerns and cocoa has climbed 12% on rising demand, particularly from emerging markets.

...

Food prices have gained 2.8%, on average, for the past 10 years, outpacing the increase in prices for all goods, which rose 2.4%, according to the government.

...

Still, the price increases pose a challenge for food makers, restaurants and retailers, which must decide how much of the costs they can pass along and still retain customers at a time of intense competition and thin profit margins. During previous inflationary periods, food makers switched to less-expensive ingredients or reduced package sizes to maintain their profit margins. Retailers and restaurants usually raise prices as a last resort.

...

In California, the biggest U.S. producer of agricultural products, about 95% of the state is suffering from drought conditions, according to data from the U.S. Drought Monitor. This has led to water shortages that are hampering crop and livestock production.

U.S. fresh-vegetable prices that jumped 4.7% last year are forecast to rise as much as 3% this year, while fruit that gained 2% last year will rise up to 3.5% in 2014, according to the USDA.

But, as The Wall Street Journal notes, there are more consequences:

Food-price increases are a particularly touchy issue for emerging markets, where spending on food accounts for a higher share of monthly budgets than in wealthier countries.

In 2008, a spike in food prices caused riots from Haiti to sub-Saharan Africa and South Asia. Three years later, in 2011, rising food prices were a factor behind the Arab Spring protests in North Africa and the Middle East that ultimately toppled governments in Tunisia and Egypt.

The increase in global prices last month surprised some economists, and raised the specter of more severe increases that could hit the world's poorest countries, economists said.

And it's set to get worse:

"To be honest, until a month ago, our feeling and thinking was that most markets were well-supplied," said John Baffes, a senior economist at the World Bank. "Now, the question is: Are those adverse weather conditions going to get worse? If they do, then indeed, we may see more food price increases."

Drought, harsh winter seen fueling higher food prices, Chris Christopher, economist at IHS Global, writes in client note.

Consumers may face “surge ahead”

Just don't tell the Fed - or they mighy just take the punchbowl away...

See the original article >>

Follow Us