Summary
- The last four October crashes - 1907, 1929, 1987 and 2008 have had entirely different origins.
- The current market conditions resemble to a great degree certain aspects preceding the 1907 crash.
- But there is also a great degree of dissimilarity between events today and those preceding those four major shocks.
So, the silly season is upon us... September 4th, and we're swirling towards October, that month of all months... The month characterized by: the Cuban missile crisis in 1962, the fall of the Berlin Wall in 1990. The beheading of Marie Antoinette in 1793. The month that Thomas Edison invented the electric light in 1879. The month that the Battle of Trafalgar began in 1805. Also when the Beatles published their first hit song, "Love Me Do" in 1962. And also four stock market crashes: 1907, 1929, 1987 and 2008. What do these four crashes presage for the month of October 2014?
- The Banking Panic of 1907
The financial crisis of 1907, with some uncanny flash-forwards to 2008, was a banking-cum-stock market crisis. The resolution of this crisis coincided with the ascendance of the New York elite banking interests, focalized on the august presence of Mr. J.P. Morgan, and culminating eventually in the creation of the Federal Reserve System in 1913. The crisis also represented the retrenchment of the populist, inflationary, anti-gold Bryanist forces.
But the immediate cause of the panic was the attempt to corner the copper market in October on the part of Otto Heinze, of the United Copper Company. The failed short squeeze on the shares of this company by Mr. Heinze was financed by the Knickerbocker Trust Company. When this failed, a run on the banks ensued, starting with the Mercantile Bank Company. Both J.P. Morgan and John D. Rockefeller attempted to infuse cash into the New York trusts; nevertheless the banks were unable to finance short-term stock trades. A crash ensued on October 24th.
This is the short story of the panic. In fact, a year prior to the October 1907 panic, the Dow had declined gradually.
Some measure of the panic could be represented by the skew of annual returns the year preceding, and the difference between median and mean returns. Although these measures are interesting in themselves, they need to be compared to the subsequent market crashes.
The closer to zero the skew, the closer to "normality". Similarly, the median represents the exact mid-point of the returns, and in a "well-balanced" distribution, the two parameters should be close.
Accordingly, measuring the skew between October 1906 and September 1907 allows some comparability with the present, as well as an understanding of the behavior of the market. The market lost 159% between October and November 1907. The skew shows that this market was not "normal" in any way.
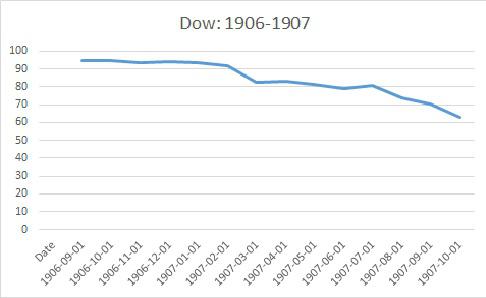
Average returns Oct. 1906-Nov. 1907-43%
Median returns Oct. 1906-Nov. 1907 –27%
Difference between mean and median -16
Maximum drawdown in returns -157
Skew of returns between Oct. 1906 and Nov. 1907 –0.67
Skew of returns between Oct. 1906 and Sep. 1907 –1.02
Source: stlouisfed.org
II. The October 1929 crash
Twenty years thereafter, the October 24, 1929 stock market crash was the culmination of a nine-year bull run in the Dow. While the immediate origins of the 1929 collapse are not a clear-cut as in 1907, suffice it to say the basis was more clearly macroeconomic in nature than the 1907 panic. Most would agree that it represented one of the most traumatic events ever in financial markets. Clearly, the excess speculation prior to the crash is evidenced in the dramatic difference in the skew of returns up until September 1928 and up to and including the crash period. The market lost 260% between October and November 1929.
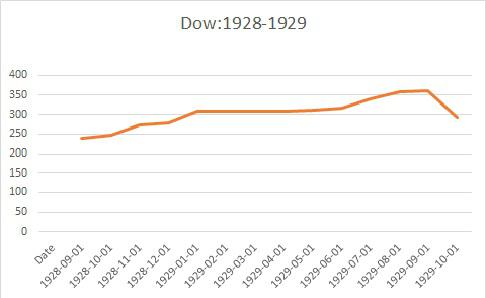
Average returns Oct. 1928-Nov. 1929 1.7%
Median returns Oct. 1928-Nov. 1929 13.5%
Difference between mean and median –11.9
Maximum drawdown in returns -354
Skew of returns Oct. 1928-Nov. 1929 –1.54
Skew of Returns Oct. 1928-Sep. 1929 1
Source: stlouisfed.org
III. The October 1987 crash
The origins of the October 1987 crash were purported to be more institutional in nature: the existence of program trading and arbitrage insurance exacerbated the decline. But the economic backdrop into the preceding rises in the market included the entry of pension funds in a large way. Weakness in the market was precipitated by rising interest rates, the declining dollar and the growing U.S. trade deficit, as well as the excess leveraging, junk bonds and all of the well-known "slap-happy" aspects of the economy of the 1980s. But statistically, the 1987 crash showed some aspects of the 1929 crash, with none of the disastrous post-crash economic consequences, of course. The market lost 96% between October 1987 and November 1987.
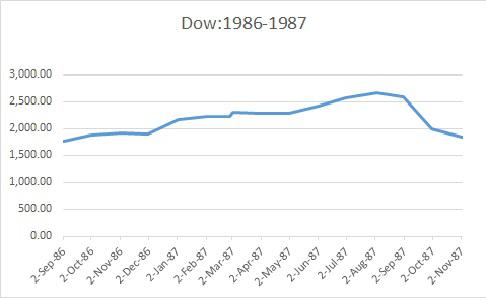
Average returns Oct. 1986-Nov. 1987 7%
Median of returns between Oct. 1986 and Nov. 1987 23%
Difference between mean and median –16
Maximum drawdown in returns between Oct. 1986 and Nov. 1987 -354
Skew of returns between Oct. 1986 and Nov. 1987 –1.67
Skew of returns between Oct. 1986 and Sep. 1987 1.2
Source: finance.yahoo.com
IV. The October 2008 crash
Of course, this is one of the more complicated crises ever to beset the markets. A combination of events occurring in the housing market, a shortfall of market liquidity, over-leveraging in derivatives and collateralized debt obligations, a faltering economy, the bankruptcy of Lehman Brothers, the bailout of AIG, and the ultimate injection of liquidity by the Fed - this is a short course in the staggering events leading to October 2008. The market declined by 63% between October and November 2008. Nevertheless, there are no great differences between the skew including and excluding the crash period. This crash seems to be characterized by a greater degree of "stability", except for the large difference between the mean and median.
Average returns Oct. 2007-Nov. 2008 –37%
Median returns between Oct. 2007 and Nov. 2008 –26%
Difference between mean and median -10
Maximum drawdown of returns -223
Skew of returns between Oct. 2007 and Nov. 2008 –0.84
Skew of returns between Oct. 2007 and Sep. 2008 –0.57
Source: finance.yahoo.com
V. And now?
Markets have been on an upward trend since 2008, with some corrections. But looking at the behavior of the Dow over the past year, in particular the skew of returns, one is reminded strangely of 1907. The reason? The declines of 63% and 19% in January and July of this year. However, for investors relying on history to any extent, the extent of the coherence between the mean and median contradicts the message indicated by the skew. This is a reason to comfort both the optimists and the pessimists. However, geopolitical events might throw a gigantic wrench into this analysis...
Average return between Oct. 2013 and Sep. 2014 12.5%
Median return between Oct. 2013 and Sep. 2014 10%
Difference between the mean and median 2.5%
Maximum drawdown in returns –0.50
Skew of returns between Oct. 2013 and Sep. 2014 –1.3
No comments:
Post a Comment