by Dale Roberts
The market bottoms are when and where the you-know-what hits the fan. All investors approach a massive line with a sign that reads "winners to the right, losers to the left." That sign might also read "buyers to the right, sellers to the left."

Where will you be heading in the next stock market correction? Do you even have a good guess, about what you might do? The most predictive tool might be by asking the question "what did you do in the last correction"? If you panicked and sold some assets, then there's the probability that you might once again panic and sell and create real losses. History has a habit of repeating itself; or as Mark Twain quipped:
History doesn't repeat itself but it does rhyme.
Now history is certainly the best teacher, and perhaps the only teacher that investors pay real attention to. So it is certainly possible that if you panicked and sold, you learned a real tough and expensive lesson in the Great Recession or perhaps in the tech-induced meltdown of 2000-2002.
Those two market corrections were sizeable and a very tough test for investors. Those of us in our 40s and 50s might say that we have had one of the most trying investment periods in history. With the Great Recession, we just went through the most severe market correction since the great depression. And the 2000 correction was perhaps even more severe to those who were overweight to the can't-miss-it's-a-brand-new-world tech darlings. Ha.
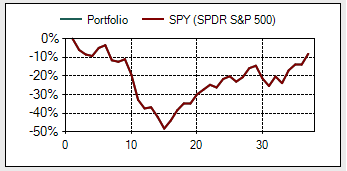
Here's the S&P 500 (NYSEARCA:SPY) from January of 2008 to the end of 2010. All total return calculations are courtesy of low-risk-investing.com and the x axis represents duration in months.
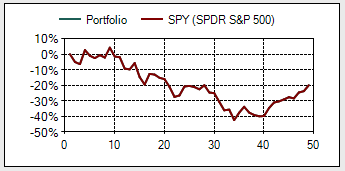
And here's SPY from January of 2000 through to the end of 2003.
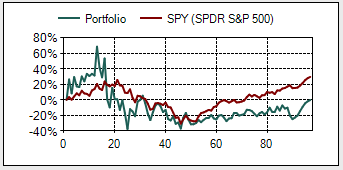
And again those of us who were seduced by the World Wide Web and the new technology and the endless growth potential of all of these companies were introduced to declines that make the S&P 500 look like a kiddie ride. Here is the Nasdaq 100 (NASDAQ:QQQ) vs. SPY from 2000-2003. Yes that's SPY in the red (pun intended) and the Nasdaq having a good look from below.

Full disclosure, I have to admit that my idea of diversification back in 1999 was holding Microsoft (NASDAQ:MSFT), Nortel, Cisco (NASDAQ:CSCO) AND JDS Uniphase (NASDAQ:JDSU). What could go wrong? There is no relevant ticker for Nortel as that company is no more.
I got slaughtered on my tech holdings but I was also very patient as I did have a very high risk tolerance level. I remember holding Microsoft for what felt like forever. I finally sold MSFT and booked a $100 gain, just to say I made money on Microsoft and to be a really stubborn investor. Seven years is a long time to wait to make a few bucks.
Here's Microsoft from January of 1999 to December of 2006. That's MSFT in racing green. Tough lessons indeed.
Those lessons served me well and that created the situation and emotional training where the period heading into, through and out of the Great Recession was our most profitable investing experience. I had generous income at the time, I just kept buying save for a U.S. financial that "had to go." I even took on higher risk assets such as sector funds and small cap. I was into gold as Barrick (NYSE:ABX) was one of my clients, and they told me I should be into gold. I got lucky on that call or suggestion.
It's coming.
The real test for investors will come along again, market corrections always seem to appear to cleanse the market, return valuations to more normalized levels. And along the way the market shakes out the winners and losers; those who move to the right and those who move to the wrong, or left. The corrections separate those who drastically underperform the market, and those who outperform the historical market returns.
As we know, the "average" investor is able to reduce long term 9-10% average annual market gains to 2-3% annual gains. Investors have a habit of buying at or towards the tops of the markets when they feel more comfortable, and then selling at the bottom when they are gripped with fear. As Warren Buffett will tell you, that fear creates a wonderful opportunity for the intelligent investor. There will be investors selling (potentially in a loss position) and there will be buyers picking up the markets and companies at perhaps more attractive long-term valuations.
Decide now if you will be a buyer or a seller. Ask yourself if you can withstand a 20%, 30%, 40%, 50% or 60% decrease in the value of your holdings? Can you stomach your $800,000 portfolio that then shows up on your statement as a $500,000 or $400,000 portfolio? Can you stomach your portfolio reaching a new top and then going under water and staying under water for 2, 3, or 5 years? If any of the above scenarios make you nervous just thinking about the possibility, imagine how it will "FEEL" when those portfolio drops are for real.
If you have never been through a market correction, your guess may not be that accurate - err on the side of caution. You don't know how long you can hold your hand submerged in ice water until you stick your hand in that icy bucket and try to keep it in there for a few minutes. The crippling, cold "feeling" can be a surprising shock.
If you have the suspicion that you might not respond well in a modest to severe market correction, you might consider reducing the risk or volatility of your portfolio. Traditionally, that is created by adding bonds and cash, and perhaps lower volatility stocks or indices. Bonds typically or historically lower the portfolio volatility during a market correction and bonds are typically more stable as they are fixed income instruments, and they also offer the potential to be inversely correlated to stock markets. Ideally, the balanced portfolio sees the bonds go up in price when the stocks go down.
As a general rule of thumb, 70% bond exposure might turn a 50% stock market correction into a 9% or less portfolio draw down. A 40% bond allocation might turn that 50% market correction into a 20% or less portfolio decline. And a 25% bond allocation might turn that 50% market correction into a 35% or less portfolio decline.
In addition to the immediate price (and emotional) hit, there's also the duration of the downturn that can gnaw away at your confidence and investor resilience. This chart from my article, "How Long Can You Afford To Be Under Water?"
Performance returns are from October of 2007 to May of 2014 (the date the article was published). The portfolio consists of the broad market index S&P 500 and the broad bond index (NYSEARCA:AGG). Total return calculations courtesy of low-risk-investing.com.
As we can see a 50% bond allocation can cut the time under water by almost half from 4.5 years to 2.5 years. The cost by way of reduced returns was minimal. And as I wrote in this article, entitled "There's Little Chance of Beating a Balanced Portfolio From Here", it may be likely that once again from today's valuations one can lower the volatility of the portfolio and produce market beating returns over the next several years. There may be little or no cost to creating a lower volatility portfolio in September of 2014.
That lower volatility and less time spent "under water" has the potential to help many investors stay the course and avoid selling equities when they fall precipitously in price. It is my opinion that it is a very small and select group of investors who could hold an all stock portfolio (with meaningful monies) through a severe and lasting market correction of 40% to 50%.
Instead of fearing corrections we should embrace them, welcome them, even hope for them.
Stock market corrections and major declines or bear markets are just a normal and natural and healthy component of investing. They are a cleansing, and they are the greatest opportunity for investors. Don't fear a correction, confidently whisper "bring it on." When the markets fall they are going on sale and you can typically purchase long-term value. Your dollars will buy more purchasing power from the bottoms. When the masses run away from the companies they own, they are typically willing to sell at fire sale prices. Get your wallet ready and line up to the right.
As always if you are dollar cost averaging on a regular schedule, with meaningful monies, carry on. You are on auto pilot that is programmed to buy the markets at, towards, and coming out of the market bottoms.
I would also add that this may be a time to consider international exposure. Many U.S. investors have a home bias (as is the norm for investors on any continent), but it may turn out that international exposure turns out to be the play of the decade. Many U.S. investors suffered the lost decade of the 2000's when very generous gains were available in Canada and around the globe. Let history and experience be your guide there as well. There is also U.S. currency risk to consider.
Happy investing, be careful out there, and always know your risk tolerance level.
No comments:
Post a Comment