Back in June I made the case to be wary of a pullback in the markets this fall (click for article link) based on the increase in inflationary pressures that occurred starting near the beginning of the year. The importance of inflationary trends was laid out in that article with an excerpt provided below for context:
In the past, the Fed raised short-term interest rates to cool the economy and often a recession would ensue, while it lowered them to stimulate the economy back toward growth. However, with the Fed currently committed to keeping rates near zero, changes in the rate of inflation have now become the key variable acting on the business cycle. Like rising interest rates, rising inflation is a bearish force that eats into discretionary spending and corporate profit margins while falling inflation puts money back into consumers' pocket books, boosts corporate profit margins, and helps to stimulate economic growth.
With that in mind, monitoring real-time and lagging inflation indicators is helpful for investors trying to identify or avoid heightened risks of a correction. This was a point I stressed when calling for an intermediate market top and correction in February 2012 (see Countdown to Market Peak Has Begun) based on rising inflationary trends at that time. (Note: the S&P 500 peaked in early April at 1422.38 and then underwent an 11% correction before bottoming at 1266.74 in early June.)
To show how important inflationary trends have been to markets in a zero-interest rate world, take a look at the figure below which shows 10-year breakeven inflation rates and the S&P 500. Whenever breakeven rates moved into the 2.4%-plus range the market has tended to peak (see blue arrows). Since the middle of 2013, breakeven rates have been tame and the S&P 500 has enjoyed a near uninterrupted rally with only minor setbacks.
(click to enlarge)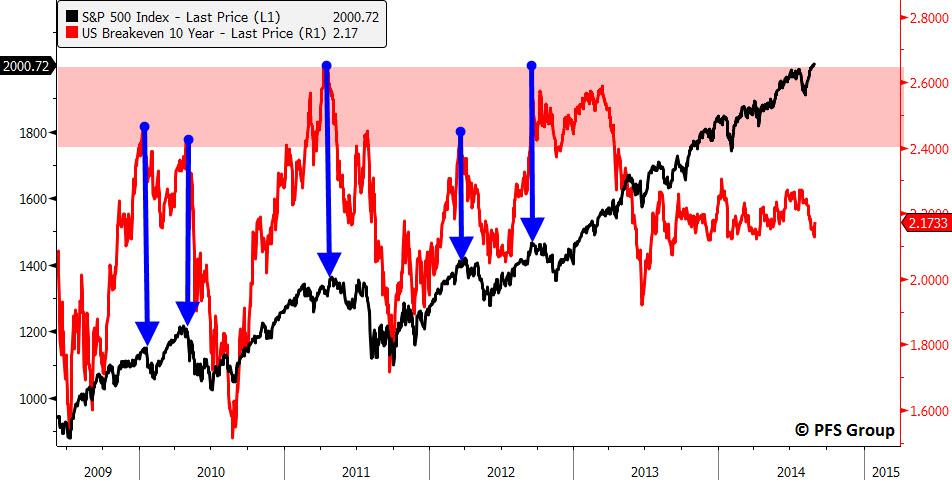
Source: Bloomberg
While breakeven inflation rates do not show any present concern of a pullback as inflation remains anchored, other measures of inflation that rose earlier this year suggest we could see a pause in the US economic growth story. One chart I showed in June was the NFIB Small Business Higher Prices index which is shown below advanced by six months and inverted for directional similarity with the ISM Manufacturing PMI. With the rise in the NFIB price index to the highest level in three years, we are likely to see the ISM PMI peak right here and decline and/or moderate heading into the end of the year.
(click to enlarge)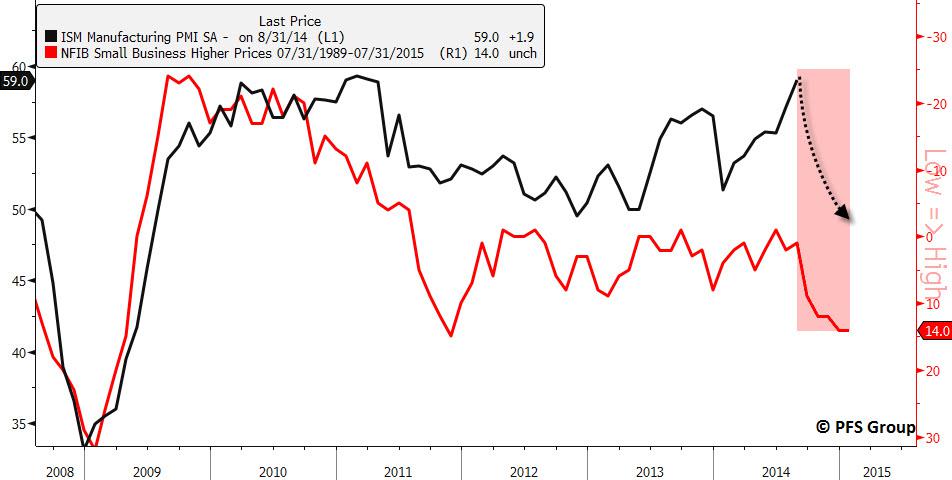
Source: Bloomberg
Back in June I also showed the relationship between the consumer discretionary sector's relative performance to the energy sector and how that led the ISM PMI reading. The outperformance of energy earlier in the year suggested we would eventually see softening in the PMI numbers in the fall. An update shows the ISM should be peaking here and then experience a decline heading into the end of the year.
(click to enlarge)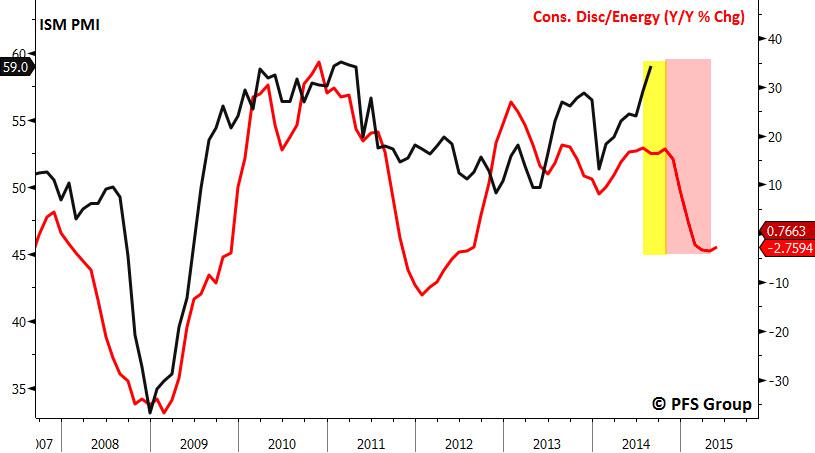
Source: Bloomberg
Given the prior inflationary move seen earlier in the year, it is likely we should expect a moderation in economic momentum that has been building since Q1 of this year. Should growth moderate we are likely to see more economic releases surprise to the downside which should weigh on the markets in the near term. Most market pullbacks since 2009 were associated with excessive economic optimism where the Citigroup Economic Surprise Index was north of 40% (see shaded red region and red circles. We find ourselves again north of 40% on the Citigroup Economic Surprise Index which suggests a little near-term caution. In all likelihood we should see a trading range develop in the weeks ahead as the market digests its recent gains and economic momentum softens.
(click to enlarge)
Source: Bloomberg
While the stock market may stutter in the weeks ahead that shouldn't be cause for concern because the rising inflationary headwind that is going to cause the likely short-lived slowdown ahead will transition to a tailwind. Oil prices have moderated recently and suggests the prices paid inflation component to the various regional Fed manufacturing surveys are likely to come down which would be bullish for economic growth.
(click to enlarge)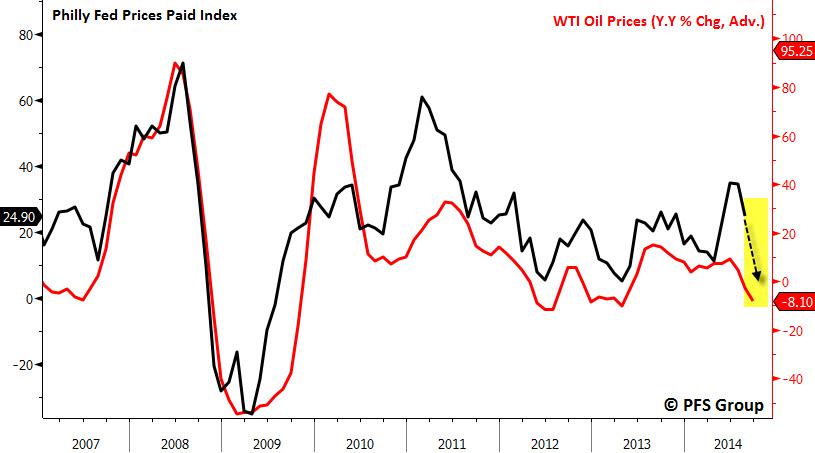
Source: Bloomberg
The monthly changes in the CPI Index also appear to have peaked and will be moving from a headwind to a tailwind ahead.
(click to enlarge)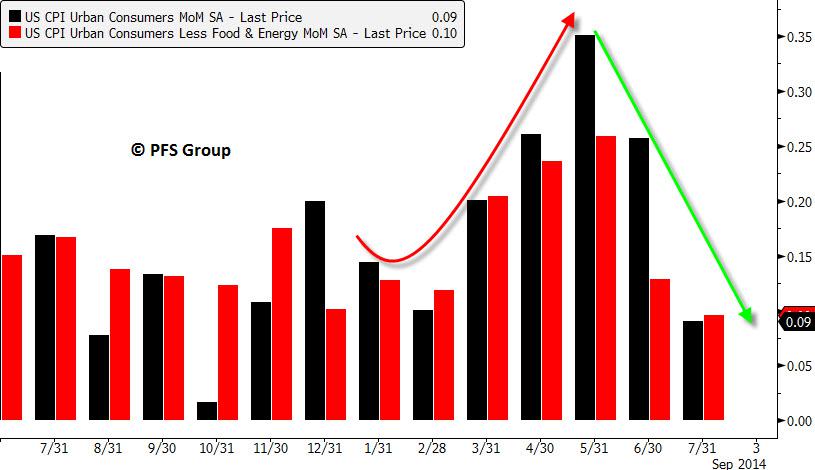
Source: Bloomberg
The recent strength in the USD has sent commodity prices tumbling which also will put downward pressure on the CPI in the coming months. The USD Index is shown below inverted and advanced for directional similarity and suggests the annual CPI inflation rate may dip back toward 1.5% by year end.
(click to enlarge)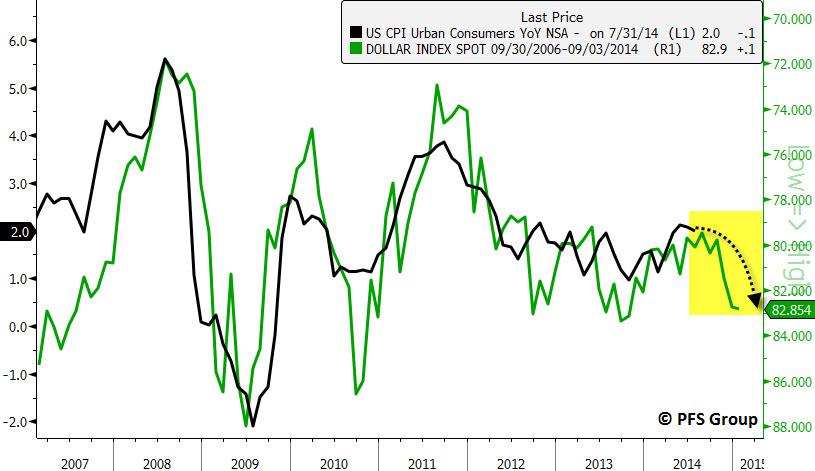
Source: Bloomberg
The decline in commodity prices and surge in the USD indicates inflationary pressures should moderate toward year-end, which should provide another lift to equity markets after a coming bout of softness near-term. When reviewing the economic landscape there simply is no immediate risk of recession as shown by my recession probability model below, which means any weakness ahead should prove as a temporary speed bump in the economic recovery and bull market. This implies both the economy and stock market should enter into their sixth year as neither are likely to peak in 2014.
(click to enlarge)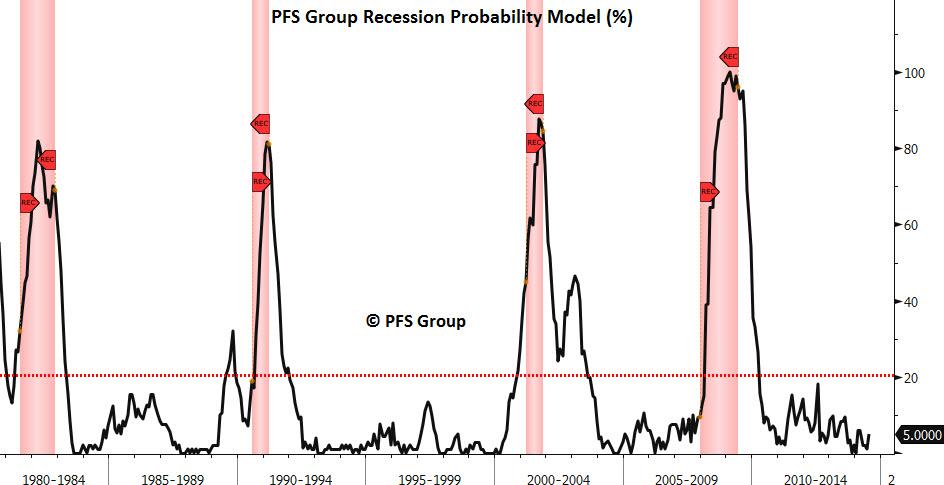
Source: Bloomberg
No comments:
Post a Comment