Fundamentals are always important over the long term. That said, it has become quite clear that company financials are not what’s moving this market. As you’ll see in the following chart, QE has been boosting the S&P 500 since 2009. 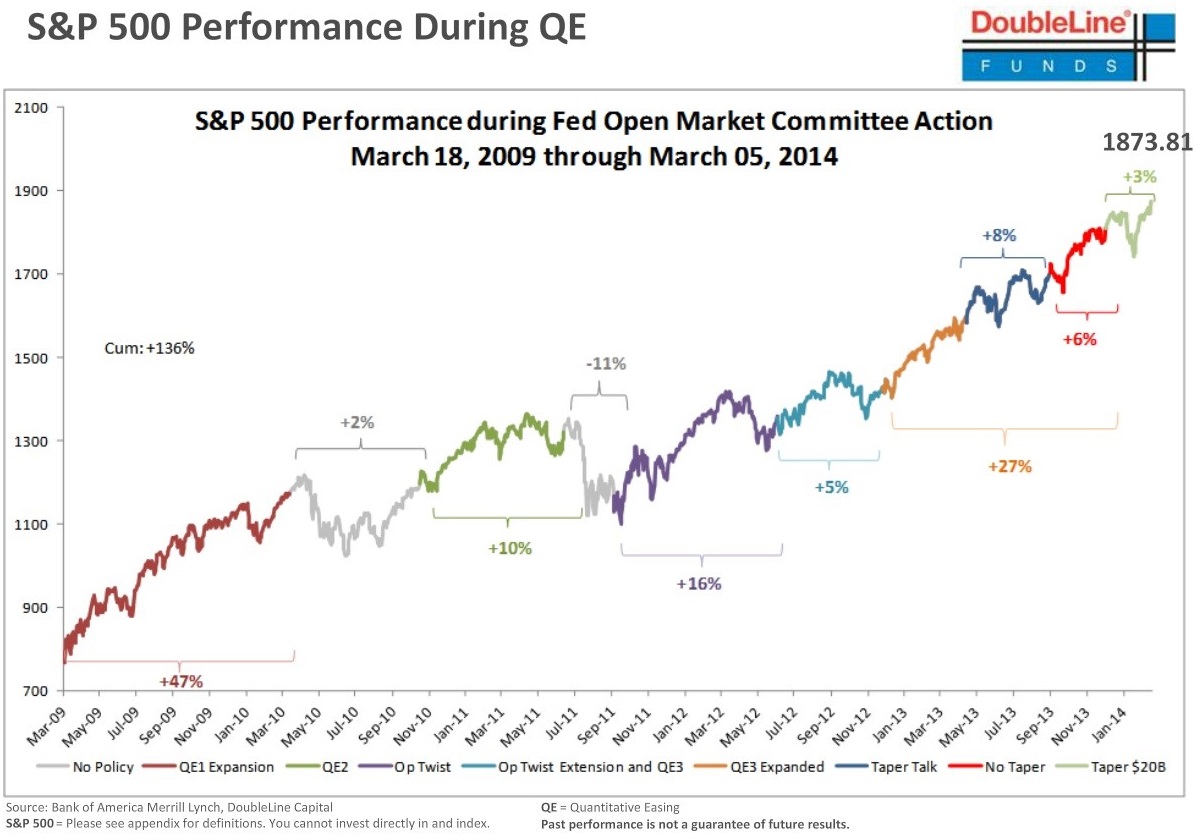 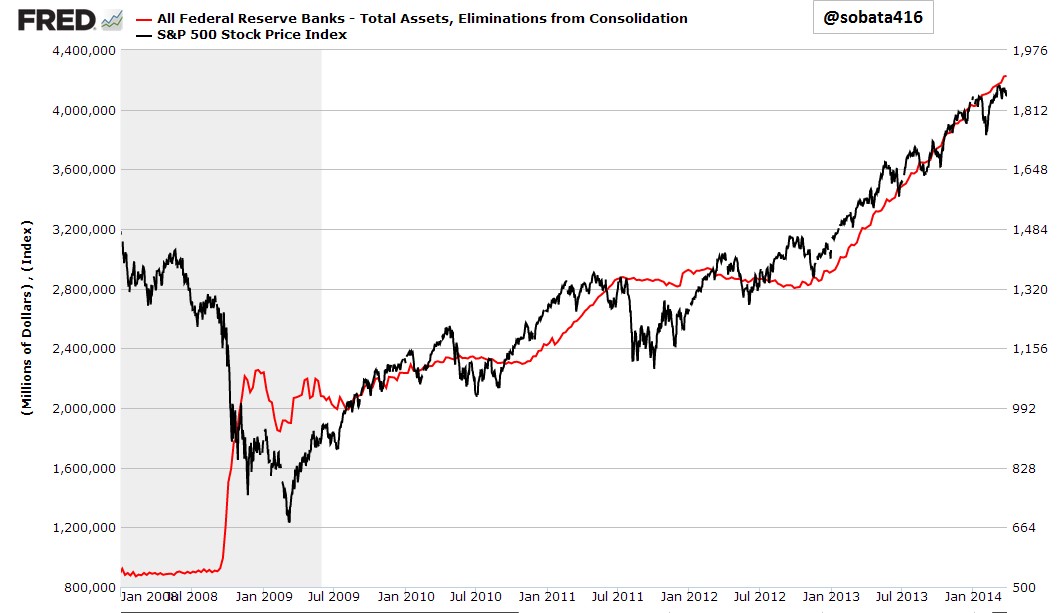   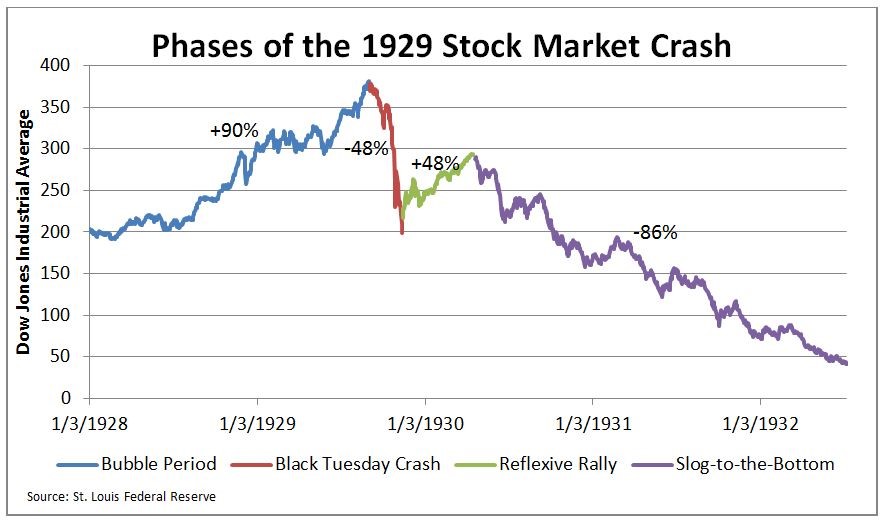  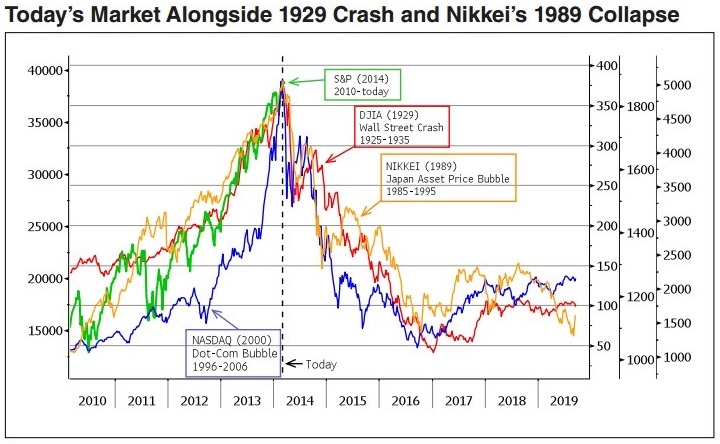 Before we continue let’s talk about the Williams %R Indicator. It is a momentum indicator that is commonly used to indicate overbought or oversold conditions. However, through learning the HPTZ Methodology I have considered another perspective. When the indicator reaches extreme levels (-20/-80) it suggests positive or negative pressure on the market that has been shown to sustain runs or trends. If you examine the writings of Williams he discusses the use of the indicator as overbought or oversold only after an extreme has been reached and after a certain number of bars have passed. First let’s take a look at $LNG. On the monthly chart we can see that Cheniere has been ramping up for a while now. Furthemore, the monthly williams %R has been trending up steadily for years. On the weekly chart the red arrows indicate 4 different slopes. Each new slope is steeper than the last which means that $LNG’s price is increasing at a faster rate. The Williams %R on the weekly is still above -20 which is indicative of positive pressure. 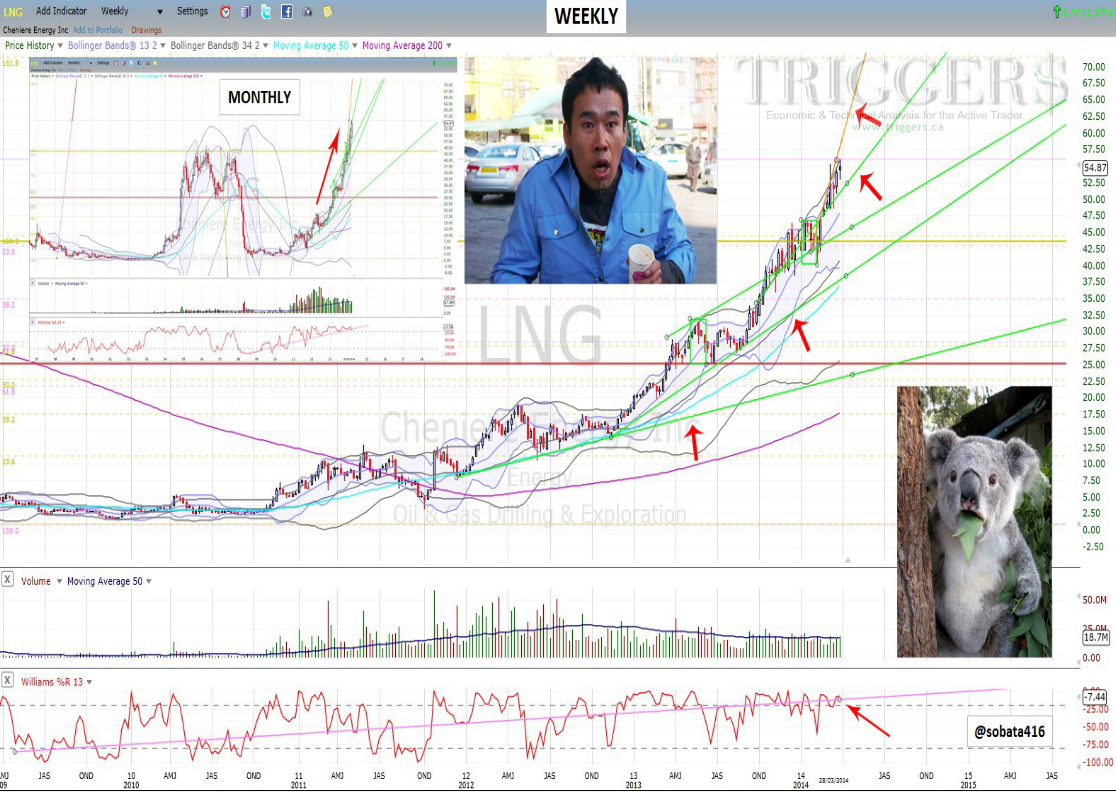 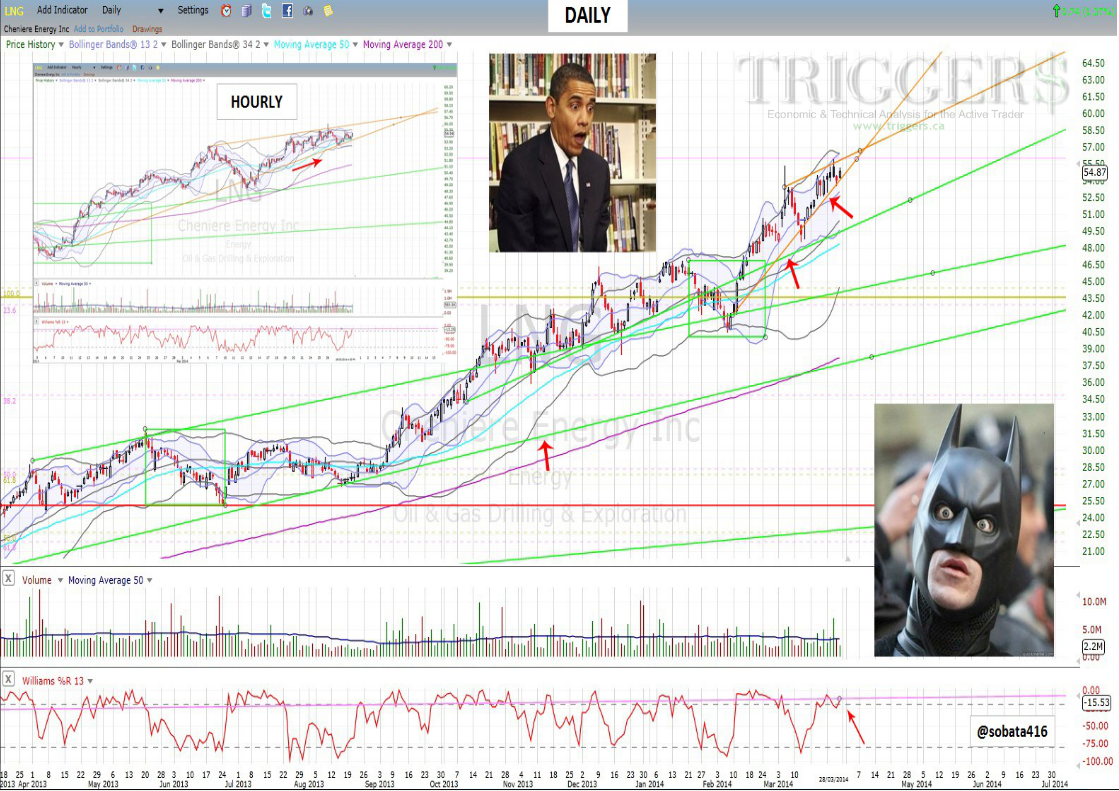 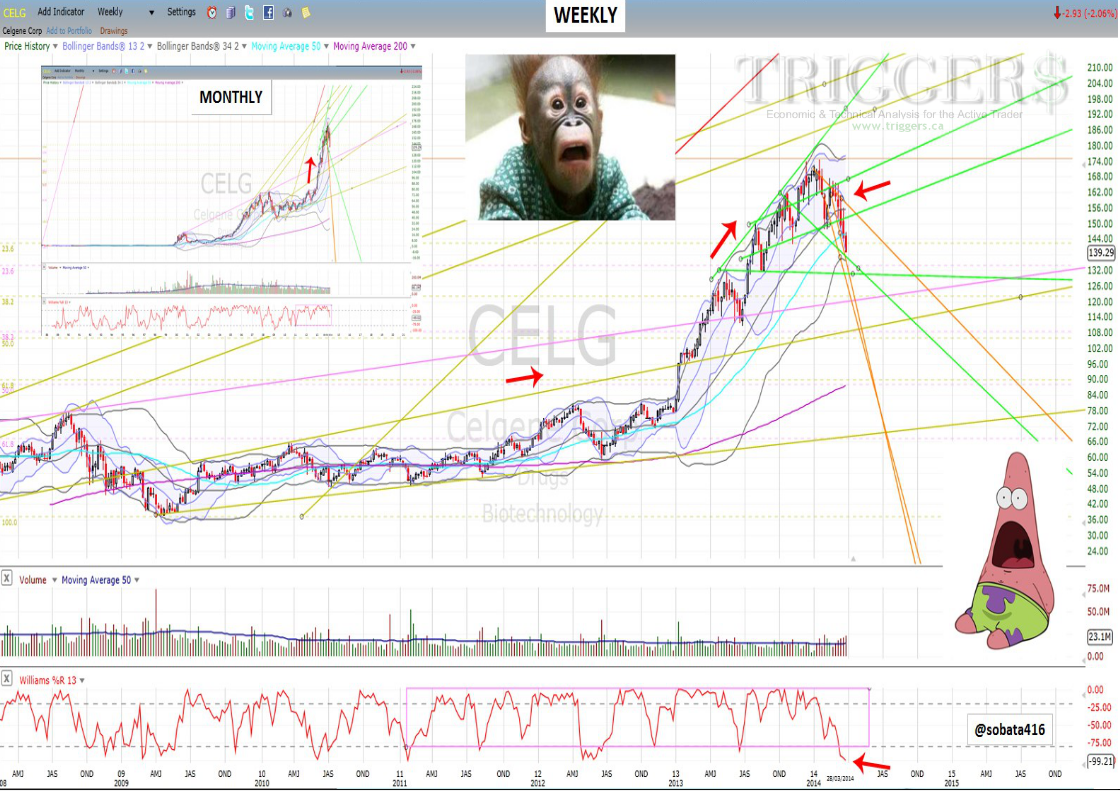 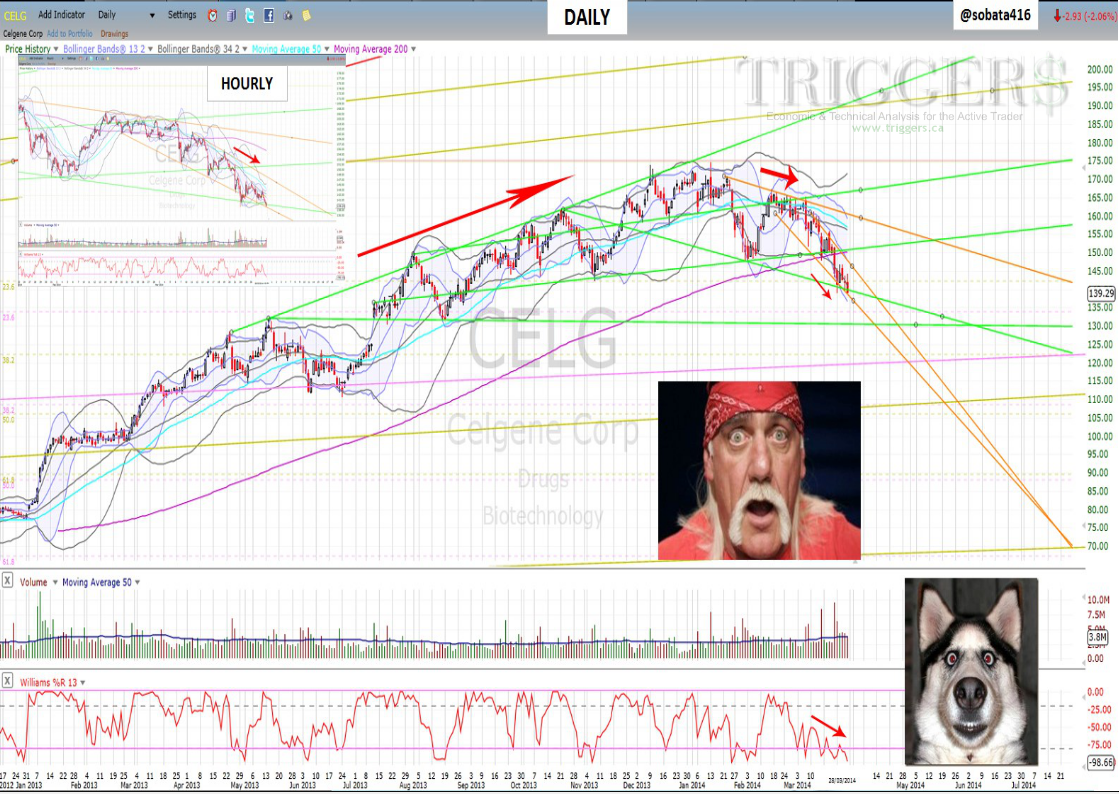 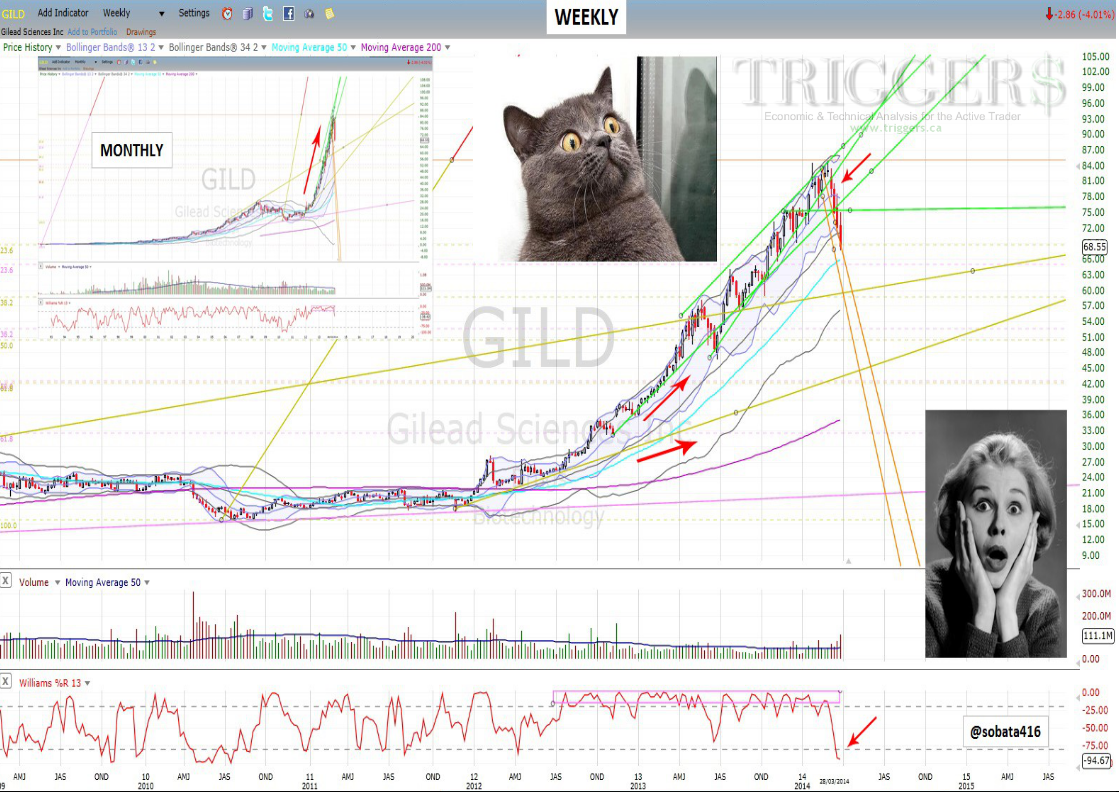 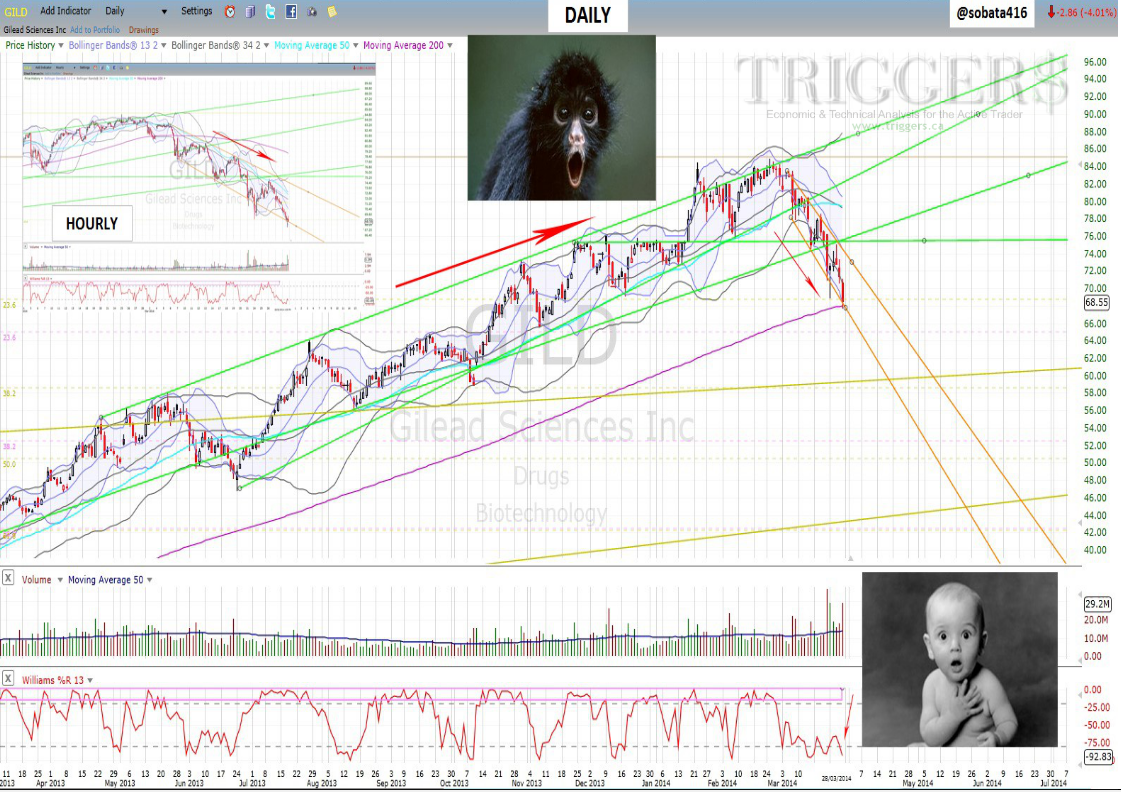 Is this the top? There’s no way to tell. Do some areas of the market look like past bubbles once did? Without a doubt. The last step up before the fall is often characterized by a feeling that the market is invincible. Despite the S&P’s incredible run, it cannot continue to rally forever. Eventually, economic fundamentals will matter again and when that happens it’s likely that the market will sell off. 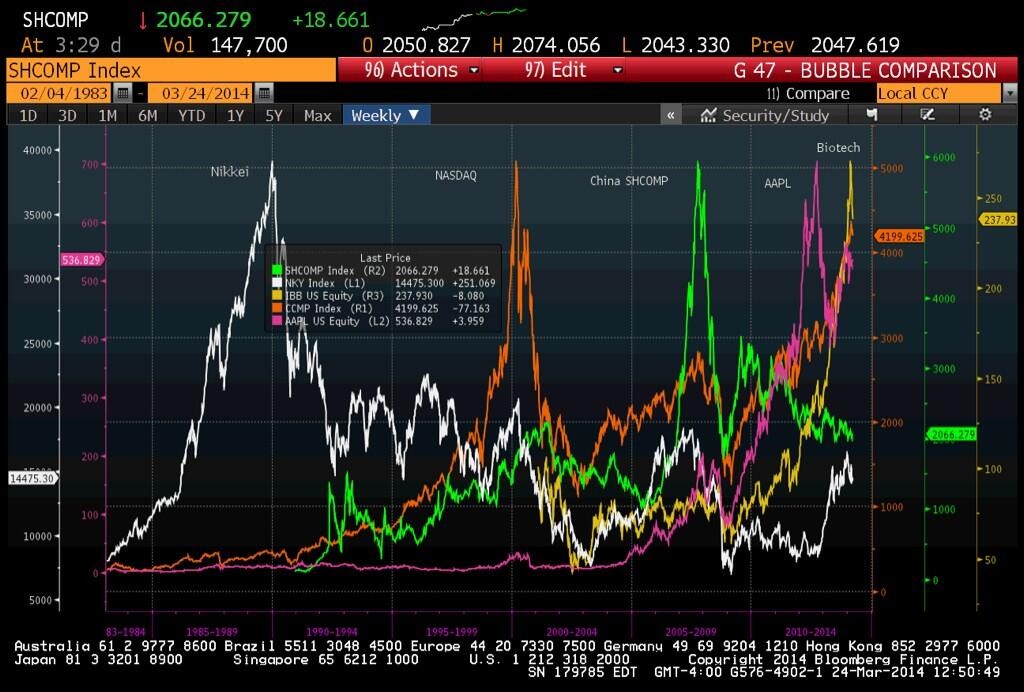 |
Wednesday, April 9, 2014
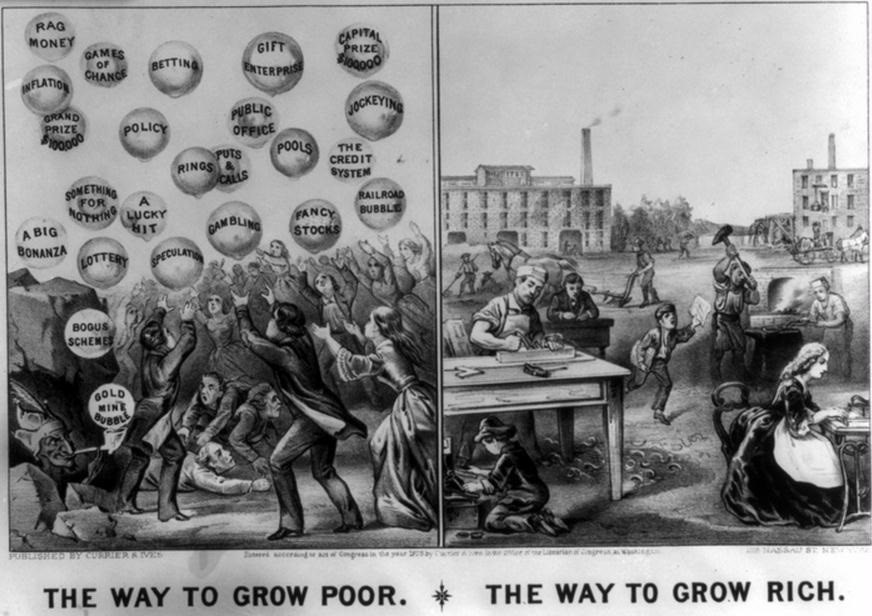
Welcome To The Casino
by Shane Obata
See the original article >>
Subscribe to:
Post Comments (Atom)
No comments:
Post a Comment