By: Gregor_Horvat
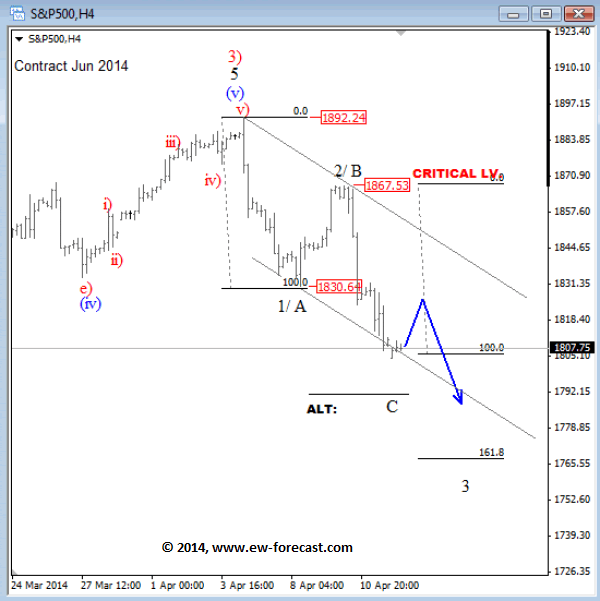
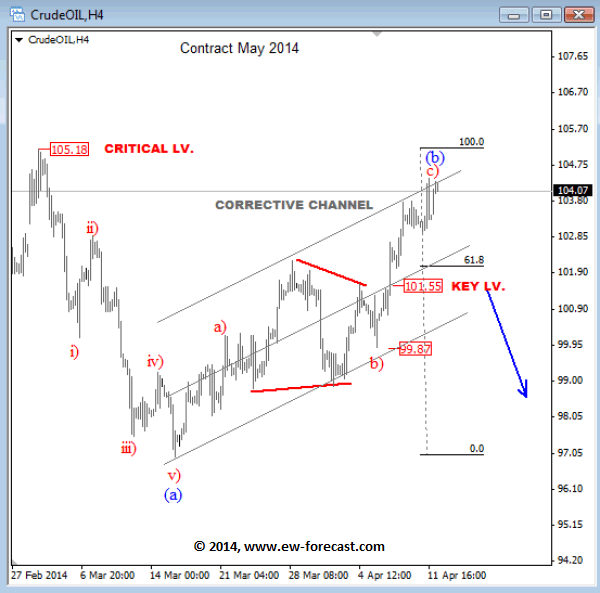
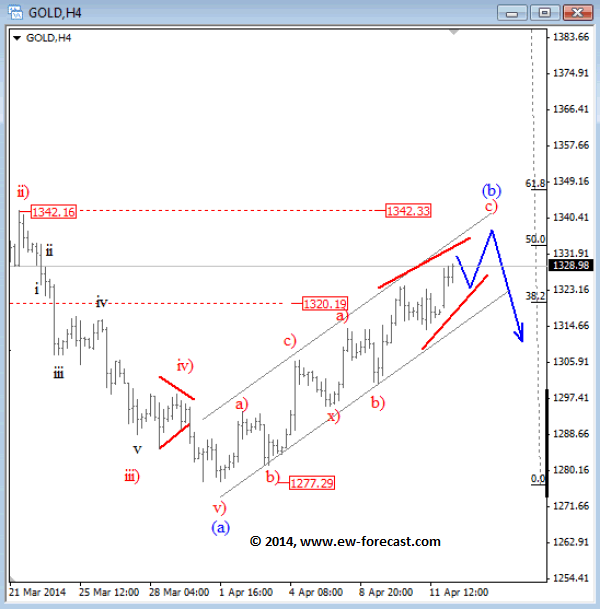
| S&P500 has turned nicely to the downside last week from 1865/1870 resistance area where wave 2/B completed a corrective rally. Market already reached a new swing low but based on downside fib. projections and strong bearish momentum price could be moving down in wave 3 towards 1765 zone. Only rally above the upper resistance line of a current downward channel would put market back in bullish mode. S&P500 4h Elliott Wave Analysis Crude oil exceeded 102.20 swing high last week which makes rally from 97.00 more complex but still corrective. We are looking at a three wave move with a triangle placed in wave b), so current leg from 99.87 can be wave c), final leg within a corrective advance, so we should be aware of a bearish reversal. An impulsive sell-off back to 101.50 will be an important sing for a completed recovery. In that case we would be looking for short opportunities again. Until then staying aside may not be a bad idea. Gold is recovering from 1277 low but still showing a corrective personality because of an overlapping price action. Therefore we think that rally from the low is temporary; ideally it's wave (b) that is part of a larger downtrend. We see price now moving into 1320-1342 reversal zone from where a new sell-off may occur. A decline in impulsive fashion will confirm a downtrend continuation for this market. |
No comments:
Post a Comment