by Greg Harmon
Last week’s review of the macro market indicators suggested, as the page of the calendar turned into March that the equity markets were again looking strong. Elsewhere it looked for Gold ($GLD) to consolidate or pullback in its uptrend while Crude Oil ($USO) consolidated with an upward bias. The US Dollar Index ($UUP) looked in trouble and moving lower while US Treasuries ($TLT) were biased higher. The Shanghai Composite ($SSEC) was ready to get a short term bounce and Emerging Markets ($EEM) looked to continue sideways with an upward bias. Volatility ($VIX) looked to remain low keeping the bias higher for the equity index ETF’s $SPY, $IWM and $QQQ. Their charts also looked higher with the SPY and IWM stronger than the QQQ.
The week played out with Gold moving back and forth in a range while Crude Oil finally found some resistance and pulled back. The US Dollar managed only a Dead Cat Bounce and fell lower while Treasuries pulled back from a double top. The Shanghai Composite is being manhandled by the 50 day Simple Moving Average above and Emerging Markets tested breakouts both higher and lower only to end near unchanged. Volatility remained after a 1 day scare Monday from the Ukraine events. The Equity Index ETF’s used the pullback to gain energy for new highs before giving some back Friday. What does this mean for the coming week? Lets look at some charts.
As always you can see details of individual charts and more on my StockTwits feed and on chartly.)
SPY Daily, $SPY 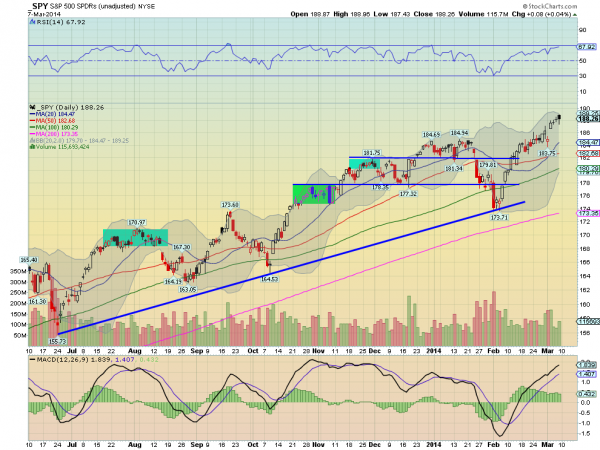
SPY Weekly, $SPY 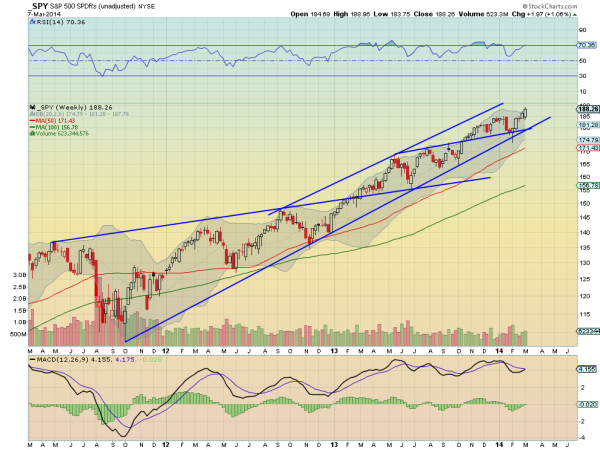
The SPY started the week with a gap down, like many expected given the saber rattling over the Ukraine. But the pullback re-energized it and it gapped higher Tuesday to new all-time highs, continuing the rest of the week before a pullback Friday. The Friday candlestick, has several bearish characteristics. It is a Hanging Man, a potential reversal candle, a bearish Engulfing Candle and as it is Solid Black shows bearish intraday price action. All raise the caution flag for a short term trader. But the RSI is bullish and strong with the MACD rising, both supporting more upside. Moving out to the weekly chart the picture is much more bullish. The bullish engulfing candle following the move higher last week, is accompanied by a RSI that is rising and bullish and a MACD that is about to cross up. This suggests any pullback might be very short lived. There is resistance at 188.96, Friday’s high and then Measured Moves to the 195-197 area above. Support lower comes at 186.75 and 185 before 183.75 and 181.80. Continued Upward Price Action.
Heading into the next week the equity markets look positive. Elsewhere look for Gold to consolidate with an upward bias while Crude Oil remains on the short term upward path. The US Dollar Index looks weak and ready to move lower while US Treasuries are also biased lower in their consolidation zone. The Shanghai Composite and Emerging Markets are set up to continue their consolidations from this week with Emerging Markets holding an upward bias. Volatility looks to remain subdued keeping the bias higher for the equity index ETF’s SPY, IWM and QQQ. Their charts favor the upside as well, fairly strongly in the SPY and IWM and less so in the QQQ, with all at risk for a very short term intra-week pullback. Use this information as you prepare for the coming week and trad’em well.
No comments:
Post a Comment