by Greg Harmon
Last week’s review of the macro market indicators suggested, heading into the week that the equity markets looked positive. Elsewhere it looked for Gold ($GLD) to consolidate with an upward bias while Crude Oil ($USO) remained on the short term upward path. The US Dollar Index ($UUP) looked weak and ready to move lower while US Treasuries ($TLT) were also biased lower in their consolidation zone. The Shanghai Composite ($SSEC) and Emerging Markets ($EEM) were set up to continue their consolidations from the prior week with Emerging Markets holding an upward bias. Volatility ($VIX) looked to remain subdued keeping the bias higher for the equity index ETF’s $SPY, $IWM and $QQQ. Their charts favored the upside as well, fairly strongly in the SPY and IWM and less so in the QQQ, with all at risk for a very short term intra-week pullback.
Well that did not work out very well. The week played out with Gold pushing higher (so far so good) while Crude Oil’s path turned lower. The US Dollar drifted slightly lower while Treasuries made a move higher to test the recent highs. The Shanghai Composite drifted lower and Emerging Markets broke down. Volatility became unhinged at the end of the week moving higher and closing near the highs. The Equity Index ETF’s just moved lower, also ending the week near the lows. What does this mean for the coming week? Lets look at some charts.
As always you can see details of individual charts and more on my StockTwits feed and on chartly.)
SPY Daily, $SPY 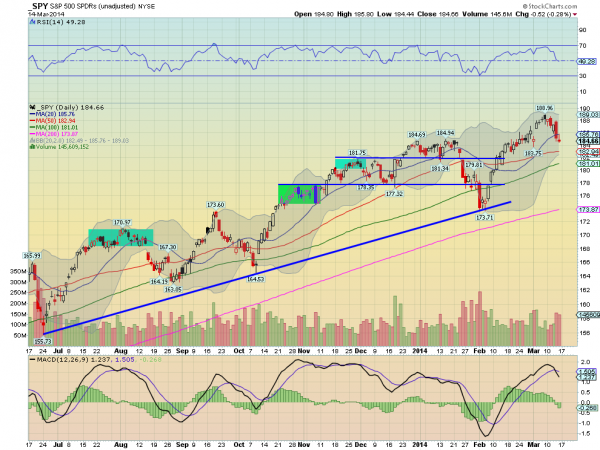
SPY Weekly, $SPY 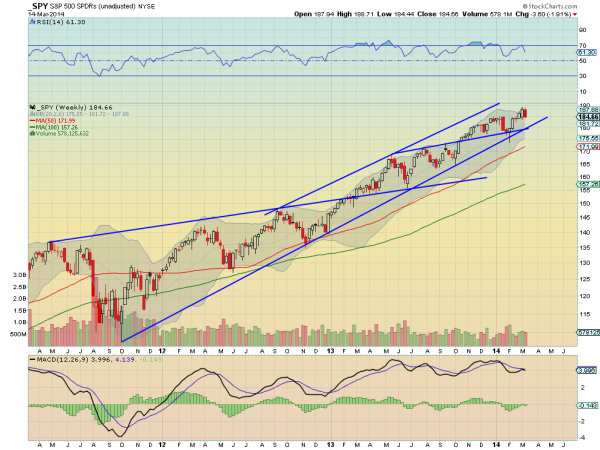
The SPY started the week with a Hanging Man that confirmed last Friday’s Hanging Man lower. Tuesday’s Bearish Engulfing candle confirmed them both lower and it continued lower the rest of the week. The small real body candle Friday, signalling indecision, could mean a reversal, but also could just continue lower. Confirmation is needed. The week ended at prior resistance from December and January, and closed the gap, so there is some basis for a reversal. The RSI continues to fall and point lower through as it cuts through the mid line and the MACD is moving lower after it crossed down Wednesday. These support more downside price action. The weekly chart shows an inside week, holding over the prior resistance level. But here as well the RSI is pointing lower (although in bullish territory) with a MACD that avoided a cross up and is reverting lower. Both support more downside. There is support at 184 and 181.80 followed by 180 and 177.75. A move under 173.75 would put the long term uptrend in jeopardy. Resistance higher comes at 185 and 186.75 followed by 188.96. Over that is a Measured Move targeting the 195-197 area and then much higher. Pullback or Consolidation in the Uptrend.
Heading into the March Options Expiration week and ahead of the widely expected invasion of the Ukraine the markets are jittery if not tired or weak. Specifically look for Gold to continue higher in its uptrend while Crude Oil slows in its pullback and may be ready to reverse higher. The US Dollar Index looks to continue lower while US Treasuries are biased higher and near a break of major resistance. The Shanghai Composite and Emerging Markets are biased to the downside with risk of the Chinese market consolidating and then a possible reversal. Volatility looks to remain low but moving higher cutting the breeze at the back of the equity index ETF’s SPY, IWM and QQQ. Their charts suggest that the SPY and IWM are a bit stronger than the QQQ and may be ready to consolidate and reverse higher, while the QQQ is biased lower. Use this information as you prepare for the coming week and trad’em well.
No comments:
Post a Comment