By: Jason_Hamlin
Gold and silver are testing key technical support levels this week. Some analysts have already flipped their outlook to bearish over the past few days, but I believe the uptrend remains intact as long as current support levels are not breached.
Goldman Sachs has predicted new lows for gold in 2014, but physical buying remains strong and precious metals represent a good safe haven during increasing political tensions worldwide. I also believe that precious metals are one of the only asset classes that remain undervalued at current levels. Stocks, real estate and just about everything else has climbed to unreasonable valuations by any number of measurements.
During late January, gold broke through resistance at the downward sloping trend line that had been in place for over year. This key breakout is circled in the chart below. A new uptrend support line was established starting in December and gold is now testing this support line at $1,300, also the 200-day moving average, for the second time.
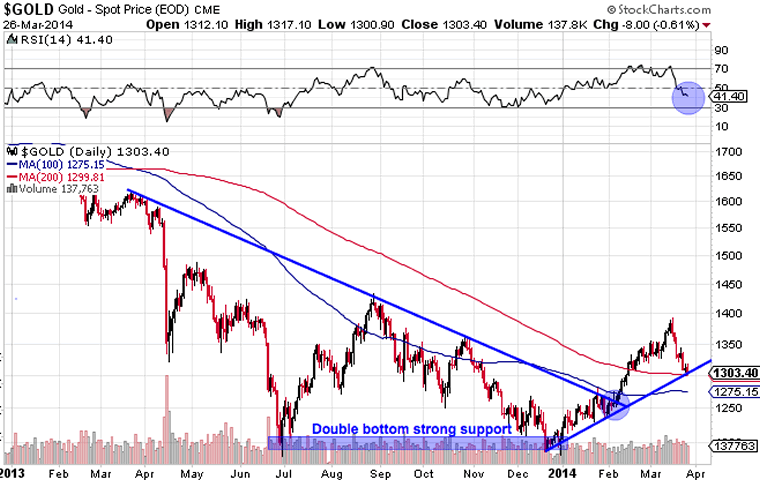
A bounce off this support would be very bullish for gold as it would represent a higher low and verify the new uptrend has staying power. The RSI shows that gold has room to fall lower before becoming technically oversold. I will be looking for gold to find support at the 100-day moving average of $1,275, on any dip below $1,300. However, a failure at $1,275 support would suggest that gold will continue dropping to test the prior low of $1,195. This would mean the gold price drops back below the long-term resistance line and marks a reversal into the downtrend channel once more.
So, all eyes are on $1,300 and then $1,275 gold as critical price levels for determining the future trend. Investors might consider reducing exposure, hedging positions or going short gold on two consecutive days of closing below this support.
Silver Underperforming Gold in 2014
Silver has underperformed gold in 2014 by a wide margin. Some analysts view this as a bearish indicator, as silver usually leads the gold price higher. However, much of the underperformance can be explained by slowing economic growth in 2014. Gold outperforms silver in such an environment, as only 10% of gold’s demand is industrial versus roughly 50% for silver.
The silver chart shows greater volatility, but a more gradual uptrend line with support just above $19. Silver broke out from its long-term downtrend a bit later than gold, with a sharp move higher in early February.
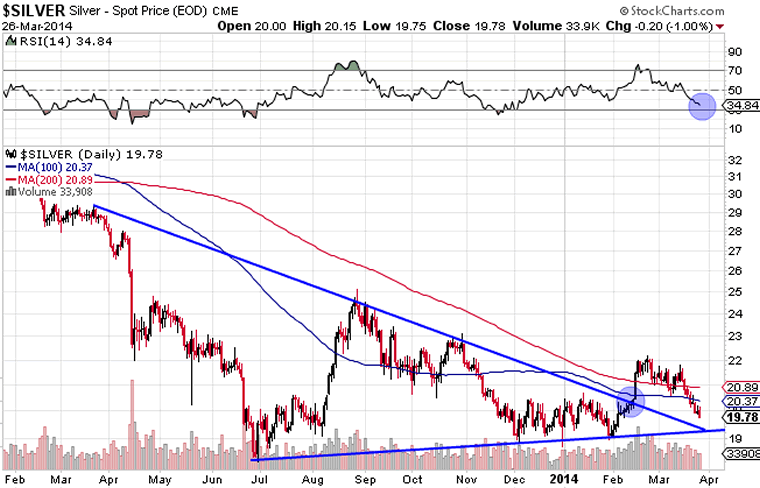
Silver has given back most of its 2014 gains in the past week, as it has fallen back below $20. The uptrend remains intact as long as the silver price holds above $19.16, which is a key level as it is precisely where the two trend lines converge. This level around $19 is also key as it was strong resistance on numerous occasions in the past and this type of resistance often turns into strong support.
I will be watching for silver to find support above $19.16, which was the previous low in February. This would mark a ‘higher low’ for silver, which would be bullish and suggest a continuation of the 2014 uptrend. However, the RSI shows a bit more room to drop and if support fails, we can’t rule out a deeper decline towards $16 in the short-term.
Please keep in mind that technical charts are just an additional data point to be viewed in the greater context of your total decision making matrix. Technical charts can be useful, but they are only slightly more predictive than a dartboard.
I would not make too much of the recent ‘golden cross’ as the 50-day moving average for gold crossed upwards through the 200-day moving average. Silver came close to doing the same thing, but stopped just short. Those on the short-side of things also watch these signals and what better time to sell millions of paper ounces in a not-for-profit manner? Besides, the last golden cross occurred in November of 2012 with gold around $1,750 and we all know how that turned out.
Time to Exit Positions?
Despite the declines over the past week, I don’t think it is time to panic out of precious metals quite yet. The fundamentals have grown increasingly bullish in the past months and technicals remain bullish as long as the support levels mentioned above hold. So far, they appear to be holding, although sentiment is turning bearish and speculators/bots are quick to exit positions on any failure of key technical support.
Even if technical support fails and precious metals drop towards previous lows, I do not believe they will remain there for long. While deep-pocketed players can utilize paper derivatives and extreme leverage to manipulate prices however they wish in the short term, commodity prices rarely drop below their cost of production and never stay at those levels for long.
If producers of oil, food or any other commodity are not able to sell their product at a profit, they are forced to shut down operations. This causes supplies to drop and prices to rise again, assuming reasonably stable demand.
So, we should see a floor for gold and silver prices near the all-in sustaining costs. The industry average for gold is around $1,200 and for silver it is around $20. Therefore, I believe the downside risk with precious metals is limited at this juncture. In the short-term we could see prices fall another 10% or 20% at most.
However, the upside potential is limitless. A move bak to previous highs would represent gains of roughly 50% for gold and nearly 150% for silver. The more money that central banks around the globe continue to print, the higher the potential price of precious metals. There really is no ceiling as there is no limit to how much money can be printed and how much debt can be monetized by desperate banks and governments clinging to a decaying system that gave them power.
Of course, a 10X move to $13,000 gold does not equate to a 10X increase in purchasing power for gold investors. But we can expect the nominal price increase to far outpace inflation, resulting in a significant increase in purchasing power over time. More importantly, investors can sleep well at night knowing their hard-earned wealth is not stored in fiat paper form that can be wiped out by the whims of a few bureaucrats or banksters.
With exploding sovereign debt levels, the ballooning FED balance sheet, increasing consolidation of the banking industry, the ticking time bomb of toxic derivatives still in existence, growing distrust of governments, growing geopolitical tensions, increasing chances of Russia and China dumping U.S. debt/dollars as economic warfare, end of the petrodollar world reserve in sight and rise of alternative monetary systems, it is difficult to imagine gold and silver prices remaining at the currently depressed levels for long.
While I can’t predict exactly when the upward revision to gold and silver prices will take place, I believe we are witnessing the last great buying opportunity in precious metals. Whether prices rocket higher this year or next year, I believe those that were willing to buy when gold was out of favor will be handsomely rewarded. It is the most difficult time to buy when everyone around you is bearish and fearful. But these are exactly the moments when the most successful investors are able to seize the opportunity and buy when everyone else is selling.
To get regular updates like this in your inbox and more thoughts on why I believe the end of the current monetary system and collapse of the petro-dollar is near, consider signing up for the Gold Stock Bull premium membership. You will get our monthly contrarian newsletter, access to the GSB model portfolio, email trade alerts whenever we are buying/selling and a free subscription to our technology newsletter with updates on Bitcoin and other crypto-currencies. You can try it out for just $39 before committing to a full year subscription.
No comments:
Post a Comment