Thursday, September 12, 2013

Nasdaq Presses on Without Apple Support

By: PhilStockWorld

What an exciting index!

On Tuesday, as one of our "5 More Trade Ideas that make 500% in an Up Market", we went long on 16 QQQ Jan $75/80 bull call spreads at $3 ($4,800) and paid for them by selling 2 ISRG 2015 $300 puts for $23.50 ($4,700) for net $100 on the $8,000 spread in our virtual Short-Term Portfolio.

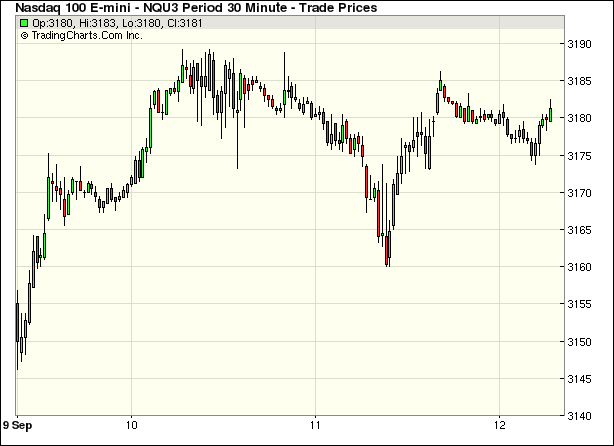
Yesterday morning, however, AAPL decided to take a nose-dive pre-market and, because we were stuck in the spread (as well as long AAPL spreads), I sent out an alert to our Members early in the morning (7:22) to cover with short Nasdaq Futures:

So shorting /NQ at 3,175 is a good way to protect the AAPL longs in the STP. The Nasdaq Futures pay $20 per point so 10 contracts pays $2,000 on a 10-point drop and a tight stop over 3,175 limits the losses.

We hit our $2,000 goal (3,165) at 9:35, just minutes after the market opened, so my first comment to our Members for the morning was:

That's the $2,000 goal on the short /NQ futures and the weekly $495 calls can be bought back for $.40 so done with those in the STP and the $490 calls are $.72 and we'll keep our fingers crossed that we get more of our $2.50 back.

That's how easy it is to use the Futures for quick hedges on your positions when you have market-moving news outside of trading hourse. While we discuss many things at our upcoming Las Vegas seminar, nothing is more important for active traders than learning how to use this valuable tool – the same one that lets us use the energy markets like an ATM!

The best part is, we got out at just the right time, went even longer on the dip and now we're right back on track. As I keep saying to our Members, it's easy to make money in a mindlessly bull market and, since we already hedged for a downturn, we can now get more aggressively bullish. To that end, we added a big long position on AAPL in our beleagured STP and who should join us but my friendbuddypal, Carl Ichan, who liked my trade so much, he went on CNBC and called it a "no brainer."

Carl even pushed my proposal that AAPL just take their $150Bn pile of cash and buy back their own stock. I've said this for ages (since $400) but, even at $467, AAPL has only a $460Bn market cap against $40Bn in CURRENT profits and buying back 1/3 of the company for $150Bn of cash that traders are currently ignoring anyway drops the market cap to $300Bn but has no effect on the $40Bn in sales (p/e of 7.5), not to mention their normal $12Bn dividend would shoot up to 4%.

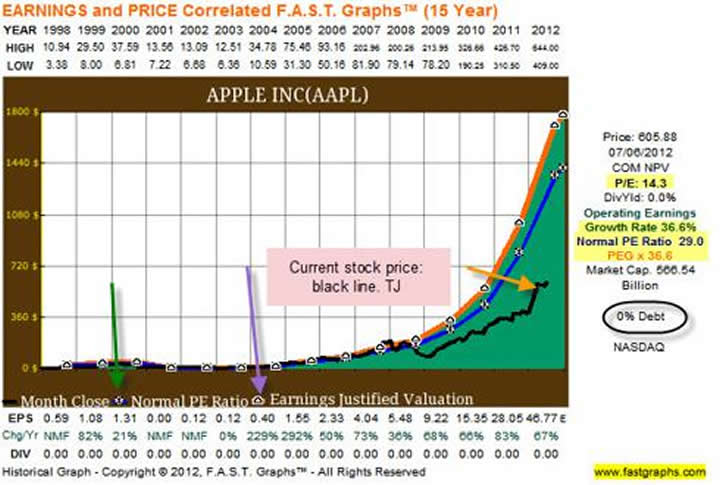
Hell, I say cut the dividend and borrow $300Bn at 3% and take the whole damned thing private if no one else wants to buy them with a p/e of 7.5! The trading public doesn't DESERVE to own AAPL if they don't think it's worth more than $500 a share. End of rant.

Meanwhile, in the rest of the World: The Nikkei dove 380 points (2.5%) from Tuesday's high to 14,300 as the Yen rose (lower) 1.3% from 100.60 to 99.30 in the second easiest Futures trade on the planet (shorting oil at $108.50 (/CL) this morning is still #1). So let's see, a 10% run up and a 2% pullback is 20% of that run and a 20% overshoot is another 0.4% – who'd have thought, right? This is why our 5% Rule™ didn't used to have any charts – IT'S JUST MATH!

15,000 – 10% is 13,500. 13,500 + 10% is 14,850 and 20% of the 1,350 run is 270 points below 14,850, which is 14,580 – which is, as you can see right where the Nikkei hit resistance that was not futile. It's the same place it failed to take back on the first bounce off 13,500. So way back in July the fate of the Nikkei was already sealed but, of course, we knew that – we were shorting the Hell out of the Nikkei back then!

Chart In FocusBack home we're ignoring something that needs to be taken more seriously – a liquidity crisis! As you can see from McClellan's chart on the left, Closed End Bond Funds have been in rapid, steady decline since May. McClellan warns this is a very reliable "canary in the coal mine" stating:

In a period of constrained liquidity, the big cap piggies can still garner their share of the milk, while the runts go hungry. That is why it is useful to watch the health of the bond CEFs and the high-yield bond funds. They are the least deserving of issues, and as long as they are doing okay that means liquidity is not a problem. When they start to suffer, the message is that liquidity is getting tight, and the least deserving of issues are starting to suffer. Eventually such liquidity problems come around to bite the bigger capitalization issues, and that is why this is such an important item to keep watch over.

History shows that the periods when the bond CEF A-D Line is weak are periods when the stock market is in trouble. If there is a stock market dip which is not echoed by the bond CEF A-D Line, usually stock prices recover quickly. But signs of weakness in the bond CEF A-D Line can be a big indication of liquidity problems.

Just something to consider, before we get too irrationally exuberant.

See the original article >>

Corn, wheat prices dip after US lifts supply hopes

by Agrimoney.com

Corn and wheat futures extended losses after US farm officials lifted estimates for supplies of both grains – in contrast to a cut to expectations for inventories of soybeans, which maintained small price gains.

The US Department of Agriculture, in its much-watched monthly Wasde crop report, surprised investors by raising its estimate for the domestic corn harvest by 80m bushels to a record 13.843bn bushels, rather than making the small downgrade they had expected.

The revision reflected a upgrade of 0.9 bushels per acre, to a four-year high of 155.3m bushels per acre, in the yield estimate, with USDA officials noting that the crop was in far better condition than a year ago "despite soil moisture concerns".

Although the US had used up more corn in the newly-finished 2012-13 season than officials had thought, in making ethanol and in exports, the extra output prompt the USDA to lift its estimate for domestic inventories at the close of 2013-14 by 18m bushels.

It also, unexpectedly, raised its forecast for world inventories, highlighting too lower consumption in Canada, which is enjoying a bumper wheat harvest.

Canada upgrade

Indeed, the USDA cited an upgrade to its estimate for the Canadian wheat crop to a 22-year high of 31.5m tonnes as a key reason behind its decision to lift its estimate for world wheat production to a record 708.9m tonnes.

"Production is raised 2.0m tonnes for Canada as cool July weather supported flowering and reproduction, and abundant soil moisture and favourably warm, dry weather in August aided grain fill and maturity across the Prairie provinces," the department said.

With the estimates for European Union and Ukraine harvests also upgraded, the estimate for world stocks at the end of this season was lifted by 3.3m tonnes to 176.3m tonnes.

This included a small upgrade to the forecast for US inventories, reflecting increased imports from Canada.

See the original article >>

British pound faces bearish reversal on Elliott Wave and Fibonacci

By Gregor Horvat

The British pound (FOREX:GBPUSD) is in a bullish mode and reached our projected zone for this week (1.5800-1.5900), which is actually a very important resistance zone in combination with the wave principle and Fibonacci levels. As you can see on the chart, we are tracking a huge wedge pattern called an ending diagonal, which usually predicts a very strong reversal. With that said, we are keeping an eye on potential sell-off on this pair from current resistance zone. This sell-off can happen soon if we consider that prices are in late stages of wave 5 now, testing 61.8% Fibonacci projection compare to wave 3 and also approaching 161.8 % extension of wave 4.

However, as always, only price can confirm the direction you anticipate. In other words, we need a five-wave decline from the highs to confirm further bearish waves for the pair. Only then trader could be interested in short opportunities; until then stay aside.

GBP/USD 4h Elliott Wave Analysis

What is Diagonal Triangle?

A diagonal is a common 5-wave motive pattern labeled 1-2-3-4-5 that moves with the larger trend. Diagonals move within two contracting channel lines drawn from waves 1 to 3, and from waves 2 to 4. There are two types of diagonals: Leading diagonals and ending diagonals. They have a different internal structure and are seen in different positions within the larger degree pattern. Ending diagonals are much more common than leading diagonals.

Ending  Diagonal

An ending diagonal is a special type of pattern that occurs at times when the preceding move has gone too far too fast, as Elliott put it. A very small percentage of ending diagonals appear in the C wave position of A-B-C formations. In double or triple threes, they appear only as the final "C" wave. In all cases, they are found at the termination points of larger patterns, indicating exhaustion of the larger movement.

  • Structure is 3-3-3-3-3
  • A wedge shape within two converging lines
  • Wave 4 must trade into a territory of a wave 1
  • Appears primarily in the fifth wave position, in the C wave position of A-B- C and in double or triple threes as the final "C" wave

See the original article >>

Dismantling the Chinese cotton monster

By Sholom Sanik

Turning bearish on the cotton market back in July after a long stint of bullishness gave us a severe case of whipsaw. December cotton (NYBOT:CTZ13) sailed right through our 88¢-per pound buy stop, on its way to 93¢. Within a few days of the peak, prices plunged, on their way back to 82¢.

During the planting-decision season, there was little incentive for farmers to plant a large cotton crop. Global inventories were burdensome, to say the least, and soybean planting was a more profitable alternative. The most recent estimate for U.S. cotton acreage was 10.2 million acres, down from 12.31 million acres in 2012-13 and 14.74 million acres in 2011-12. The smaller crop seemed adequate to meet both domestic and export requirements.

As the growing season progressed, however, the crop was hit with bad weather. Yields deteriorated, and estimates for a high abandonment rate grew. The Aug. 12 USDA monthly crop report lowered the crop estimate to 13.05 million bales, down from the 13.5-million-bale July estimate. More importantly it was significantly below the average street guesstimate of 13.75 million bales. The abandonment rate rose to 25%, about the same as last year, but not as bad as the 36% seen in the disastrous 2011-12 crop year. Still, it was much worse than the previous 10-year average of only 10%.

Weather has improved since the August crop report and is likely to be reflected in the September crop report estimates, but much of the damage is likely done.

The status of the U.S. crop, however, is merely a diversion from the broader issues, which are decidedly bearish. Actually, to be more accurate, it should be issue, in the singular.

There is an ongoing uncertainty regarding the future of Chinese imports. As we discussed in our most recent article on cotton, Chinese carryover stocks have ballooned to over 58 million bales. That’s up from 50 million bales in 2012-13 and dramatically higher than 31 million bales in 2011-12.

The Chinese government is reportedly in the process of overhauling its stockpiling policies, which effectively made it cheaper for cotton users to import rather than buy domestically grown cotton. The USDA estimates that Chinese imports from all sources will fall by close to 50% from 2012-13, although some analysts see continued robust Chinese imports for the foreseeable future. Hard evidence suggests that Chinese imports have already slowed down materially. For the new 2013-14 marketing year, which began Aug. 1, total Chinese purchases from the U.S., including shipped and unshipped, total 488,000 bales. In the comparable period last year, 1.821 million bales were sold to China.

The forecast for global ending stocks was revised in August to 93.77 million bales, or 85.36% of usage, down slightly from the July estimate of 85.9%. Lower production estimates for the U.S. and China were partially offset by an increase in the estimate for carry-in stocks from the 2012-13 marketing year. But with the magnitude of the overhang we’re looking at, the downward revision in ending stocks is largely meaningless.

If China were to start chipping away at its stockpile, the market would collapse. The rally that stopped us out of our short position was the result of an unwarranted focus on the U.S. crop. We do not believe these price levels are sustainable. Cotton is a particularly volatile market. Look to reestablish conservative short

positions in December cotton on rallies. Place initial stops at 90¢ per pound, close only. Risk averse accounts, not prepared to risk such large losses, should avoid the trade.

See the original article >>

How Japan Pretends To Fight Debt And Deflation, But Doesn't

by The Automatic Earth

Ansel Adams Biology class 1943
Japanese school at Manzanar War Relocation Center, California

Let's see if I can keep this nice and short: in my view the article below from Reuters correspondents Yoshifumi Takemoto and Yuko Yoshikawa, while looking innocent enough at first glance, in fact borders on nonsensical disinformation.

The background is familiar: Japan has been in deflation for decades, falling prices, falling wages, falling spending (velocity of money). Then recently, Shinzo Abe became PM and started spending big time (Abenomics), in yet another attempt to halt the deflation. And then today we read this:

Japan mulls $50 billion stimulus to offset sales-tax hike

Japan is considering $50 billion in economic stimulus to cushion the blow of a national sales-tax increase that is meant to rein in the government's massive debt, people involved in the decisions said on Thursday.

Prime Minister Shinzo Abe is set to raise the tax to 8% from 5% in April, rejecting calls by some advisers to delay or water down the fiscal tightening in order to keep the economic recovery on track.

The tax hike is the biggest effort in years by the world's third-largest economy to contain a public debt that, at more than twice the nation's annual economic output, is the biggest in the world.

But Abe has said he must balance the long-term need to balance the budget against his top priority of breaking Japan free from 15 years of deflation and tepid growth. To offset the drag from the tax increase, Abe this week instructed his government to craft a stimulus package by the end of the month.

One option is a spending package worth 5 trillion yen ($50.01 billion), one of the sources said. The government estimates that each 1 percentage point rise in the tax will generate roughly 2.7 trillion yen in revenues.

Chief Cabinet Secretary Yoshihide Suga said Abe has not yet decided on the tax increase, a move expected on October 1 after a key survey of business sentiment from the Bank of Japan. Suga, the top government spokesman, said Finance Minister Taro Aso and Economics Minister Akira Amari will work out the size and contents of any package.

Aso's ministry, concerned about getting Japan's finances in order, is a strong proponent of the tax increase and wants to minimize any further spending. Amari has said the economic package must be bigger than 2 trillion yen to avoid an economic relapse.

Options include payments to lower-income people to promote housing purchases, tax breaks for companies that increase capital spending and possibly a one-off income-tax cut, sources said.

The prime minister has been proceeding cautiously since many politicians blame the last sales-tax hike, in 1997, for plunging the country into recession. The economy has improved smartly since Abe came to office in December on a platform of fiscal stimulus, monetary easing and growth-promotion measures, but the rebound remains fragile.

With a big upward revision to second-quarter GDP this week and the feel-good boost of Tokyo winning the right to host the 2020 summer Olympics, "the justification for delaying or changing the tax hike disappeared," one source said.

Political leaders from a spectrum of parties agreed last year to double the sales tax to 10% in two stages by October 2015. But the law requires the government to certify that the economy is strong enough to weather the drag from the tax hike.

For starters, it's of course kind of funny to see that the Finance Ministry wants to "minimize any further spending", while the entire Abenomics idea is based on spending more, and everyone recognizes that "the rebound remains fragile". But that's not what irks me most.

If you look through the numbers here, you see that the tax hike from 5% to 8% is supposed to bring in 3 times 2.7 trillion yen, or 8.1 trillion yen, about $81 billion. Abe wants to spend $50 billion of that on more stimulus, so net revenue is $31 billion. This is ostensibly "meant to rein in the government's massive debt". However, according to Wikipedia, Japan's public debt was over 1,000 trillion yen, or $10.46 trillion, for the first time ever on June 30, 2013 ("twice the nation's annual economic output").

Which raises the question how on earth $30 billion can "rein in" a debt of $10.46 trillion. If I'm not mistaken, that comes to just 0.28%. Maybe something got lost in the translation of the term "rein in", but even then. Note: the article calls it "the biggest effort in years by the world's third-largest economy to contain [the] public debt".

And sure, there's a little more in the pipeline. If I may quote Wikipedia again: "In order to address the Japanese budget gap and growing national debt, in June 2012 the Japanese diet passed a bill to double the national consumption tax to 10%. The new bill increases the tax to 8% by April 2014 and 10% by October 2015." So yeah, maybe the tax hike increases revenue by 0.5% of public debt or so 2 years from now. Big whooping deal.

You know what I thought, right off the bat, even before I'd seen the exact numbers, and what I think even more now that I've seen them? That a higher sales tax may not have much noticeable effect on public debt, but that it does have such an effect on inflation numbers. Well, at least the faulty ones everybody likes to use.

If deflation in Japan ranks somewhere in the 2% per year range, a 3% across the board sales tax increase sounds like a gift from heaven for Mr. Abe. As long as he can count it towards Japan's inflation numbers.

The problem with that it it's silly. And wrong. Because if you do that, and make no mistake, it's generally accepted to do it, any government on the planet could solve inflation and deflation problems by simply raising or lowering taxes. If this were true, every government through history would have tried that, and twice on Sunday. The reason it does not work is the same reason why "cost of living" numbers or rising consumer prices do not tell you what a nation's real inflation is.

Inflation and deflation are defined by rising or falling money and credit supply multiplied by the velocity of money. If you can't raise the velocity of money, i.e. you can't force people to spend more, you have no real control over inflation/deflation. If the Japanese people pay for that tax hike by spending less elsewhere, as a government and a central bank you're stuck. Japan's successive governments over the past 20-30 years can tell you all about it. And they haven't succeeded in getting people to spend more in decades (not for lack of trying), so why should they this time around?

Still, that obviously doesn't keep Abe from performing his sleight of hand, nor the media from reporting on it as if it were what it is not. But at least you know now. Japan's sales tax hike has hardly any effect on public debt (which in itself is a very strong indication of how huge the debt really is, if that wasn't clear yet), but it does push up inflation, provided you get everyone to use the faulty "cost of living" definition of it. And then, if you're Shinzo Abe, you - at least temporarily - get to look like a very smart man, able to solve the deflation problems your nation has suffered for a long time. Even if that's not at all what you actually do. Politics equals Kabuki.

See the original article >>

Why Benchmarking Your Portfolio Is A Losing Bet

by Lance Roberts

Just recently it was announced that the Dow Jones Industrial Average will undergo some changes as three companies are removed (Bank of America, Alcoa and Hewlett-Packard) to be replaced by Goldman Sachs, Nike and Visa.  However, the reality is that while the changes are of interest only to people involved in the financial markets as the Dow Jones Industrial Average is no longer relevant as a representation of America's industrial complex or most individual's portfolios.  One of my favorite writers, Neil Irwin, recently wrote in the Washington Post:

"The announcement of the changes shows the absurdity of the index. 'The index changes were prompted by the low stock price of the three companies slated for removal and the Index Committee's desire to diversify the sector and industry group representation of the Index,' the company said.

Of course, the per-share price of a stock has absolutely nothing to do with its size, importance or representativeness. Bank of America is being booted, it would seem, for its sub-$15 per-share price, in favor of Goldman Sachs with a $164 share price. But Bank of America is a way bigger company! Its total market capitalization is $155.6 billion, to $74.5 billion for Goldman. It has 257,000 employees, to 32,000 for Goldman. It is engaged in banking and lending activity in basically every community in America, as opposed to Goldman's specialty investment banking business. But when you find yourself in the archaic trap of weighing companies based on their per-share price, that's the kind of absurdity you end up with."

However, these changes highlight a much bigger issue to investors.  I recently wrote an a article entitled "Why You Can't Beat The Index" which covered the variety of flaws of how benchmark indexes are calculated and the effect on portfolios.

"The sad commentary is that investors continually do the wrong things emotionally by watching benchmark indexes. However, what they fail to understand is that there are many factors that affect a 'market capitalization weighted index' far differently than a 'dollar invested portfolio.'"

Specifically I covered the impact of the "substitution effect" on the index and the inherent "replacement effect" on your portfolio. The upcoming changes to the Dow Jones Industrial Average highlights the importance of these effects on portfolios that are benchmarked to an index.

In order to demonstrate this particular issue we have to make some assumptions.  Most investors don't generally build a "price weighted" portfolio, which is a major flaw of the Dow Jones Industrial Average, but rather build portfolios by either buying round lots or investing rounded dollar amounts.  For our example we will assume that an individual invests a total of $300,000 dollars equally into each of the 30 stocks that comprised the Dow Jones Industrial Average as of November 1, 2005.   Furthermore, the portfolio will be managed exactly like the index and will only be changed when changes to the index are made.  (For purposes of this example only capital appreciation will be utilized.)

Here is where the problems begin.  On February 19, 2008, just prior to onset of the financial crisis, the good folks at S&P Dow Jones indices, swapped out Honeywell and Altria for Bank of America and Chevron.  In hindsight, I am quite sure that the decision to swap out Honeywell for Bank of America was regretted considering what happened next.

However, the important point is that when the two issues were swapped out there was no change to the underlying value of the index due to the way it is calculated.  However, the portfolio experienced a significant negative impact.  In order to adjust the portfolio the shares of Honeywell and Altria had to be sold and then new shares of Bank of America and Chevron had to be purchased.  The original $10,000 investment into Honeywell had grown to $13,367 but the same investment in Altria had fallen to just $2,275.  Therefore, since there was a net loss of $4,358 between the two positions, only $15,642 was able to be reinvested in the two new companies.

In September of 2008 it was American International Group's turn to be swapped out for Kraft Foods.  While this swap again didn't change the value of the index it resulted in a 95% loss in the sale of AIG in the portfolio.

Then, as the financial crisis ended and the markets began to recover, Citigroup and General Motors, were swapped out for Cisco Systems and Travelers in June of 2009.  These two swaps resulted in net losses for the portfolio of roughly 93% and 85% respectively.

The next change came in September of 2012 as Kraft Foods was swapped out for United Healthcare.  Once again there was no change to the value of the index but the impact to the portfolio was at least positive this time showing a 20% gain.

Since the most recent changes do not actually occur until September 20, 2013 we will assume that the upcoming changes occurred as of the close on September 11th.  Therefore, the substitutions of Nike, Goldman Sachs and Visa resulted in portfolio losses of roughly 69% in Alcoa, 66% on Bank of America and 17% for Hewlett-Packard.

The following two charts show you the difference in returns from $300,000 invested in the index versus a portfolio benchmarked to the index.

DJIA-Substitution-Effect-091213

This is the impact of the "substitution and replacement" effects.  During the period of the analysis the drags created by the loss of capital in the portfolio resulted in a net return difference of 28.85% versus 45.54% for the Dow Jones index.  This effect is magnified over longer periods of time.

While Wall Street wants you to compare your portfolio to the "index" so that you will continue to keep money in motion, which creates fees for Wall Street, the reality is that you can NEVER beat a "benchmark index" over a long period.  This is due to the following reasons:

1) The index contains no cash

2) It has no life expectancy requirements - but you do.

3) It does not have to compensate for distributions to meet living requirements - but you do.

4) It requires you to take on excess risk (potential for loss) in order to obtain equivalent performance - this is fine on the way up, but not on the way down.

5) It has no taxes, costs or other expenses associated with it - but you do.

6) It has the ability to substitute at no penalty – but you don’t.

7) It benefits from share buybacks – but you don’t.

In order to win the long term investing game your portfolio should be built around the things that matter most to you.

- Capital preservation

- A rate of return sufficient to keep pace with the rate of inflation.

- Expectations based on realistic objectives.  (The market does not compound at 8%, 6% or 4%)

- Higher rates of return require an exponential increase in the underlying risk profile.  This tends to not work out well.

- You can replace lost capital - but you can't replace lost time.  Time is a precious commodity that you cannot afford to waste.

- Portfolios are time-frame specific.  If you have a 5-years to retirement but build a portfolio with a 20-year time horizon (taking on more risk) the results will likely be disastrous.

The index is a mythical creature, like the Unicorn, and chasing it takes your focus off of what is most important - your money and your specific goals.  Investing is not a competition and, as history shows, there are horrid consequences for treating it as such.  So, do yourself a favor and forget about what the benchmark index does from one day to the next.  Focus instead on matching your portfolio to your own personal goals, objectives, and time frames.  In the long run you may not beat the index but you are likely to achieve your own personal goals which is why you invest in the first place.

See the original article >>

China’s commodity demand seen by Goldman rising rest of year

By Glenys Sim,

Commodity demand in China, the world’s largest user of iron ore, copper and tin, will rebound through the end of the year as infrastructure projects gather pace and users restock, according to Goldman Sachs Group Inc.

The key demand driver is infrastructure and fixed-asset investment, analyst Julian Zhu told reporters at a briefing in Singapore today. Steel prices in the world’s largest producer were seen higher through the end of December, Zhu said.

Goldman’s assessment adds to signs that a slowdown in the second-largest economy may be ending, lifting the outlook for commodities from iron ore to base metals. While Premier Li Keqiang said yesterday that the foundations of a recovery aren’t solid, policy makers have signaled that they will defend a 7.5% expansion goal for 2013. Bank of America Merrill Lynch today raised its growth forecast for China.

“From now till the end of this year, we anticipate China demand for commodities to continue to recover,” Zhu said. “The current commodities inventory in China is still quite low and with the further demand rebound, we should see the ongoing restocking to continue as well.”

Commodities as tracked by the Standard & Poor’s GSCI Index of 24 raw materials are little changed this year, after advancing in July and August. Iron ore with 62% content delivered to the Chinese port of Tianjin rose 0.1% to $135.20 a ton today, up from this year’s low of $110.40 in May, according to figures from The Steel Index Ltd.

Higher Forecast

Data this month showed industrial production beat estimates and manufacturing resumed growth, signaling that the economy is strengthening after a two-quarter slowdown. Bank of America Merrill Lynch said China will grow 7.7% in 2013, up from 7.6% previously forecast, according to a report.

“People are getting more positive, but they’re not super bullish, not yet,” said Zhu “You’re going to see further upside. If you look at the early indicators in September, it seems like the overall economic activity is picking up.”

China’s GDP growth slowed to 7.5% in the second quarter from a year earlier, extending the longest streak of sub-8% expansion in at least two decades. Li signaled in July he won’t tolerate a slowdown beyond 7%.

The government used measures from extra spending on railways to tax cuts to respond to the slowdown. The State Council is targeting 690 billion yuan ($113 billion) of fixed- asset investment in the railway industry this year, the Beijing News reported in July.

Steel reinforcement-bar futures ended at 3,713 yuan a metric ton on the Shanghai Futures Exchange today, after advancing in August for a third month, the best run of gains since January 2011.

See the original article >>

Gold will trade “Flat to Down” for years to come…UPDATE-

by Chris Kimble

CLICK ON CHART TO ENLARGE

The above chart was produced two years ago this month, when Gold was trading just under $1,900 per ounce. The pattern suggested Gold would trade flat to down for years to come (see post here) Since this posting, Gold has declined almost $600 per ounce!

Prior to this above chart, we had been "Bullish Gold!

One of the last bullish calls in August of 2011 before the top, came when gold was trading at $1,641 and the Power of the Pattern was suggesting that Gold would rally to $1,900 (and it did in less than a month) and then the plan was to..... harvest gains at channel and Fibonacci resistance! (see post here)

CLICK ON CHART TO ENLARGE

The above chart reflects the "GREAT DEBATE" in Gold right now.

Left chart (Bearish Case)- Gold has broke below its 10-year rising channel after hitting the 261% Fibonacci resistance level.  Right chart (Bullish case) Gold after retracing 38% of its 10-year rally stopped on rising support.

CLICK ON CHART TO ENLARGE

Recently we bought GLD & SLV on key support levels and then took "Pocket Change Gains" (see post here)

The Power of the Pattern is sending a message that a rare and important situation is taking place, in the metals complex right now. Would you like to know what that message is right now?

See the original article >>

Crashing exchanges Code blue

by The Economist

A new type of market crash proliferates

TIME was it took a war to close a financial exchange. Now all it needs is a glitch in technology. On August 26th trading on Eurex, the main German derivatives exchange, opened as usual; 20 minutes later it shut down for about an hour. Four days earlier the shares of every company listed on NASDAQ, an American stock exchange, ceased trading for three hours. The direct impact of these computer crashes was small. But, given that global markets and financial firms are all hooked up through complex trading programs, the indirect impact could be significant.

In these two cases there was no news of big losses. So there was no panic. All concerned also appear to be making a genuine effort to understand and disclose what went wrong. NASDAQ’s reputation and revenues are still suffering from the disastrous public offering of Facebook in May of 2012, when computer glitches produced an estimated $500m-worth of errant trades. Knight Capital, a securities firm, never recovered from a $460m trading glitch last year. On August 20th a flurry of misdirected trades by Goldman Sachs, a bank, caused embarrassment and as yet unspecified losses. Even the most robust seem vulnerable.

But the frequency of such failures may actually make them less disturbing. Amazon and Google, generally reckoned to be capable and resilient operators on the web, each had blackouts in recent weeks. Systems were reset, business resumed, small losses were absorbed. Zero tolerance of failure, which applies to airlines, bridges and tunnels is not so vital for electronic operators and financial firms.

Especially if the problems are laid bare and addressed. The Securities and Exchange Commission (SEC) has ordered a post-mortem from the New York Stock Exchange’s Arca division, which electronically trades non-NYSE stocks and where the problems tied to the NASDAQ outage began. And it has asked for an account of what unfolded in a system operated by NASDAQ which consolidates trading at America’s 17 exchanges. The system was overwhelmed while trying to reconnect with Arca, triggering a “code blue” alert (a term used in hospital emergencies) and the cessation of trading.

Oddly, nowhere near as much attention is being applied to Goldman, which has been secretive about what went wrong. It has said only that “immaterial losses” occurred from trading problems during a system upgrade and that a review is under way.

It is widely believed that Goldman’s losses stemmed from a “dark pool”—designed to gather and match trading interest unobtrusively—which inadvertently spat out prices onto public exchanges. Reports put the losses anywhere between tens and hundreds of millions of dollars.

Even before the glitches, the SEC was taking increased interest in potential trading problems and how they might be disclosed. In March it published a proposal known as Regulation SCI (systems compliance and integrity). Exchanges and banks are resisting one of its requirements, which is to report blackouts even if they do not lead to anything as severe as trading halts.

America’s regulators are often accused of being heavy-handed. But forcing more transparency on the black boxes that have replaced screaming humans on Wall Street must be a good thing.

See the original article >>

Double Top

By Tothetick Education

The Double Top is a reversal price pattern & is very common seen in all markets, instruments, time frames, & price ranges. It presents with the immediate background environment as bullish with up-trending price action. The classic Double Top can be an indication that the uptrend is losing strength & may possibly be the end of the advance in prices. The Double Top Reversal usually marks an intermediate or long-term change in trend & is therefore considered to have a definite bearish bias.

Visually the Double Top pattern presents two consecutive highs in price, ‘peaks that are roughly equal with the requirement of a moderate trough or swing low in-between. The price level of this swing low establishes what is called a ‘neckline’ & creates the immediate support for the pattern. Traders often refer to this pattern resembling a ‘M’.

Note that in the uptrend there may be many potential double tops in price along the way up, but until significant support is broken, a reversal cannot be confirmed & traders should respect the trend.

Key points to formation:
  1. Background: price action trending Up
  2. 1st swing high peak: marks highest price point in the current trend
  3. 1st swing low trough effort: sellers step in & price declines typically to a significant price area also seen in the background uptrend action. This 1st effort establishes the immediate lower support & defines a ‘neckline’.
  4. 2nd swing high peak: the advance off the support usually occurs with low volume. Resistance at the previous high is the expectation & aggressive traders will look at volume activity for early signs from the bears. Typically the activity may be not as much selling volume as it is a lack of buyers. Without buyers the price cannot advance. Note that there is NO confirmation of a reversal of trend at this point. The time period between peaks can vary but typically they are in-line with the symmetry of the instrument of choice. The 2nd high may offer a perfect double top in price but the ‘textbook’ range for price is acceptable within 3% of the 1st high price.
  5. Decline from peak: Traders are looking for volume & selling pressure with the lack of buyers to accelerate the decline off of the 2nd peak. The type of activity seen in volume during the effort back to support is an indication of strength or weakness. Pattern must have a minimum of 2 swing high efforts creating resistance & 2 swing low efforts creating support.
  6. Support break: even after trading back down to support a trend reversal is not complete. Breaking the support of the lowest swing low price effort of the pattern & with conviction seen in volume completes the Double Top Reversal.
  7. Support turns into resistance: broken support becomes potential resistance. Often but not always, there is a test of this newly created resistance & this effort offers a final consideration for a short entry into a potential change of trend.
  8. Price target: measured move of pattern size. Distance between swing low & swing high of reversal pattern added to breakdown line. This spread in price is an implication of the potential for a decline.

While this pattern is fairly straightforward it should be noted that traders often ‘jump the gun’. Not all repeated peaks produce a change of trend & traders need to remember that the trend is in force until proven otherwise. Top formations can take some time and patience is often a virtue. If a trader will give the pattern time to develop and look for the proper clues & then follow the guidelines, this chart pattern can be well-worth the effort of identifying & trading it.

Options for Trading the Double Top as a bearish reversal pattern:

There are 4 methods of trading this pattern & it depends on your trading style.

Most Aggressive traders will be looking for the 2nd peak in price as soon as the first peak shows resistance & the swing low is in place. As the action comes back to re-test this high resistance area aggressive traders will be diligently monitoring the volume action looking for clues to the selling pressure & lack of buyers. Entries in this area can work with a stop placement just above the highest high of the formation. Aggressive traders should be prepared for thrusting action or ‘bump & run’ type price action.

Aggressive traders may wait until a 2nd swing high is made & then monitor the action thru the middle of the reverse pattern. The concept of this option is to identify the reversal price action as being contained in a support/resistance ‘box’. Traders monitor the middle ‘muddy trench’ or 50-50 of the spread in price offered by the pattern for an entry once the bears control. Stop placement can be fairly tight just above the trench zone. An additional option to consider with this set up is to include waiting for 2 solid efforts on support & then consider the muddy trench zone entry. This can be an accurate trade offering an entry looking to capitalize on a breakdown & potentially a new bearish trend but without the risk of the most aggressive option.

Classic traders will look for a short entry with the breakdown of the neckline or immediate pattern support. Stop placement right above the neckline price.

Conservative traders will watch the breakdown & look for a re-test of that new breakdown resistance price to hold for full confirmation of the double top reversal pattern. Stop placement right above the breakdown price. Note that this method of waiting for this pullback may or may not offer an opportunity but statistically it has a high % of success when it does present.

The aggressive trading methods can highly increase the profit potential of any Double Top & may offer more than one entry. However, the trader needs to assess whether the ‘extra’ profits choosing an earlier entry offers a decent risk:reward over waiting for some confirmation of action based on clearing a defined price support. Traders choosing these options should look for strength from sellers in combination with the lack of buyers. It cannot be stressed enough that volume is a major key & an expansion of bearish volume aids confirmation.

False breakdowns do happen & confirmation needed is always a traders’ choice. Several methods that apply here for either intrabar &/or close bar options offered in sequence: breakdown below support price, retrace holds new resistance line, price clears breakdown swing low price, price clears next swing low of background uptrend price action, larger chart combination.

Stop placement considerations for all trade entry choices can be aggressively lowered after the breakdown of the price.

Measured Move Target based on structure of the Double Top Reversal Pattern

  • Double Top Pattern measure (subtracted from) BreakDown price = target
  • Double Top Pattern measure = (swing high price of pattern (minus) swing low price of pattern)

Since the Double Top Reversal Pattern once confirmed has such a high degree of success in indicating a change of trend, there are additional target considerations based on the knowledge that history repeats. All traders can look for tests on each of the swing lows seen in the immediate background uptrend price action. At any point & for all of these options, traders should gauge the continued conviction of the bears based on momentum. If momentum is strong stick with the trade, if they get ‘lazy’ then consider taking profits & possibly look for a re-entry.

Examples: Double Top Reversal Pattern

TTTdbl top march 20 1m es final TTTdbltop june 14 3m es final

See the original article >>

Double Bottom

By Tothetick Education

The Double Bottom is a reversal price pattern & is very common seen in all markets, instruments, time frames, & price ranges. It presents with the immediate background environment as bearish with down-trending price action. The classic Double Bottom can be an indication that the downtrend is losing strength & may possibly be the end of the decline in prices. The Double Bottom Reversal usually marks an intermediate or long-term change in trend & is therefore considered to have a definite bullish bias.

Visually the Double Bottom pattern presents two consecutive minimums in price, ‘valleys or troughs’ that are roughly equal with the requirement of a moderate peak or swing high in-between. The price level of this swing high establishes what is called a ‘neckline’ & creates the immediate resistance for the pattern. Traders often refer to this pattern resembling a ‘W’.

Note that in the downtrend there may be many potential double bottoms in price along the way down, but until significant resistance is broken, a reversal cannot be confirmed & traders should respect the trend.

Key points to formation:
  1. Background: price action trending Down
  2. 1st trough: marks lowest price point in the current trend
  3. 1st swing high effort: buyers step in & advance price typically to a significant price area also seen in the background downtrend action. This 1st effort establishes the immediate overhead resistance & defines a ‘neckline’. Volume on the advance is often large holders taking profits (‘buy to cover’) & may be inconsequential, but an increase could also signal early accumulation.
  4. 2nd trough: the decline off the resistance usually occurs with low volume. Support at the previous low is the expectation & aggressive traders will look at volume activity for early signs from the bulls. Note that there is NO confirmation of a reversal of trend at this point. The time period between troughs can vary but typically they are in-line with the symmetry of the instrument of choice. The 2nd low may offer a perfect double bottom in price but the ‘textbook’ range for price is acceptable within 3% of the 1st trough price.
  5. Advance from trough: Traders are looking for volume & buying pressure with the lack of sellers to accelerate off of the 2nd trough. The type of activity seen in volume during the effort back to resistance is an indication of strength or weakness. Pattern must have a minimum of 2 swing low efforts creating support & 2 swing high efforts creating resistance.
  6. Resistance break: even after trading back up to resistance a trend reversal is not complete. Breaking the resistance of the highest swing high price effort of the pattern & with conviction seen in volume completes the Double Bottom Reversal.
  7. Resistance turns into support: broken resistance becomes potential support. Often but not always, there is a test of this newly created support & this effort offers a final consideration for a long entry into a potential change of trend.
  8. Price target: measured move of pattern size. Distance between swing low & swing high of reversal pattern added to breakout line. This spread in price is an implication of the potential for an advance.

While this pattern is fairly straightforward it should be noted that traders often ‘jump the gun’. Not all repeated lows produce a change of trend & traders need to remember that the trend is in force until proven otherwise. Bottom formations can take some time and patience is often a virtue. If a trader will give the pattern time to develop and look for the proper clues & then follow the guidelines, this chart pattern can be well-worth the effort of identifying & trading it.

Options for Trading the Double Bottom as a bullish reversal pattern:

There are 4 methods of trading this pattern & it depends on your trading style.

Most Aggressive traders will be looking for the 2nd trough in price as soon as the first trough shows buyer support & the swing high is in place. As the action comes back to re-test this low support area aggressive traders will be diligently monitoring the volume action looking for clues to the buying pressure. Entries in this area can work with a stop placement just below the lowest low of the formation. Aggressive traders should be prepared for capitulation selling or ‘dump & run’ type price action.

Aggressive traders may wait until a 2nd swing low is made & then monitor the action thru the middle of the reverse pattern. The concept of this option is to identify the reversal price action as being contained in a support/resistance ‘box’. Traders monitor the middle ‘muddy trench’ or 50-50 of the spread in price offered by the pattern for an entry once the bulls control. Stop placement can be fairly tight just below the trench zone. An additional option to add to this set up is to include waiting for 2 solid efforts on resistance & then consider the muddy trench zone entry. This can be an accurate trade offering an entry looking to capitalize on a breakout & potentially a new bullish trend but without the risk of the most aggressive option.

Classic traders will look for a long entry with the breakout of the neckline or immediate pattern resistance. Stop placement right below the neckline price.

Conservative traders will watch the breakout & look for a re-test of that new breakout support price to hold for full confirmation of the double bottom reversal pattern. Stop placement right below breakout price. Note that this method of waiting for this pullback may or may not offer an opportunity but statistically it has a high % of success when it does present.

The aggressive trading methods can highly increase the profit potential of any Double Bottom & may offer more than one entry. However, the trader needs to assess whether the ‘extra’ profits choosing an earlier entry offers a decent risk:reward over waiting for some confirmation of action based on clearing a defined price resistance. Traders choosing these options should look for strength from buyers in combination with the lack of sellers. It cannot be stressed enough that volume is a major key & an expansion of bullish volume aids confirmation.

False breakouts do happen & confirmation needed is always a traders’ choice. Several methods that apply here for either intrabar &/or close bar options offered in sequence: breakout above resistance price, retrace holds new support line, price clears breakout swing high price, price clears next swing high of background downtrend price action, larger chart combination.

Stop placement considerations for all trade entry choices can be aggressively raised after the breakout of the price.

Measured Move Target based on structure of the Double Bottom Reversal Pattern

  • Double Bottom Pattern measure (added to) BreakOut price = target
  • Double Bottom Pattern measure = (swing high price of pattern (minus) swing low price of pattern)

Since the Double Bottom Reversal Pattern once confirmed has such a high degree of success indicating a change of trend, there are additional target considerations based on the knowledge that history repeats. All traders can look for tests on each of the swing highs seen in the immediate background downtrend price action. At any point & for all of these options, traders should gauge the continued conviction of the bulls based on momentum. If momentum is strong stick with the trade, if they get ‘lazy’ then consider taking profits & possibly look for a re-entry.

Examples: Double Bottom Reversal Pattern

TTT dbl bot Feb 26 -27 5m final TTTdbl bot july 2 es 1m final

See the original article >>

Poverty Crisis in the EU

By tothetick

There are very few people that actually give even one hoot and even fewer that could give two of them when it comes to poverty of people that are living in society alongside us. We live in an I’m-alright-Jack world where love thy neighbor probably means just a quick extra-marital affair rather than a hand reaching out to give some help. But the austerity measures that have washed the European Union away have left in the wake of the tsunami just a lost generation of people that are trapped in growing and ever-increasing poverty.

Failed Policies of the EU

The charity Oxfam in the UK has just published a damning report that will probably go very much unheard of showing that by 2025 there will be 25 million people that are living in poverty due to the austerity measures imposed upon them. It will go largely unheard of because other things are turning the media’s attention away from such a social crisis and in turn the people of those very same countries are fixated with the belief that it is Syria, Bachar-al-Assad or Vladimir Putin or even the election of Angela Merkel that are more important than people actually starving from lack of financial resources in the countries that they live in.

Oxfam believes that the austerity measures imposed on populations in European countries takes us back to the havoc wreaked by structural programs of readjustment in developing countries that most of us only witnessed sitting in the comfort of this side of television-land. Now, that’s not the case. Back then, in the 1980s and in the 1990s it was the fault of the International Monetary Fund that in their infinite wisdom had gladly wanted to bail out the failing countries of the world just as long as they cut spending to a minimum and they imposed increases in taxes on the entire population. Not that much different from what is being done right now in the European Union. How little we remember!

Poverty in the EU

Poverty in the EU

The report published this week states: “These policies were a failure: a medicine that sought to cure the disease by killing the patient. They cannot be allowed to happen again”.

Today the number of people that are living with the financial resources equivalent to just 40% of the median income of the European Union stands at 15 million, but this will increase by at least 10 million more as the measures show their full effect on the population of European member states.

The citizens of the EU have been bamboozled into believing that austerity is the only way out of the economic strife of the financial crisis. Reduce, cut costs, increase taxes, freeze wages, raise the prices and reduce purchasing power. A recipe for disaster in any economy, that will only make the banks richer and the people poorer, except for the stock-market investors that will willing reap the benefits of the falsely improving stock market due to the unconventional monetary policies that have been put in place by the Federal Reserve of the USA,for example.

Greece

Greece will never see the end to its woes in the EU and there will be a lost generation of people (or even two) as the country tries to battle with the rising debts and escalating costs of repaying that debt, all imposed by the troika (the European Union, the European Central Bank and the International Monetary Fund). Greece will most certainly need yet another bail-out plan to help it find at least €10 billion. Unemployment is over 1 in 4 people today in Greece (27%) and it is most certainly the austerity measures that have played their role in the worsening situation of the people.

Apart from making them work for free (and starve so they cost nothing in a short while) there can only be a deepening debt crisis since there are few people actually working in the economy and therefore the generation of economic activity that is already in a dire situation has become even worse. It is only the top 10% of those countries that are seeing their wealth grow, with the gap being widened every time the IMF and the ECB impose new austerity conditions and provisos on the countries. The inequality is widening so much that there will soon be little difference between the dictatorial leaders of the developing countries in some places that maintain their populations in the poverty that they have become accustomed to simply to reap the benefits of their privileged positions of decision-making implementation.

Greece is in 3rd place in the poverty rankings of the EU, just after Bulgaria and then Romania. Latvia comes in at 4th place.

UK

In the UK for example median income for households is predicted to increase by sometime in the middle of next year. However, by 2015 the median income of the UK will still be below the level that was reached in 2010. Benefits from the state will not keep pace (under the present austerity measures) in the UK with median-income rises and this means therefore that there will be 1 million extra adults living in relative poverty in the UK by the year 2020. There will also be an average of 300, 000 children living in relative-poverty households. Median income of the UK is lower by 7% today than it was in 2010. The austerity measures that have been imposed in the UK include in the latest round of cuts announced in July by George Osborne the UK Chancellor of the Exchequer:

  • £11.5 billion in total cuts.
  • That means 8.5% for 2015 and 2016.
  • Across the board spending cuts in all departments of roughly 10% of their budgets.
  • A 7-day waiting period where an unemployed person is not allowed to sign on in order to claim benefits after losing a job.
  • Claimants who cannot speak English will lose their state benefits.
  • This alone is estimated to save £350 million.

In the 1990s more than 50% of people in the UK believed that their taxes should be raised in order to provide a better public service to the country. Today only 36% of the country believes that this should happen.

The EU Finance ministers will be meeting tomorrow in Lithuania. The recovery has yet to materialize and the people of the EU were told that they would have 5 years of austerity and things would be on the mend.

5 years will became 6 and then 6 will unfortunately turn into 7 and more until they have recreated the developing-country scenario of omnipotent leaders reaping the benefits from the working, or by then the enslaved masses.

See the original article >>

Sugar sees production fall in Brazil, but fails to rally

By Jack Scoville

SUGAR (NYBOT:SBV13)

General Comments: Futures traded higher on early follow-through buying tied to less production in Brazil, but closed a little lower as the rally started to fail as crude oil futures worked lower. UNICA said that mills in Brazil's main sugar-cane growing region produced 3.2 million metric tons of sugar in the second half of August, down 3.7% from last year. Ethanol production from the region increased 8.3% to 2.1 billion liters. The demand for ethanol makes Sugar futures sensitive to moves in the energy complex. There is not much on offer in the cash market for now, and that is helping Sugar futures hold the recent range. Thailand and India expect more production this year, and both countries are actively offering their supplies into the world market. Demand for ethanol has been good. Chinese demand has been soft, but Middle East demand is good. Prices appear to be in a trading range for now due to solid demand and big production.

Overnight News: Brazil could see dry weather and moderate temperatures.

Chart Trends: Trends in New York are up with objectives of 1780 March. Support is at 1740, 1710, and 1700 March, and resistance is at 1780, 1810, and 1840 March. Trends in London are up with no objectives. Support is at 488.00, 486.00, and 479.00 December, and resistance is at 496.00, 501.00, and 505.00 December.

COTTON (NYBOT:CTV13)

General Comments: Futures closed little changed as traders started to get ready for the USDA reports today. The market expects USDA to show good production and good supplies. Many areas are turning hot and dry again, and this created some buying interest as well. China issued some positive economic data over the weekend to help demand ideas stay afloat after the stronger than expected export sales report from last week. US crop development remains behind due to delayed planting this year, but crop conditions right now are generally good. Weather is warm in the US, with the Delta and the Southeast expecting above normal temperatures into the weekend. Texas is dry and warm. Weather for Cotton still appears good in India. The market is getting ready for the harvest, and any rallies now might be very limited in scope.

Overnight News: The Delta will be dry and Southeast will see a few showers late in the week. Temperatures will average above normal in the Delta and mostly above normal in the Southeast. Temperatures should start to turn cooler this weekend. Texas will see dry weather. Temperatures will average above normal. The USDA spot price is now 81.36 ct/lb. ICE said that certified Cotton stocks are now 0.018 million bales, from 0.018 million yesterday. USDA said that net Upland Cotton export sales were 134,400 bales this year and 19,800 bales next year. Net Pima sales were 16,000 bales this year and 0 bales next year.

Chart Trends: Trends in Cotton are mixed to up with no objectives. Support is at 83.90, 82.80, and 82.30 October, with resistance of 85.05, 85.30, and 86.00 October.

FCOJ (NYBOT:OJX13)

General Comments: Futures closed lower as a hurricane formed in the Eastern Atlantic. The report created some initial buying, but the support from the storm quickly faded. The storm is not going to come anywhere close to Florida, but it gave traders a reason to buy, anyway. The storm shows that the conditions in the Atlantic might be improving. The historical peak of the season has just passed. There are still no real threats showing in the tropical Atlantic for Florida. Growing conditions in the state of Florida remain mostly good. Showers are reported and conditions are said to be very good in almost the entire state. Temperatures are warm. Brazil is seeing near normal temperatures and mostly dry weather, but production areas will turn warmer again this weekend.

Overnight News: Florida weather forecasts call for some showers. Temperatures will average near normal.

Chart Trends: Trends in FCOJ are mixed. Support is at 134.00, 131.00, and 129.00 November, with resistance at 139.00, 140.00, and 142.00 November.

COFFEE (NYBOT:KCZ13)

General Comments: Futures were sharply higher in all markets as Brazil began to roll out details of its support program for producers. It will provide R$284 million for storage costs and about R$242.6 million for working capital for producers. There was also talk that current dry weather in Brazil could hurt the flowering for the next crop. The news cause a lot of short covering, but most traders are still bearish longer term on big world supplies. Coffee appears to be available in Central America as farmers and mills clear inventories before the next harvest. Colombia is offering Coffee into the cash market at weaker differentials. Buyers are said to be well covered. Current crop development is still good this year in most production areas of Latin America. Central America crop conditions are said to be good overall. Colombia is still reported to have good conditions. Harvest conditions are good in Brazil.

Overnight News: Certified stocks are higher today and are about 2.785 million bags. The ICO composite price is now 114.69 ct/lb. Brazil should get dry conditions. Temperatures will average near to above normal. Colombia should get scattered showers, and Central America and Mexico should get showers and rains. Temperatures should average near to above normal.

Chart Trends: Trends in New York are mixed to up with objectives of 123.00 and 127.00 December. Support is at 119.00, 116.00, and 114.00 December, and resistance is at 122.00, 125.00, and 127.00 December. Trends in London are mixed. Support is at 1740, 1730, and 1720 November, and resistance is at 1800, 1825, and 1840 November. Trends in Sao Paulo are mixed. Support is at 139.00, 137.00, and 134.00 December, and resistance is at 145.50, 148.50, and 150.50 December.

COCOA (NYBOT:CCZ13)

General Comments: Futures closed near unchanged after an early rally attempt failed. Cocoa is between crops, but has rallied a lot and might start to correct lower now. The move lower could last generally through the end of the year as the main crop harvest is not that far away. Ideas are that crop conditions there are generally improving. West Africa is expected to get scattered showers, and conditions there are said to be improving for almost all producers. Temperatures are moderate. The harvest will be getting underway soon. Malaysia and Indonesia crops appear to be in good condition and weather is called favorable. Nigerian farmers are drying Cocoa now that rains have passed and the weather has improved. Drying has been delayed over the last couple of weeks from too much rain.

Overnight News: Scattered showers are expected in West Africa. Temperatures will average near normal. Malaysia and Indonesia should see scattered showers, but southern areas could be dry. Temperatures should average above normal. Brazil will get mostly dry conditions and warm temperatures. ICE certified stocks are lower today at 4.491 million bags.

Chart Trends: Trends in New York are mixed to up with objectives of 2610 and 2720 December. Support is at 2540, 2525, and 2505 December, with resistance at 2590, 2605, and 2620 December. Trends in London are mixed. Support is at 1670, 1660, and 1650 December, with resistance at 1710, 1740, and 1770 December.

See the original article >>

The spread of anti-establishment politics across Central and Eastern Europe may hold lessons for West European countries

By Seán Hanley & Allan Sikk

The spectacular breakthrough of Beppe Grillo’s Five Star Movement in Italy in February underlined the potential for a new type of anti-establishment politics in Europe: loosely organised, tech savvy and fierce in its demands to change the way politics is conducted, but lacking the anti-capitalism or racism that would allow it to be easily pigeon-holed as the traditional outsider politics of the far-left or far-right.

But for observers of Central and Eastern Europe (CEE), the dramatic eruption of new parties led by charismatic anti-politicians promising to fight corruption, renew politics and empower citizens is nothing new. Indeed, over the last decade a succession of such parties – led by a colourful array of ‘non-politicians’ ranging from aristocrats to central bankers, journalists and businessmen – have broken into parliaments in the region.

Some have achieved spectacular overnight success in elections on a scale easily comparable to Grillo’s and (unlike Grillo) have often marched straight into government. Some examples include the National Movement for Stability and Progress in Bulgaria in 2001, the New Era Party in Latvia in 2002, Res Publica in Estonia in 2003, and, more recently, the Czech Republic’s Public Affairs party in 2010, Palikot’s Movement in Poland in 2011, Positive Slovenia in 2011, and Ordinary People in Slovakia in 2012. In a new paper, we explore what these parties, which we term anti-establishment reform parties, have in common and what drives their success.

Not just the far right

Much of the commentary about the rise of new forms of protest politics has been confused. Some simply view all forms of anti-establishment politics through the distorting lens of the ‘rise of the far-right’, although as careful consideration of the evidence shows, the electoral performance of radical right parties in both Western and Eastern Europe has remained distinctly patchy. In Central and Eastern Europe the extreme right is largely stagnant or in decline, with the important exception of the Jobbik movement in Hungary.

For some, the new parties are part of a backlash against austerity and economic hard times, after the global downturn and the Eurozone crisis. In an era when traditional ideologies of the left are receding and (at least in Europe) the traditional working class and its organisations are declining, it is unsurprising that protest at the ballot box sometimes takes the form of a surge by unconventional new ‘centrist populist’ parties. This is especially the case given that some of the biggest losers in the current economic crisis are a generation of networked, well educated and individualist young people. In this view such parties are – to borrow the title of Paul Mason’s famous blog and book – simply one facet of things ‘kicking off everywhere’ in a climate of global austerity.

A crisis of politics?

For others, the rise of new anti-establishment parties is the expression of a crisis of politics, not economics. It is argued that the new parties and movements bubbling up from the social and political margins are concerned with accountability, democracy and empowerment, driven by a pervasive disconnect between the governors and governed. Often, especially in newer democracies such as in Central and Eastern Europe, such distrust and disgust is created by the (real or perceived) corruption of established political elites. One earlier paper exploring the new anti-establishment parties in Central and Eastern Europe even terms them ‘anti-corruption’ parties.

A fourth, less often heard explanation can be found in academic works on party change and electoral volatility. In this view, most eloquently expressed by the late Peter Mair, the crisis of representative democracy should really be understood in terms of a long decline in traditional party politics. As parties have retreated from civil society and become entwined with the state, they have left increasingly volatile electoral markets, feeding the rise of often short-lived new parties.

In Central and Eastern Europe electoral volatility has been particularly high. The parties that emerged after the fall of communism failed to establish strong organisations and forge strong ties with voters. Such volatility has, as As Grigore Pop-Eleches convincingly argued, led voters to turn to unconventional new parties of all kinds.

Paths to anti-establishment breakthrough

In our paper, we use Qualitative Comparative Analysis (QCA) to examine breakthroughs of anti-establishment reform parties in CEE between 1999 and 2012. We relate their breakthroughs to five potential causes, broadly reflecting the alternative interpretations above: economic hardship; rising unemployment; high levels of corruption; rising corruption; and the previous success of new parties in earlier elections.

QCA allowed us to move beyond broad, blanket explanations and pick out distinct combinations of causes. We found four main contexts which accounted for all but three of our cases of anti-establishment breakthrough. First, there were situations of corrupt socially painful growth where rising unemployment combined with economic growth and high levels of perceived corruption. This corresponded to the phase of post-communist reform for some states shortly before their EU accession in 2000-2 (Lithuania 2000, Poland 2001, and Slovakia 2002).

Second, anti-establishment breakthroughs arose in a context of growth but increasing corruption in unstable party systems, suggesting that voters turn to new anti-establishment parties even in periods of economic prosperity if there is already a tradition of voting for new parties.

Third, there are situations of low but rising corruption in periods of economic prosperity. This pathway suggests that corruption can interact with a benign socio-economic climate to create a favourable context for anti-establishment reformers – perhaps by shifting voters’ attention from economic concerns to issues of governance.

The final pathway for anti-establishment parties is recession and rising corruption in previously stable party systems. This covers elections in the Czech Republic, Hungary and Slovenia in 2010-11. In all three cases the inability of (some or all) established parties to respond to economic crisis, coupled with de-legitimation by growing concerns over corruption, prepared the way for an anti-establishment reform party.

Rethinking protest parties

Our findings allow some important conclusions to be drawn. First, early debates framing the rise of anti-establishment parties as products of a crisis of politics, or the fallout of recession, are misplaced. Instead, we need to refocus on relationship(s) between hard times, corruption and the travails of established parties.

Second, many of the relationships cut counter-intuitively against expectations. In Central and Eastern Europe, anti-establishment reform parties do not appear to be ‘crisis parties’. They have broken through more often in periods of economic prosperity than they have during economic downturns.

Third, we find that party system stability, rather than party system fluidity can be more conducive to anti-establishment party breakthroughs. The stability of established parties may, at least in Central and Eastern Europe, have represented rigidity and ossification, rather than democratic consolidation. This, as the rise of Italy’s Five Star Movement already indicates, may hold particular lessons for some Western European states. Finally, we find that in many contexts changes in perceived corruption matter more than levels of corruption. Rising corruption in a low corruption environment has been notably effective in mobilising voters behind anti-establishment reformers.

While diverse, these paths suggest that a new breed of anti-establishment reformers has appeared and these movements have, until now, been incompletely understood. Their growing success has potentially far-reaching consequences for party systems and party-based democracy in both Western and Eastern Europe.

See the original article >>

Vicious Gold Slamdown Breaks Gold Market For 20 Seconds

by Tyler Durden

There was a time when, if selling a sizable amount of a security, one tried to get the best execution price and not alert the buyers comprising the bid stack that there is (substantial) volume for sale. Of course, there was and always has been a time when one tried to manipulate prices by slamming the bid until it was fully taken out, usually just before close of trading, an illegal practice known as "banging the close." It appears that when it comes to gold, the former is long gone history, and the latter is perfectly legal. As the two charts below from Nanex demonstrate, overnight just before 3 am Eastern, a block of just 2000 GC gold futures contracts slammed the price of gold, on no news as usual, sending it lower by $10/oz. However, that is not new: such slamdowns happen every day in the gold market, and the CFTC constantly turns a blind eye. What was different about last night's slam however, is that this time whoever was doing the forced, manipulation selling, just happened to also break the market. Indeed: following the hit, the entire gold market was NASDARKed for 20 seconds after a circuit breaker halted trading!

To summarize: a humble block of 2000 gold futs (GC) taking out the bid stack, and slamming the price of gold, managed to halt the gold market: one of the largest "asset" markets in the world in terms of total notional, for 20 seconds.

Here is Exhibit A of either market manipulation or yet another broken market from Nanex:

December 2013 Gold (GC) Futures Depth of Book

Zooming in on the drop and showing the trading halt.

See the original article >>

Volatility is Signaling the Market Higher

by Greg Harmon

All of the indicators have been lining up, compounding the bull case. Another one will print today. The Volatilty Index, $VIX, is one we starting following more closely earlier this year. I first wrote about it as a market indicator, not a risk indicator, in April in The Spike in the Volatility Index Points to Higher Stock Prices. Since then it has held true to form. The basic premise is that a spike in the VIX over all of the simple Moving Averages on the daily chart (20, 50, 100 and 200 day) followed by a reversal lower under all of them, and confirmed by a MACD cross lower, signals a bottom has formed in the S&P 500, $SPX, and that new highs are on the way. This has happened the last 7 times it has occurred (first was confirmed December 13, 2011). With a close under the 50 day SMA at 14.24 today, it triggered for an 8th time. This is of course no guarantee for the market to make another new high, but it should also not be ignored, especially along with all the other technical evidence the market has been showing us.

vix

See the original article >>

Why I Won’t Be Buying Gold Anytime Soon

By George Leong

When gold surged to over $1,400 an ounce, I was still not a believer in its potential as a buying opportunity—rather, I thought it was more a trade against the possibility of an expanded conflict arising in Syria.

The gold bugs were suggesting the time for the yellow metal was here again, and I even heard a target price of $1,700 an ounce. Now, with the situation in Syria looking to be resolved, the safe haven’s gains over the past few weeks are beginning to fade away as the price falls below $1,400.

My feeling is that gold could move even lower and back towards $1,300-$1,325 if the Federal Reserve decides to rein in its bond buying at next week’s Federal Open Market Committee (FOMC) meeting. The numerous rounds of quantitative easing and lower interest rates drove down the value of the greenback and created an environment of easy money that helped to drive up the price of gold.

Now, with the Fed’s bond tapering around the corner and bond yields set to edge higher, the U.S. dollar will likely get stronger. And since gold is priced in U.S. dollars, the cost to buy U.S.-denominated gold will increase. The higher expected financing rates will also impact the carrying cost of buying the yellow metal, so I also expect demand to fall, which will help to drive down prices.

In the absence of a strike in Syria, I’m calling for gold prices to decline as we move forward.

The futures market is predicting gold will stay in the $1,300 range until mid-2015 and prices to break above $1,400 by the end of 2015, eventually moving to the $1,500 level by June 2019. That’s nearly six years from now, and with a cumulative 15% upside based on the futures market, I really don’t think I’d be buying and hoping for a big surge.

Spot Price Chart

Chart courtesy of www.StockCharts.com

My thought is that prices will likely hold at the $1,200-$1,300 level and may spike on any negative news that causes investors to flee to safety; otherwise, I feel the upside is limited for the time being.

The chart does show a bullish ascending triangle, but failure to hold around $1,350 could see a breakdown, based on my technical analysis.

With this in mind, the mining sector could continue to face cost issues and the reluctance to explore and develop properties unless there is evidence that gold prices are heading higher and staying there. Based on the futures market, I wouldn’t be that anxious to run and buy gold.

See the original article >>

Big Drop-Off in Mortgage Applications Spells Trouble for Housing Again

By Sasha Cekerevac

Regular readers of this column are fully aware that for the past year I have been calling for higher levels of interest rates. I’ve also stated that higher interest rates will have an impact on the housing market and related stocks.

Well, now we are starting to see my forecast come to fruition, as many mortgage-lending operations are seeing the negative impact of higher interest rates on the levels of mortgage origination’s.

At a recent conference, Wells Fargo & Company (NYSE/WFC) stated that it expects mortgage origination’s (new mortgages and refinancing) will drop approximately 30% in the third quarter versus the second quarter of this year.

While many market experts have held the belief that the housing market can continue its recent upward trajectory regardless of the increase in interest rates, I continue to raise my concerns, stating that my analysis continues to lead me to conclude that this rise in rates will indeed have an impact on the housing market.

With Wells Fargo announcing a 30% drop in mortgage origination’s over just one quarter, that is a significant decrease over a short period of time. JPMorgan Chase & Co. (NYSE/JPM) actually expects to lose money during the second half of this year in its mortgage origination business, as mortgage origination’s are down 40% from the first half of 2013.

While the housing market benefited greatly from the low levels of interest rates over the past couple of years, many of the financial companies have expanded significantly in this sector. I think that we are going to see a reverse now, as firms begin to reduce the number of workers related to the housing market sector.

We already saw Wells Fargo reduce its staff by approximately 3,000 jobs in its mortgage business this summer. I think it’s likely that more financial firms will continue to reduce staff in businesses related to the housing market, as higher interest rates are here to stay.

What does this mean for you as an investor?

Obviously, large financial companies such as JPMorgan have many business sectors, and the housing market is just one subset of their revenue base. However, companies that are more exposed to the housing market, I believe, will be greatly affected by higher interest rates.

Don’t forget: the stock market is a forward-looking mechanism. Investors are estimating future levels of revenues and earnings. What I would look for when it comes to stocks to avoid, or perhaps even sell short, are firms that have a significant exposure to the housing market but no additional lines of revenue or other business segments.

While long-term interest rates won’t continue rising at this pace forever, since the Federal Reserve is anchoring the short-term interest rates and that differential can only widen so much, the higher interest rates will begin to negatively impact the housing market and businesses associated with that sector.

I believe that many investors are overly optimistic about the potential for revenue growth in many companies associated with the housing market, and I would certainly urge caution going forward.

See the original article >>

Employment: Trending Down

by Charles Hugh Smith

The growth rate of employment is declining over time, as positive growth weakens and recessionary declines deepen.

Charts and data provided by longtime correspondent B.C. reflect what many know from first-hand experience: employment is trending down. The growth rate of employment is declining over time, as positive growth weakens and recessionary declines deepen.
Though the 3-year average annual change has improved to near-zero, the 5-year (i.e. longer-term trendline) is still solidly negative.


We can see the trend in this table:
Average annual change of employment age 25-54

                        Women             Men
1990-2000           1.76%             1.34%
1990-2007           1.12%             0.99%
2000-                 -0.31%             -0.32%
2007-                 -0.84%             -1.27%
There are two other trends in employment:

1. Decline of full-time jobs and the rise of part-time jobs

2. Stagnation of high-wage employment and increases in lower-wage job sectors.


State Unemployment and the Growth of Restaurant Employment (CEPR.net)
The sharp rise in retail employment and restaurant work in the latest jobs report continues the pattern where low-paying sectors show the most rapid growth. Also, wage growth has been less rapid in the restaurant sector than elsewhere (0.6 percent over the last year in restaurants compared with 1.9 percent overall).

Industry Employment Trends August 2013 (select either monthly, quarterly or annual changes)
Largest number of job postings: Healthcare, 547,373, a 17% decline
Biggest percentage increase in job postings: Hospitality, 174,757, +34%
Annual declines in job postings:

Education: -5%
Healthcare: -17%
Human Resources: -10%
IT-Information technology: -10%
Manufacturing: -5%
Annual increases in job postings:

Accounting: +6%
Construction: +4%
Financial services: +3%
Hospitality: +34%
Retail: +12%
Transportation: +20%
The job postings confirm the other data that reflect a job market in which demand is concentrated in lower-wage sectors (hospitality and retail) while demand in higher-wage sectors is tepid.
For all the reasons addressed here and many other sites over the years--offshoring, global competition, labor-replacing technologies, the perverse incentives of financialization, structural changes in the economy, etc.--there is no one simple way to boost full-time, higher-wage employment.
If wages cannot easily be increased, the alternative approach is to dramatically lower the cost of living. For more on this, please see The Pareto Economy (February 18, 2013).
Note: blog entries and email will be sporadic for the next few weeks. Your patience and understanding are greatly appreciated.

See the original article >>

Follow Us