Wednesday, September 11, 2013

Learning from Lehman

by Liu Mingkang

HONG KONG – When the US investment bank Lehman Brothers collapsed five years ago, emerging-market economies did not hold many of the toxic financial assets – mainly American subprime mortgages – that fueled the subsequent global financial crisis. But they were deeply affected by the drop in world trade, which recorded a peak-to-trough decline of at least 15%, with trade finance also contracting sharply, owing to a shortage of dollar liquidity. Have policymakers responded appropriately since then?

This illustration is by Paul Lachine and comes from <a href="http://www.newsart.com">NewsArt.com</a>, and is the property of the NewsArt organization and of its artist. Reproducing this image is a violation of copyright law.

Illustration by Paul Lachine

Soon after the crisis erupted, the G-20 countries embraced massive stimulus packages, unconventional monetary policies in the advanced economies, and major institutional efforts, such as the Dodd-Frank financial-reform legislation in the United States and the Basel III initiative to strengthen banking standards. China’s ¥4 trillion stimulus package, unveiled in November 2008, restored confidence in global commodity markets. Led by strong Chinese growth, emerging markets stabilized.

Since 2009, quantitative easing (QE) by the US Federal Reserve has resulted in record-low interest rates around the world. But, while the resulting surge in capital flows to emerging markets stimulated economic growth, it also inflated asset bubbles.

Now, with the Fed publicly considering an end to its massive, open-ended purchases of long-term securities and foreign capital fleeing home from emerging markets, many fear that Asia’s economies could come crashing down, as they did in the late 1990’s. Leverage in some emerging markets’ household and corporate sectors has reached record levels. China’s annual economic growth has slowed to around 7.5%, while Indonesia and India – and, outside Asia, Brazil and South Africa – are experiencing sharp downward pressure on their exchange rates.

Moreover, there has been no major reform of the global financial architecture. China’s renminbi is internationalizing, but its share of global payments remains relatively small, with the dollar retaining its role as the world’s main reserve currency. And, while regulatory reform is progressing, its effectiveness in addressing the weaknesses exposed by the global financial crisis will depend not only on the new rules that emerge, but also on the consistency and quality of their implementation.

There has been commendable progress on the Basel 3 capital requirements for banks, with 25 of 27 Basel Committee members having issued final rules. Likewise, the impact of regulatory changes resulting from major legislation and policy directives in the United States, Europe, and the United Kingdom on banking, insurance, financial-transaction taxes, anti-money laundering, and cyber-space is likely to be substantial.

Although rules on shadow-banking have yet to be formulated, another problem exposed by the crisis has abated: America’s external deficit has shrunk to a much more manageable 2-3% of GDP, accompanied by drops in the surpluses run by Japan and China. Global trade rebalancing has arrived.

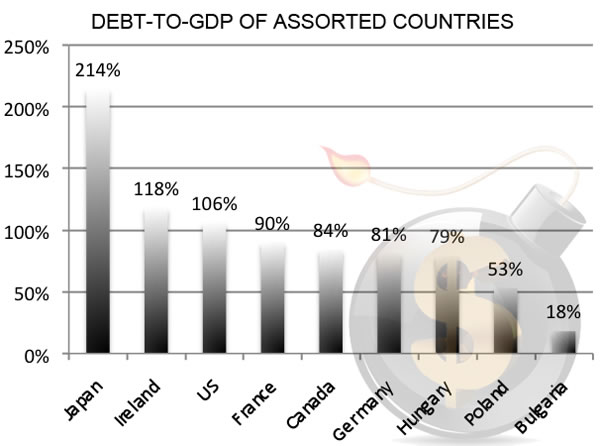
Still, fiscal conditions in the advanced economies remain unsustainable, with many OECD members’ debt levels hovering around 100% of GDP. Japan, which has one of the world’s highest debt/GDP ratios, currently well over 200%, is engaging in a risky experiment with further monetary stimulus to try to target 2% annual inflation. In many advanced economies, both monetary and fiscal policies have reached the limits of their effectiveness.

The key questions now are whether global economic growth is self-sustaining without QE, whether emerging markets’ output will continue to rise strongly, albeit at a slower pace, and whether current global financial-reform efforts will be sufficient to prevent another crisis in emerging markets.

Given the high degree of trade and financial globalization that now characterizes the world economy, there is no doubt that the slowdown in the advanced economies, which account for two-thirds of global GDP, will undermine emerging-country growth. Indeed, the threat to withdraw QE is already having an enormous impact on emerging economies’ asset markets. As real interest rates and risk premia begin to rise, the level of global trade and investment will decline.

In the coming years, emerging markets will most likely struggle with implementation of global financial regulatory standards, which apply mostly to more sophisticated financial markets. They will also confront a rapidly changing external environment and a growing need to manage capital flows more effectively, which will require much closer coordination between central banks and financial regulators.

Indeed, perhaps the most important lesson learned in the aftermath of the collapse of Lehman Brothers is that we can no longer afford to examine problems in terms of individual institutions and from regulatory “silos.” The global economy’s high degree of interconnectivity, interdependence, and complex feedback mechanisms imply that one weak hub can bring down the entire system.

In other words, the world needs a systemic approach to deal with systemic risks and system failures. Unfortunately, there may be little hope of strengthening global financial governance as long as implementation and enforcement of rules remain at the national level.

Like other emerging markets, China is committed to financial stability and playing its role in reforming the global financial system. China was one of the first countries to sign up to the Basel 3 standards, and further renminbi internationalization will be implemented in a prudent and pragmatic manner. Domestic financial reforms will focus on strengthening policy coordination and moving toward market-determined interest rates and exchange-rate flexibility.

All of these steps will contribute to sustainable domestic growth and a more stable global financial system. Other major emerging economies’ policymakers would be wise to act with the same purpose in mind.

See the original article >>

5 Years From Lehman: How The Treasury Thinks It Saved The World

by Tyler Durden

Compare and contrast... "The Treasury's perspective of all the wonderful multiple-mnemonic-based bailouts that 'rescued' us from a fate worse than death and any and all counterfactual worlds" versus the $8 Trillion in additional debt - monetized in large by the Fed - that drove 'recovery' in US (and global) equity prices back to where we started.

The Treasury view (seems like they didn't achieve too much with all their rescue efforts)...

Until The Fed started printing money...

Still - what's another $8 trillion to US taxpayers when the Top Decile can keep growing richer?

See the original article >>

Bear Continuation Patterns - library video 2

By Tothetick Education

Topic: Working Bearish Continuation Patterns with real chart data

Objective: 2nd video in the library

Focus: 1st effort into new resistance creates reverse ...when does it become a bear trend?

Challenge…Piece material video #1 and video #2 together to create the larger picture of market structure.

Big Bull Push to continue trend ~ wall of resistance reverse ~ bear continue trend ~ Base of support reverse ~ bull resume trend…'process flow of market structure'.

Attachments:

  1. Clean screenshot of the chart used in presentation with basic references.
  2. Background price action video #2 - bull trend, reverse, bear trend, reverse, & the ‘rest of the story’.

Please review  the following basic information on continuation patterns as a group and why building on your ability to review price action in various patterns & with different areas of focus increases your learning curve effort & 'stacks your deck'.

Continuation patterns indicate a pause in trend & that the previous direction of the trend will be resumed after the consolidation. The reasons for both continuation patterns & reversal patterns are that the trend, whether it is up or down, cannot continue in the direction in which it is travelling forever. There has to be either a pause in time & in price or a change in price action direction. Visually price action 'creates' chart patterns in different forms or shapes. Learn to correctly identify; & then follow the structural guidelines they offer, & these patterns will subsequently help you to become a successful trader.

The basics of doing any chart analysis are that we know that history repeats itself. Chart patterns take time to form. Reviewing charts allows us to choose an instrument & focus our study on the previous process involved in creating a price Trend as well as what it takes to Reverse or 'turn a trend'. This background research with the anticipation of patterns repeating offers traders confidence. For any trader, trading any instrument, it is highly recommended to do your due diligence & Focus attention on the price history of your chosen instrument.

Bullish/Bearish Continuation patterns as a group offers many trades in any time frame using any instrument and in any market. Their versatility and repetition offers the focused trader many profitable opportunities regardless of trading style. This video is meant to be a starting tool for traders looking to learn how to identify and work bullish/bearish continuation price action using real chart data. For this reason additional videos will be added periodically to this topic to assist traders in an on-going effort in 'putting it all together'.

continuation library vid 2 bear continuation 1 continuation library vid 2 bear continuation 2

See the original article >>

Bear Continuation Patterns

By Tothetick Education

This video is a summation of the process involved in identifying & then trading a Bearish Continuation pattern. The focus is on the opportunities offered from these patterns as a collective group. Note that all the individual patterns in this category are offered independently here on the website with their own video, text analysis, & chart example(s).

Continuation patterns indicate a pause in trend & that the previous direction of the trend will be resumed after the consolidation. The reasons for both continuation patterns & reversal patterns are that the trend, whether it is up or down, cannot continue in the direction in which it is travelling forever. There has to be either a pause in time & in price or a change in price action direction. Visually price action 'creates' chart patterns in different forms or shapes. Learn to correctly identify; & then follow the structural guidelines they offer, & these patterns will subsequently help you to become a successful trader.

The basics of doing any chart analysis are that we know that history repeats itself. Chart patterns take time to form. Reviewing charts allows us to choose an instrument & focus our study on the previous process involved in creating a price Trend as well as what it takes to Reverse or 'turn a trend'. This background research with the anticipation of patterns repeating offers traders confidence. For any trader, trading any instrument, it is highly recommended to do your due diligence & Focus attention on the price history of your chosen instrument.

Bearish Continuation patterns as a group offers many trades in any time frame using any instrument and in any market. Their versatility and repetition offers the focused trader many profitable opportunities regardless of trading style. This video is meant to be a starting tool for traders looking to learn how to identify and work bearish continuation price action using real chart data. For this reason additional videos will be added periodically to this topic to assist traders in an on-going effort in 'putting it all together'.

See the original article >>

95' Update

by Marketanthropology

Click to enlarge images

See the original article >>

Apple unveils iPhones at lower price to combat rivals

By Adam Satariano and Peter Burrows

Source: BloombergSource: Bloomberg

Apple Inc. (NASDAQ:AAPL) unveiled two new iPhones, including a cheaper $99 version in bright colors and an updated high-end device, in a strategy shift by Chief Executive Officer Tim Cook to reach a broader range of customers around the world.

A new iPhone known as the 5C will start at $99 with a two-year contract and will come in five colors, Apple said today at an event at its headquarters in Cupertino, California. The high-end model called the iPhone 5S, which will be available in three colors including gold, will cost $199 to $399 with a two-year contract. The phones will go on preorder on Sept. 13 and be in stores starting Sept. 20.

“The business has become so large,” Cook said. “We’re going to replace it with not one, but two new designs.”

The product introductions underline how Apple, which was a trailblazer when it debuted the iPhone in 2007, is increasingly following the strategy of other smartphone makers that offer handsets in different colors and prices. Until now, Apple only released one new iPhone model every year. As competing devices running Google Inc.’s Android software gain in popularity in the $280 billion smartphone market, Apple is expanding its iPhone lineup to reach more customers.

“The competition has caught up and it’s now purely about how quickly it can innovate and drive its own experience forward,” said Benedict Evans, an analyst with Enders Analysis in London.

Multiple Colors

Apple also said it was adding Japan’s largest carrier, NTT DoCoMo Inc., and that it would have devices available upon introduction in China for the first time. The company is near a deal with China Mobile Ltd., the world’s largest carrier, people familiar with the plans have said.

Each iPhone unveiling is critical for Apple because the handset accounts for about half its revenue. Rivals including Samsung Electronics Co. using Android software have taken market share by offering more handsets in varying styles and prices. IPhone sales trailed the overall smartphone market’s growth in the last two quarters.

Apple is responding with the new iPhones, which made their debut in front of a crowd that included Apple board member and former Vice President Al Gore and Twitter Inc. co-founder Jack Dorsey. Elvis Costello also played toward the end of the event.

The iPhone 5C, which has a plastic casing and a 4-inch screen, will come in blue, green, pink, yellow and white. The iPhone 5S will come in white, black and gold and has a 64-bit chip that the company said will make it work twice as fast as the iPhone 5. It will also have Touch ID fingerprint-sensor technology that is located on the phone’s Home button, which people can use to unlock their phone and confirm purchases from iTunes and Apple’s app store.

Mobile Software

Apple also revamped its mobile software with the introduction of iOS 7, which will be available for free starting Sept. 18. The overhaul includes new sounds, picture-sharing features, and an iTunes radio feature.

At the event, the company said 700 million iOS devices would be sold by next month. Apple added that its Siri digital assistant is “massively improved” and now draws information from Twitter and Wikipedia, among other things.

More new Apple products are expected this year in the run- up to the holiday shopping season. The company is expected to introduce new iPads later this year, people familiar with the plans have said.

Apple shares fell 1.6% to $497.80 at 2:27 p.m. in New York today.

See the original article >>

The US Northeast region struggling with job growth

by SoberLook.com

The US Northeast had weathered the Great Recession a bit better than the rest of the nation. In particular the region's labor market wasn't hit as hard.  The unemployment rate did not rise above 9%,  while the national rate was hovering around 10%. Part of the reason for this difference is that the Northeast's exposure to housing jobs had been lower on a relative basis. 

But as the unemployment rate fell nationally, the improvements in Northeast's labor market did not keep up. The region's unemployment rate is now at or even above the national level.

More recently another indicator began to show relative weakness in the Northeast's labor market. The JOLT job openings rate published by the Bureau of Labor Statistics has stalled recently at the national level. But in the Northeast,  job openings have actually been declining.

With sufficient labor mobility the two should converge over time. But underwater mortgages make moving difficult for many.

For now the labor market indicators show the Northeast lagging the rest of the nation. Going forward it will important to see if this weakness is limited to the region or if it spreads nationally.

See the original article >>

Apple drops as iPhone models reflect shift from pioneer

By Adam Satariano

Apple Inc. (NASDAQ:AAPL) fell the most in almost five months after unveiling two iPhones that were criticized by analysts and reviewers as lacking enough new features or a low enough price to attract a broad range of first-time users.

In a break with the past, when the company introduced one iPhone a year, Apple yesterday unveiled two new models. The iPhone 5C will cost $99 to $199 with a wireless contract and comes in five different colors. A high-end iPhone 5S with fingerprint-security features, a speedier processor and better camera will cost $199 to $399 and be available in three colors. Apple declined as much as 6%, making it the worst performer in the Standard & Poor’s 500 Index.

The devices underscore a shift in the $280 billion smartphone industry, as the novelty of Internet-connected handsets wears off and the gadgets share many of the same basic features. Facing increasing competition from rivals such as Samsung Electronics Co. that offer mobile phones in different designs and prices, Apple Chief Executive Officer Tim Cook is following suit and expanding his company’s own lineup to court more style-conscious customers and users in developing markets.

“We’ve gotten through the first phase of the industry,” said Benedict Evans, a mobile-phone industry analyst at Enders Analysis. “The original vision has been built out. We’re now in a market where Apple is fighting on more equal terms.”

Repackaged iPhone

Apple’s strategy shift includes what is essentially a repackaging of last year’s iPhone 5 in a new polycarbonate casing that comes in blue, pink, green, yellow and white to become the iPhone 5C. The company isn’t pricing the 5C as cheaply as competitors’ handsets, with the phone costing $549 and up without a two-year contract, according to Apple’s U.S. website, showing it’s unwilling to trade its industry-leading profit margins for increased market share.

The shares decreased 5.8% to $465.81 at 10:35 a.m. in New York. Investors had expected a lower price for the iPhone 5C to appeal to more customers in emerging markets like China, according to Brian Blair, an analyst at Wedge Partners Corp. who attended the Apple event.

“Nobody expected it to be this high,” Blair said. “They are clearly saying we aren’t willing to go downstream.”

Even so, Apple is boosting its pool of potential customers. Apple said it was adding Japan’s largest carrier, NTT DoCoMo Inc., and that it would have devices immediately available in China for the first time. The company is near a deal with China Mobile Ltd., the world’s largest carrier, people familiar with the plans have said.

Changing Dynamics

The shift in iPhone strategy is a turnabout for Apple, which has long been the pacesetter in the smartphone market. After Apple co-founder Steve Jobs unveiled the iPhone in January 2007, he upended a market dominated by Nokia Oyj’s feature phones and BlackBerry Ltd.’s keyboard handsets.

As the iPhone gained in popularity to become a preeminent computing device for consumers -- catapulting Apple’s stock to make it the world’s most valuable company -- Google Inc. pushed its Android software with Samsung, HTC Corp. and other handset manufacturers who soon produced touch-screen devices.

Each iPhone unveiling is critical for Apple because the smartphone accounts for about half its revenue. Yesterday’s event was the company’s first major product debut since the iPad mini was introduced last year. Absent new gadgets, Apple’s growth has stagnated, with earnings falling last quarter.

Who’s Who

Apple is responding with the new iPhones, which debuted in front of a crowd that included Apple board member and former Vice President Al Gore, Yahoo! Inc. CEO Marissa Mayer and Twitter Inc. co-founder Jack Dorsey. Musician Elvis Costello also played toward the end of the event.

The new iPhones will hit stores on Sept. 20. The iPhone 5S will come in white, black and gold and has a 64-bit chip that the company said will make it work twice as fast as the iPhone 5. It will also have Touch ID fingerprint-sensor technology that is located on the phone’s Home button, which people can use to unlock their phone and confirm purchases from iTunes and Apple’s application store. Without a contract, the 5S costs $649 to $849, according to Apple’s online store.

The high off-contract prices indicate Apple is still betting customers will pay more for the iPhone, said Sarah Rotman Epps, an analyst at Forrester Research. “They aren’t trying to compete for the bottom of the market,” she said, adding that Apple is keeping its strategy of appealing to the “well-off masses.”

Apple also revamped its mobile software with the introduction of iOS 7, which will be available for free starting Sept. 18. The overhaul includes new sounds, picture-sharing features, and an iTunes radio feature.

At the event, the company said 700 million iOS devices would be sold by next month. Apple added that its Siri digital assistant is “massively improved” and now draws information from Twitter and Wikipedia, among other things.

More new Apple products are anticipated this year in the run-up to the holiday shopping season. The company is planning to introduce new iPads later this year, people familiar with the plans have said.

See the original article >>

Gold and Gold Stocks – Short Term Update

by Pater Tenebrarum

Short Term Technical Conditions Deteriorate Further

It is becoming much more difficult to uphold a short term bullish case for the gold sector, as gold stocks stubbornly continue to underperform the metal. The only consolation regarding this point is that they have done exactly the same during the mild correction correction in the gold price during late July/early August, only to rather unexpectedly roar higher again.

Unfortunately however, this time there is a more pronounced MACD sell signal in gold, although gold has as of yet not fallen below the near term support level at $1350. Here is a look at gold's daily chart – as can be seen, the $1,350 level is quite important from a technical perspective, because a support trendline now intersects with lateral support there. The upturn in gold's 50 dma counts as a positive factor:


Gold, dailyGold spot, daily candles – click to enlarge.


On a 30 minute chart of the active December contract we can see that essentially the post payrolls release gain has been given back (this is the situation at the time of writing). This is why we mentioned that the immediate reaction to the report was not necessarily meaningful.


Gold dec contract, one weekGold December contract, 30 minute candles – click to enlarge.


Nevertheless, gold itself so far continues to look fine on a daily chart. There is nothing extraordinary about the recent pullback. The same is not true of the gold stocks though, which have so far led the metal's recent decline from the late August high:


HUI-dailyThe HUI, daily, with obvious technical negatives indicated – click to enlarge.


We should probably not be too surprised, but the HUI index has actually managed to fall all the way to the lower 'standard' (20/2/0) Bollinger band in the recent decline. There was some hope after the August rebound that this habit may have been discarded. Not so. It is actually fairly normal for stock indexes to  frequently do that, but due the HUI's volatility, it is traveling quite great distances – the index routinely makes percentage moves in the space of a few days that broader market indexes need weeks or months for:


HUI-BollingerThe HUI has once again traveled all the way from the upper to the lower Bollinger band - click to enlarge.


As a result of all this, the recent slightly positive divergence between the gold price and the HUI-gold ratio has been erased, with the latter declining considerably further:


HUI-gold ratioHUI-gold ratio: back to its falling ways … click to enlarge.


Inflation Expectations

We recently discussed the state of US inflation expectations with a friend from Canadian insider trading specialist INK Research, pointing out something we have previously mentioned in these pages, namely that the 'traditional' comparison between TIPs yields and bond yields may at present be distorted due to the recent pressure on these markets from the unwinding of over-leveraged positions. Since TIPs are not as liquid as nominal bonds, forced selling will affect this market segment more than the other, so it may still take some time before one can fully rely on this spread again.

Our friend pointed out to us that there exists an OECD/EU measure of US inflation expectations that is apparently based on an independent survey these organizations conduct and is published by the St. Louis Fed. A recent chart of this measure shows inflation expectations to be higher than those expressed by yield differentials:


EU inflation US surveyOECD/EU measure of US inflation expectations, survey based – click to enlarge.


We intend to keep an eye on this survey and compare it to future developments in the TIPs/bond yields ratio to see whether it is useful.

Conclusion:

The current pullback could well turn out to be another 'bear trap' similar to the one that occurred in early August, but we must stress that one cannot be certain of that in view of the recent technical deterioration. As can be seen in the uppermost HUI chart, there is a now a rising trendline that connects the previous lows, and it may well hold in this pullback. However, there is also a definitive 'the bear isn't finished yet' level in the form of the late June low. We would actually be inclined to come to that conclusion in the event the trendline fails, especially as turning points in the sector often tend to  occur in the October/November time frame if they fail to occur in May. Ideally we are merely witnessing the usual volatility the index tends to exhibit after making medium term lows under very oversold conditions, but we will have to wait and see.

Addendum: September 11

On occasion of the anniversary of the September 11 attack, we want to remember Bill Meehan, with whom we have been in correspondence for several years. Bill worked at Cantor Fitzgerald, the firm that lost more than any other in the attack (658 of its employees, or almost two thirds of its workforce died). Although we never met Bill in person, we considered him a good friend.  Bill was a fount of market wisdom and was extremely generous in sharing his knowledge. Talking to him was always interesting and fruitful. Here is a link to a tribute at TSC, and here is Bill's list of 'Instructions for Life'.

See the original article >>

Poland Confiscates Private Pensions - Yours Are Next

By: Jeff_Berwick

We have been saying for the last four years that as Europe, the US and other Western and global nation-states continue their debt-fueled collapse the governments of these countries will continue to consider their citizens' wealth to be their own and seize more of their assets.

We have, unfortunately, been vindicated already numerous times

  • In March, 2009, Ireland seized €4bn from its Pension Reserve fund in order to rescue its banks. In November 2010, the remaining savings of €2.5bn was seized to support the bailout of the rest of the country.
  • In December, 2010, Hungary told its citizens that they could either remit their private pension money to the state or lose their state pension funds (but still have to pay for it nonetheless)
  • In November, 2010, the French parliament decided to earmark €33bn from the national reserve pension fund FRR to reduce the short-term pension scheme deficit.
  • In early January 2011, $60 million in private retirement funds were transferred to the state's pension scheme in Bulgaria.  They wanted to transfer $300 million, but were denied on their first attempt

And, of course, this spring, Cyprus took it a step further and outright confiscated up to 50% of the funds from bank account holders in that country.

Last week the Polish government announced it would transfer to the state (aka. confiscate) the bulk of assets owned by the country's private pension funds (many of them owned by such foreign firms as PIMCO parent Allianz, AXA, Generali, ING and Aviva), without offering any compensation.

BUT IT CAN'T HAPPEN HERE

Think again if you don't think this will occur all across the Western world until The End Of The Monetary System As We Know It (TEOTMSAWKI).

To begin, the Social Security (or as I call it, the Socialist Insecurity) program in the US is, by dictionary definition, a ponzi scheme.

According to Investopedia: "The Ponzi scheme generates returns for older investors by acquiring new investors. This scam actually yields the promised returns to earlier investors, as long as there are more new investors. These schemes usually collapse on themselves when the new investments stop."

In fact, Social Security is even worse than a ponzi scheme.  At least with a ponzi scheme you have the choice whether or not to "invest" with someone like Robert Madoff.  You aren't forced into it.

Plus, completely fraudulently, the US government shows all Social Security (SS) incoming funds as actual revenue and then immediately spends the money and gives an IOU (unpayable, bankrupt US Treasuries) in return to the SS system.  Let me repeat that: they immediately spend the money and deposit an IOU into what is already a Ponzi scheme. And in past years Congress has held committees to consider nationalizing private pension funds, just as Poland did last week (and held committees on doing it in 2010).

What was the main reason that all these governments such as Ireland, Hungary, France, Bulgaria and Poland began stealing with their citizen's private wealth?  It was because their governments were too indebted vis-a-vis their economy and in order to continue operating (and borrowing) they reached out and just took their own citizens' retirement savings and, in almost every case, mandated that the only assets they can hold is government debt (which will collapse or pay 0-3% at a time when inflation often is running over 10%, meaning a net loss of 4-6%+ per year).

So, let's take a look at the debt-to-GDP of all these countries and a few other Western countries.

As you can see, with the exclusion of France, all the other countries who have outright stolen private pension funds are all in less debt than the Western countries (or those who have bought into Western-style Keynesian central banking democracies like Japan) who have yet to do so.

Why?  It's mostly because the larger Western countries have yet to lose the confidence of the market.  While the smaller countries with tinier economies and less ability to float their currencies as reserve currencies get the attention of the market first.

But, this is very rapidly changing.  Here is the interest rate change of US government debt in the last few months (yearly chart).

The interest rate has nearly doubled in the last four months.  This will have massive repurcussions in all markets... and it will also mean that as interest rates rise the US government will look more and more insolvent by the day.  With $17 trillion in current debt (not GAAP adjusted - GAAP adjusted is over $85 trillion) an interest rate of 10% will mean $1.7 trillion in interest payments alone.  The total tax (theft) revenue base of the US was only $2.4 trillion in 2012.  If interest rates were to rise to 10%, that would mean over 70% of the taxation revenue of the US government would go to paying interest alone.

But, remember, $841 billion of that "revenue" was payments into the Social Security scheme.  No company on Earth would include payments into an employee pension plan as income.  So, the more realistic revenue of the US government was $2.4 trillion minus $841 billion in 2012... or approximately $1.55 billion.  In other words, an interest rate nearing 10% would mean that every semi-legitimate cent of tax revenue for the US government, and more, would go to interest payments on the debt alone.

And so expect the US government and most if not all Western governments to do what has happened in places like Hungary, France, Cyprus, Poland and more... attempt to stay alive a little while longer by taking the assets of their citizens.  And tax-sheltered retirements will be the easiest pickings.

HOW TO PROTECT YOURSELF

Since retirement/pension savings will be the easiest target, immediately divest yourself of as much of those assets as possible -- while they are still assets -- and internationalize them.  Get as much outside of the country with the government that purports to own you and your assets as possible.  I did that in 2008 in Canada and have never regretted it.

If you are not willing or able to cash in retirement/pension savings, look to alternative options.  In the US, for example, you can easily convert your IRA into a self-directed IRA for a few thousand dollars and then you are able to invest in almost any asset worldwide.  You can buy racehorses in Dubai, gold in Switzerland or real estate in Galt's Gulch Chile, just as example.  For advice/info or to turn your current IRA into a self-directed IRA, contact TDVSelfDirectedIRA.com.

A self-directed IRA makes sense for anyone with IRA assets over $20,000.  Below that level it becomes debatable in terms of the cost/benefit ratio.

For those with assets inside or outside (total assets) of an IRA of more than $1 million you should contact TDV Wealth Management for an initial consultation about your options.

And, of course, you can always subscribe to The Dollar Vigilante for the latest news, information and actionable intelligence on surviving the coming dollar (and all other fiat currency) collapse.

Because this collapse is going to be messy.

See the original article >>

Apple.. Eiffel Tower and Wave 3 down about to have BIG impact?

by Chris Kimble

CLICK ON CHART TO ENLARGE

The above 4-pack are all Apple charts, reflecting its on going "Soap Opera" with key highs and lows at important resistance and Fibonacci levels. The Power of the Pattern shared that Apple was up against key resistance that lead to at least a 60%+ declines each time they were hit over the past 30-years. (see post here)

Last year Apple looked to be forming an Eiffel tower pattern (See post here)

Yesterday the Power of the Pattern shared that Apple stock had fallen hard on the introduction of the iphone5 and Apple has best hope its different this time! (see post here)

Remember, its "not the odds of an event happening that is key, its the impact if it does!" Is the jury still out, if Apple has formed an Eiffel tower pattern? Yes!

Could Apple be embarking on an "Elliott Wave 3 Down" in the lower right chart above? To early to tell, yet it could be!  Again, its not the odds of the Eiffel and Wave 3 down that is key, its the impact to Apple if it is!

See the original article >>

Stock Market Setup for a Perfect Storm

By: Anthony_Cherniawski

TNX rallied this morning, instead of declining, as I had reported earlier. This leaves a probable irregular correction, also known as a “running correction.” A breakout may be the catalyst for the SPX reversal as well.

SPX is already in throw-over mode. Those who have “dry powder” may wish to deploy it now, rather than waiting for the reversal. EW structure allow for one more possible probe higher, but the Broadening Wedge trendline may provide final resistance at 1686.00.

NDX reached its daily Cycle Top at 3188.37 this morning. EW resistance is at 3203.28-3210.50. However, don’t leave out round number resistance at 3200.00. The Apple Computer announcement is at 1:00 eastern. That fits my thoughts about a mid-day reversal instead of waiting until the final hour.

VIX is already at the bottom of its Declining Wedge, indicating a reversal may be at hand.

Time to batten down the hatches?

See the original article >>

Energy Factor To Push Gold Price To New Highs

By: Steve_St_Angelo

One of the most misunderstood factors that will impact the price of gold is energy.  Many analysts forecast the future value of gold relative to the amount of fiat money circulating in the system as well as total government treasury and bond debt.  However, the world may not have the available energy supply in the future to satisfy these massive debts.

Gold and silver are monetary metals because they function as a store of "Economic Energy", a term coined my Mike Maloney.  Basically, the precious metals are batteries that store this trade-able energy value.

In the past when a country would print too much fiat money (not backed by gold), economic upheaval would occur as the public lost faith in the currency.  To restore faith back in the system, the government(s) would revalue the price of gold relative the amount of fiat currency in circulation.

Unfortunately, this method will not work this time around as the world may not have the "affordable" energy supply to repay all these debts, regardless if the currencies were backed by gold or not.  That is why it may be more prudent to look at gold's value relative to the price of oil.

An important aspect in determining gold's value is its energy cost.

GOLD DUST:  What the Mining Industry is Now Forced to Produce

There are still many naysayers who don't believe in peak oil or peak anything for that matter.  Their motto is, "Human ingenuity can solve any problem if government stands out-of-the-way."  While I agree with that notion at face value, it still doesn't change the fact that the high quality metals, petroleum energy, materials and timber are now gone forever.

We hear of new gold discoveries that have impressive ore grades of say 6-10 g/t (grams per tonne), but if you could go back in a time machine and show these results to a prospector in the late 1800's... he would laugh at you.  Why?  Because the average gold grades in the world at that time were 25-30 g/t -- almost an ounce a tonne.

If we take a look at the next two charts, we can see just how much yields have declined as well as the huge increase in energy consumption per ounce of refined gold.

Top 5 Gold Miners Production & Average Yield

In 2005, the top five gold producers had an average yield of 1.68 g/t, but by 2012 this had fallen 27% to 1.22 g/t.  The largest gold miners today are extracting gold at 20 times less the yield the world was producing in the late 1800's.  As ore grades decline, it takes a great deal more energy to extract and process the same or less metal.

Top 5 Gold Miners Production & Diesel Consumption

In 2005, the these miners produced 25.2 million ounces of gold and consumed 12.7 gallons of diesel per ounce.  However, by 2012 total gold production declined to 23.9 million ounces while diesel consumption doubled to 25.8 gallons per ounce.

Not only has the actual energy cost increased substantially in the gold mining industry, so has everything else.  Labor, plant, equipment and materials are also impacted by a greater degree due to higher oil prices.

You will notice that while the top 5 companies average yield only fell by 27%, diesel consumption per ounce of gold more than doubled.  So, as ore grades continue to decline, energy consumption will increase exponentially in the future.

The Gold-Oil Ratio is the Key to Much Higher Gold Prices

In my previous article "The Precious Metal Investors Greatest Secret Weapon", I stated the following:

GOLD-OIL RATIO  (Gold at $20.67 in 1932 & $35 in 1936)

1932 = 24 barrels of oil would equal an oz of gold

1936 = 32 barrels of oil would equal an oz of gold

2013 = 14 barrels of oil would equal an oz of gold

During the depths of the depression, an ounce of gold could buy 24 barrels of oil in 1932.  After FDR revalued gold and as the U. S. economy recovered in 1936 (to a degree), it took 32 barrels of oil to equal an ounce of gold.

At the time of the writing of the article linked above (July), the gold-oil ratio was 14 to 1, using Brent Crude as a comparison, while the U.S. West Texas Crude was 12 to 1.  The following figures will be comparing the price of gold to the U.S. West Texas Crude price.

This next chart shows the gold-oil ratio range in the past three years:

Gold Oil Ratio Present and Past

In Aug. of 2011 when the price of gold was $1.850 and a barrel of U.S. crude was $84, the gold-oil ratio was at a high of 22/1.  Presently, the gold-oil ratio is 13/1 with a gold price of $1,370 with a barrel of oil at $108.

Many analysts believe that gold was extremely oversold in Aug-Sept of 2011 when it hit a new high of $1,900.  However, we can see that the gold-oil ratio (22/1) did not surpass the 1932 level of 24/1 at a time when the price of a barrel of oil declined substantially as the U.S. economy was suffering a huge depression.

When gold hit its high in Aug-Sept 2011, the price of oil was only $84.  Today, the price has risen $24 to $108.  As I mentioned earlier in the article, the price of oil greatly impacts the gold mining industry.  Furthermore, in the earlier part of the 1900's, the majority of gold came from underground mines where energy consumption was a much smaller percentage.

So, as the price of oil increases, it will ultimately push gold to new highs:

Oil Price Increases

If we take the current price of U.S. West Texas Crude of $108 as well as higher levels and forecast how it would impact the price of gold at different gold-oil ratios, we can see just how undervalued the yellow metal has become.

The first table calculates what the price of gold would be at a 17 to 1 ratio to oil.  This 17/1 ratio is the medium level shown in the first chart where the average gold-oil ratio falls:

Gold Price At 17 to 1 Ratio

So, if the price of gold was valued at the average gold-oil ratio, the price would be $1,836 at the current oil price of $108.  Moreover, if the oil price increased, we can see how it would impact the value of gold.   Currently, the price of gold ($1,390) is nearly $450 less an ounce than it would be ($1,836) at its average 17/1 ratio to oil.

This huge difference in these two prices smells of market manipulation.

Now, if the gold-oil ratio climbed back to its previous high of 22/1, the price of gold would be substantially higher:

Gold Price At 22  to 1 Ratio

In Aug of 2011, the price of gold was $1,850, a barrel of oil was $84 and the gold-oil ratio was 22/1.  If we apply the same 22/1 ratio to the present price of oil ($108), gold would now be $2,376... nearly $1,000 more than it is today.

Another issue that is not being addressed is the falling EROI - Energy Returned on Invested of energy.  In the 1930's, the U.S. was producing oil & gas at an EROI of 100/1.  Thus, with the cost of one barrel of oil, the industry could supply 100 barrels to the market.  Today, the U.S. EROI of oil & gas is probably below 10/1.  Shale oil is negatively impacting the U.S. energy EROI as its EROI is approximately 5/1.

This means, it takes a great deal more capital and energy to produce a barrel of oil today than it did in the early 1900's.  Furthermore, there is less capital available to the market to invest in other aspects of the economy.  Basically, the falling EROI of energy consumes an ever-increasing portion of the available investment capital in the market.

That is why a Falling EROI of oil will actually push the gold-oil ratio to higher levels.  Why?  Two reasons:

1) As the EROI of energy falls, it becomes more expensive to produce energy.  As gold ore grades decline, it takes more energy to produce the same or less metal.  Both of these factors will continue to push the cost of producing gold to much higher prices.  Thus, increased costs mean higher prices to the public.

2) Because the typical assets that derive their value in a high EROI energy environment (in the past), will become increasingly worthless when the opposite takes place.  For example, Real Estate values (residential, commercial & industrial) will fall as the price of energy increases while the supply decreases.  If an economy has 10-20% less energy in the future... there will be a lot less demand for homes, strip-malls, and industrial warehouse space.

Taking into account all of these variables, I believe we are going to see the 32/1 gold-oil ratio that we had in 1936 after FDR revalued gold.  This may take place by an official revaluation, or due to market forces dealing with much more expensive energy prices on top of falling supply.

This last table provides the gold investor with an idea of how a 32/1 ratio would impact gold at the following oil prices:

Gold Price At 32  to 1 Ratio

At the current oil price of $108, the price of gold would be $3,456 with a 32/1 gold-oil ratio.  If the price of oil moved up to $120 a barrel, the price of gold would be $3,840 at the same ratio.

Even though world governments may attempt to revalue gold to back the huge amount of worthless currency and debts outstanding, this system will not last very long.  There will not be the cheap and available energy supply in the future to generate positive economic growth to pay back these debts.  This is why Gold and silver will become some of the best store of values and investments.

The 32 to 1 gold-oil ratio will turn out to be too conservative when the world switches out of increasingly worthless paper assets and into the precious metals.  We have no idea of what the price or value an ounce of gold would be once the public tries to invest into a market that has an estimated 100/1 fractional reserve.

Lastly, very few investors realize how much energy factors into everything in the economy.  Gold and silver's stored "Economic Energy" is derived from the EROI  energy ratio.  The falling EROI of energy is going to destroy a great deal of supposed wealth in the world.  The best way to protect that wealth in the future will be in physical assets such as gold and silver.

See the original article >>

Coffee falls as Brazilian real shows signs of weakness

By Jack Scoville

COFFEE (NYBOT:KCZ13)

General Comments: Futures were lower in all markets and the Brazilian real showed signs of moving lower again. The cash market seemed relatively quiet. Most Brazil coffee producers are not offering much right now, and few in Central America seem interested in selling. Coffee appears to be available in Central America as farmers and mills clear inventories before the next harvest. Colombia is offering coffee into the cash market at weaker differentials. Buyers are said to be well covered. Current crop development is still good this year in most production areas of Latin America. Central America crop conditions are said to be good overall. Colombia is still reported to have good conditions. Harvest conditions are good in Brazil.

Overnight News: Certified stocks are lower today and are about 2.782 million bags. The ICO composite price is now 112.21 ct/lb. Brazil should get dry conditions. Temperatures will average near to above normal. Colombia should get scattered showers, and Central America and Mexico should get showers and rains. Temperatures should average near to above normal. Colombia produced 770,000 bags of Coffee in August. Production for the last 12 months now totals 9.6 million bags, up 26% from the previous 12 months. In Brazil, Conab expects production to be 47.5 million bags for this year, including 36.7 million bags of Arabica and 10.9 million bags of Robusta.

Chart Trends: Trends in New York are mixed. Support is at 116.00, 114.00, and 111.00 December, and resistance is at 120.00, 122.00, and 125.00 December. Trends in London are mixed. Support is at 1740, 1730, and 1720 November, and resistance is at 1770, 1800, and 1825 November. Trends in Sao Paulo are down with objectives of 134.50 and 123.50 December. Support is at 139.00, 137.00, and 134.00 December, and resistance is at 145.50, 148.50, and 150.50 December.

COTTON (NYBOT:CTV13)

General Comments: Futures closed higher as traders started to get ready for the USDA reports on Thursday. The market had dropped a lot over the last couple of weeks and now the bears are buying out short positions to get even before the reports. Many areas are turning hot and dry again, and this created some buying interest as well. China issued some positive economic data over the weekend to help demand ideas stay afloat after the stronger than expected export sales report from last week. US crop development remains behind due to delayed planting this year, but crop conditions right now are generally good. Weather is warm in the US, with the Delta and the Southeast expecting above normal temperatures into the weekend. Texas is dry and warm. Weather for Cotton still appears good in India. The market is getting ready for the harvest, and any rallies now might be very limited in scope.

Overnight News: The Delta will be dry and Southeast will see a few showers late in the week. Temperatures will average above normal in the Delta and mostly above normal in the Southeast. Temperatures should start to turn cooler this weekend. Texas will see dry weather. Temperatures will average above normal. The USDA spot price is now 81.32 ct/lb. ICE said that certified Cotton stocks are now 0.018 million bales, from 0.018 million yesterday.

Chart Trends: Trends in Cotton are mixed to up with no objectives. Support is at 83.90, 82.80, and 82.30 October, with resistance of 85.05, 85.30, and 86.00 October.

FCOJ (NYBOT:OJX13)

General Comments: Futures closed a little lower as tropical storm formed in the Eastern Atlantic. The storm is not going to come anywhere close to Florida, but it gave traders a reason to buy, anyway. The storm shows that the conditions in the Atlantic might be improving. The historically biggest part of the season is coming up. There are still no real threats showing in the tropical Atlantic for Florida. Growing conditions in the state of Florida remain mostly good. Showers are reported and conditions are said to be very good in almost the entire state. Temperatures are warm. Brazil is seeing near normal temperatures and mostly dry weather, but production areas will turn warmer again this weekend.

Overnight News: Florida weather forecasts call for some showers. Temperatures will average near normal.

Chart Trends: Trends in FCOJ are mixed. Support is at 134.00, 131.00, and 129.00 November, with resistance at 139.00, 140.00, and 142.00 November.

SUGAR (NYBOT:SBZ13)

General Comments: Futures closed higher on reports of less production from Brazil. UNICA said that mills in Brazil's main sugar-cane growing region produced 3.2 million metric tons of sugar in the second half of August, down 3.7% from last year. Ethanol production from the region increased 8.3% to 2.1 billion liters. There is not much on offer in the cash market for now, and that is helping Sugar futures hold the recent range. Processors in Brazil remain more interested in Ethanol production. There is good weather for Sugar production in India, and the crop is expected to be big there. Countries like Thailand and India also expect more production this year, and both countries are actively offering their supplies into the world market. Demand for ethanol has been good. Chinese demand has been soft, but Middle East demand is good. Price appears to be in a trading range for now due to solid demand and big production. Short term trends are now sideways.

Overnight News: Brazil could see dry weather and moderate temperatures. Pakistan will allow exports of 500,000 tons of Sugar this year.

Chart Trends: Trends in New York are up with objectives of 1780 March. Support is at 1740, 1710, and 1700 March, and resistance is at 1765, 1780, and 1810 March. Trends in London are up with objectives of 494.00 December. Support is at 486.00, 479.00, and 475.00 December, and resistance is at 494.00, 496.00, and 501.00 December.

COCOA (NYBOT:CCZ13)

General Comments: Futures closed higher in consolidation trading. There is not much offer now as West Africa is between crops. Ideas are that crop conditions there are generally improving. West Africa is expected to get scattered showers, and conditions there are said to be improving for almost all producers. Temperatures are moderate. The harvest will be getting underway soon. Malaysia and Indonesia crops appear to be in good condition and weather is called favorable. Ivory Coast arrivals are now 1.372 million tons, from 1.359 million last year. Nigerian farmers are drying Cocoa now that rains have passed and the weather has improved. Drying has been delayed over the last couple of weeks from too much rain.

Overnight News: Scattered showers are expected in West Africa. Temperatures will average near normal. Malaysia and Indonesia should see scattered showers, but southern areas could be dry. Temperatures should average above normal. Brazil will get mostly dry conditions and warm temperatures. ICE certified stocks are lower today at 4.504 million bags.

Chart Trends: Trends in New York are up with objectives of 2610 and 2720 December. Support is at 2540, 2525, and 2505 December, with resistance at 2590, 2605, and 2620 December. Trends in London are up with objectives of 1710 and 1770 December. Support is at 1670, 1660, and 1650 December, with resistance at 1710, 1740, and 1770 December.

See the original article >>

Apple Cider

by Marketanthropology

Apple's short-term precarious structure found a near-term catalyst yesterday as Tim Cook unveiled the latest iPhone device to overstretched sentiment and momentum. 
We will be looking to spot the next prospective low as the pendulum inevitably swings back towards those calling Apple over-the-hill and the stock grossly over valued.  
We think not.

Click to enlarge images

For further reading - see our previous Apple notes:
Reboot Complete
Apple Reboots
Apple Picking
Fruit Salad
Apple Turnover
The Universal Law of Gravitation

See the original article >>

The Rise Of The Welfare State

by Lance Roberts

It is interesting to note that while the unemployment rate has been falling, currently at 7.3%, it has not been because of a strongly increasing workforce.  Rather it has been a function of people leaving the workforce.  This, of course, brings up the obvious question of how these people are live if they aren't working.  A recent trip to Walmart answered that question.

As I was standing in line, with an assortment of items on my "back to school" shopping list, there was a Hispanic gentleman in front of me with two shopping carts full of groceries and other items.  The cashier deftly handled the scanning and quoted the final price to the gentleman who reached into his pocket and pulled out his wallet.  What caught my attention was that his wallet was literally about to explode from the amount of cash that was stuffed into it.  My first thought was "Wow, this guy is doing alright for himself."  However, my moment of admiration quickly turned to admonishment as instead of using some of his hoard of cash - he whipped out his supplemental nutrition assistance card.  I literally watched in amazement as the cashier rang up the purchase, handed him the receipt and thanked him for his patronage.  Really?  This guy just loaded up on groceries using my tax dollars and he gets thanked for "his" patronage.  He should be turning around and thanking me instead.

For me, I was stunned.  My first thought was to follow the gentleman out into the parking lot and mug him to get my tax dollars back.  However, quickly realizing my first option was unrealistic and illegal, I turned to the cashier and asked a simple question.  "How often do you see people using food stamps to buy groceries?"   The answer:  "Just about every other person."

Welcome to 'Merica, The Welfare State.

This experience came to mind when I read a great article by Diana Furchtgott-Roth at E21 entitled "When It Pays Not To Work.In this article she cites some alarming statistics:

"Lawrence Lindsey, president and chief executive officer of The Lindsey Group, estimates that if the labor force participation rate were the same today as it was before the recession began, the unemployment rate would be 11.2 percent, rather than 7.3 percent.

One reason for this continuing trend is the panoply of government benefits, including unemployment insurance, now available up to 73 weeks, depending on the state. On average, unemployed Americans can receive 53 weeks of unemployment insurance, up from 26 weeks before the recession.

Over 8.9 million adults received disability insurance from the Social Security Administration in July 2013, the latest data available.  The number of people receiving benefits is 23 percent higher compared to  five years earlier and 55 percent higher than 2003. Benefits are higher, too.  Recipients get an average of $1,129 monthly, 12 percent more than in 2008 and 35 percent more than in 2003.

Over 47 million Americans receive benefits from the Supplemental Nutrition Assistance Program (formerly food stamps), Other elements of the federal safety net include mortgage relief, and Temporary Assistance to Needy Families. The provision of subsidized health care for those earning below 400 percent of the poverty line under the Affordable Care Act, beginning in 2014, will exacerbate this.

These programs have expanded in two ways. Eligibility has increased, and the programs have become more generous."

The chart below shows the rise in social benefits as a percentage of real disposable income which is currently near the highest level on record.

Social-Benefits-DPI-091013

The next chart shows the current number of food stamp participants through June of 2013 at 47.8 million with an estimate of cots that will likely exceed $81 billion.

Food-stamps-091013

The reality is that when an individual can make more living on welfare than working it is quite easy for a mass number of individuals to simply disappear from the work force.  The problem is that such a structural transformation of the workforce is economically damaging long term.

Diana summed the problem up well.

"The shrinkage of the labor force has profound implications for future economic performance.  Reduced economic growth will lead to steadily higher tax burdens on existing workers, which will in turn discourage labor force participation. This race to the bottom needs to be stopped."

She is absolutely correct.  As I showed in my recent missive on long term economic growth we are already experiencing the lowest rate of annualized economic growth in history.  With an aging population rapidly moving towards retirement; the structural employment imbalance will lead to far more economic ills in the not so distant future as the drain on welfare programs intensifies as people continue to leave the workforce.   As Diana correctly stated "The race to the bottom has to stop."   However, as long as the current administration continues to push more support programs, bailouts and extensions of benefits; it simply makes it more profitable to stay at home and live off "government cheese."

See the original article >>

As S&P 500 Earnings Double from Five Years Ago, Rising Interest Rates Spell Disaster

By Sasha Cekerevac

As I’ve been stating for most of the past year, interest rates will rise, and this will have a significant impact on the markets. But the real question you have to ask yourself is why are interest rates rising?

If these rates were rising due to a much stronger economy, this would actually be bullish, as corporate earnings would also be increasing. But interest rates, I believe, are increasing as the market is now adjusting to a more “normal” environment and pricing in the exit of the Federal Reserve.

This will have an impact on corporate earnings, as firms have benefited from the extremely low interest levels. According to Bloomberg, the costs of borrowing for S&P 500 companies was only 1.4% of sales over the past year, a record-low during the 11 years that these data have been kept. (Source: Bloomberg, September 2, 2013.)

Not only is the expense of higher interest rates going to reduce corporate earnings, but many companies have borrowed to fund share buybacks and dividends. This will also begin to decrease as interest rates rise.

Since revenue is not accelerating and costs associated with higher interest rates are beginning to rise, this squeeze can only mean a lower level of corporate earnings growth.

This is not something to be taken lightly. Historically, a huge part of total returns results directly from cash being returned to shareholders in the form of dividends and buybacks. With increasing costs from higher interest rates, shareholders will get less money back, and the higher costs will result in lower levels of corporate earnings.

This is a significant paradigm shift that we have to take into account over the next decade. Much as investors have been used to 20 years of ever-lower interest rates, this new shift to higher interest rates will create an environment that is quite different than what we’ve experienced in the past.

Traditionally, companies that issue dividends and buyback shares outperform the market. If interest rates rise and begin to curtail these activities, we then have to look at purely increasing revenues to generate higher levels of corporate earnings.

In this economic environment, that is easier said than done. While margins have increased tremendously over the past few years, these, too, are in question. Can the pace of margin expansion continue over the next decade?

Clearly, companies are in an extremely strong position, with very strong balance sheets. Corporate earnings growth for the S&P 500 is expected to exceed $110.00 next year, as compared to only $60.00 in 2008.

This level of corporate earnings growth has partially stemmed from cost-cutting, as well as the low levels of interest rates obtained on corporate debt. Both of these factors appear to have run their course, and at this point, I would focus on stocks that have the ability to increase revenues going forward.

It is the companies that are essentially a commodity, unable to differentiate their products, that will be at the mercy of both increased competition and higher interest rates; thus, they will be unable to increase their revenues and face higher costs associated with increased rates.

Firms that are able to differentiate their products should be able to maintain strong margins, generating corporate earnings growth, on a relative basis, even if interest rates continue rising. These are essentially Warren Buffett-style companies—ones with giant economic moats that create a business edge and, ultimately, create shareholder value.

See the original article >>

Oil pulls back as Syria risk premium evaporates

By Phil Flynn

President Obama is looking for a way out as are oil bulls that were betting on a Middle East disaster. Risk premium came out of the market and for at least in the near term the market may start to focus of more traditional fundamentals. The President said that he is going to give diplomacy a chance and that is why oil (NYMEX:CLV13) got hammered along with products. Yet behind the drama and behind the hyperbole, what we saw on the oil front really was historic. We are seeing a change in the way we assess risk in the global oil market and how we make up for threats to supply.

While many people might have been shocked by a report by the Energy Information Administration historic report on U.S. oil production and exports, readers of the Energy Report were not. We already told you that the United States was acting as a global swing producer in the latest crisis. The U.S. Energy Information Administration confirmed what we have been telling you by pointing out that the amount of unplanned lost oil production came to about 2.7 million barrels per day in August, which was the biggest global shortfall in almost two years. Libya and their ongoing labor dispute caused half of that loss and the last time this happened the International Energy Agency was forced to release light sweet crude from its reserves to feed the European refiners and quell a spike in crude that caused WTI to spike to $114.83 and Brent to more than $126 dollars a barrel. The reason why this spike in price didn’t happen this time with the threat of World War III and the drop in production was the surge in U.S. oil production. U.S. crude-oil output will spike to a whopping 15.1% to 7.47 million barrels a day an all-time record. This spike has allowed the U.S., with the help of near record Saudi Oil production, to temper what would have been a disastrous spike in global oil prices. Even OPEC had to admit that the market at present remains well supplied despite production drops by Libya and Iraq, but instead of thinking about cutting production they instead are worrying about declining market share.

This also means that we will have to view our weekly petroleum supply reports with a different perspective than we have in the past. The focus on inventories will change because with booming production, refiners will be less reliant on inventory instead of building a cushion of supply to protect them from a drop in imports. In other words, we will go from pipeline to refiner and then to the export market or for domestic use. We should be less stressed that for example diesel inventories supplies are near low levels. It does not make as much sense to store oil and product and incur that cost when there is ample production. We can flourish with much smaller inventories than we have had to in the past. You are reading this here today — in the next days and weeks you will be reading this everywhere else!

Of course who needs oil when you can get Panda poop? The National Geographic reported that panda poop can help power the greener vehicles of tomorrow.  Scientists say that Pandas eat plants yielding microbes that efficiently turn plant waste into biofuel—and the research just might help protect pandas at the same time. "We have discovered microbes in panda feces might actually be a solution to the search for sustainable new sources of energy," Mississippi State University biochemist Ashli Brown, who led the study, told attendees at a meeting of the American Chemical Society (ACS) Tuesday. "It's amazing that here we have an endangered species that's almost gone from the planet, yet there's still so much we have yet to learn from it. That underscores the importance of saving endangered and threatened animals." Biofuels made from corn, soybeans, and other edible crops cause concerns over their potential impact on food supply and prices. Some even argue that such biofuels ultimately may produce even more carbon emissions than petroleum.

Today on September 11th we stop to remember a day when not only was a building attacked but an attack on human decency! We continue to pray for all of those that have been impacted by that heinous act. The attack on freedom will never succeed because it is an attack on the human spirit itself.

See the original article >>

Follow Us