Friday, July 5, 2013

Are The 1970s Coming Back?

by Tyler Durden

The mid-1970s have been a useful template for what is possible (and even probable) in a centrally-planned world. As a reminder, the underlying backdrop was also similar (major economic downturn following the housing crashes in 1974-75 and again in 2006-2007 followed by aggressive Fed policy which was ultimately too loose for too long). It is quite clear, Citi notes, that the rally in the Dow has lasted longer than the “road map” would have suggested - at least in part driven by the ongoing expansion of the Fed’s Balance sheet - but with Taper talk increasing we wonder how long before the 70s are back in vogue.

See the original article >>

US, EMG nations are on different economic cycles - adding to pressure on developing economies

by SoberLook

Emerging markets are under pressure once again. The Turkish lira is touching new lows, driven by a number of factors, including civil unrest in Egypt and more importantly rising rates in the US. Turkey also surprised investors with a higher than expected inflation reading of 8.3%.

USD/TRY (Turkish lira per one dollar; source: Investing.com)

The Indian rupee touched a new low of 61 and currencies are weakening elsewhere in emerging markets as well - as capital flight continues.
Bond yields are moving up across the board, just when emerging markets nations can least afford it. The HSBC emerging markets composite PMI index hit the lowest level since 2009, showing stagnating growth in developing economies.

Source: Markit

What makes this particularly troubling is that the US and emerging market nations are on a different economic cycle. As US rates rise, many emerging nations in fact need interest rates that are stable or lower. Brazil for example does not need government bond yields above 11% right now. But that's exactly what the nation is dealing with for maturities longer than three years.
Moreover, liquidity in emerging market bonds has collapsed as market makers exited. Just as the case with US corporate bonds (see post), US dealers no longer hold significant inventories of emerging markets bonds (thanks to the Volcker Rule). At the same time international investors' holdings of emerging market debt have been at historically high levels. Remember that most bonds don't trade on an exchange - they are over-the-counter products that require market makers for the market to function well. So when people call their broker to sell that emerging markets bond ETF, there are not many people to buy the actual bonds on the other end. That makes selloffs sharp and disorderly, forcing more active investors to run for the exits.

See the original article >>

Permanent Employment Stagnation?

by Aziz

Paul Krugman says that we may have reached a “depressed equilibrium” that unemployment may remain elevated for a long, long time to come:

We had what felt like an epic intellectual debate over austerity economics, which ended, insofar as such debates ever end, with a stunning victory for the anti-austerity side — and hardly anything changed in the real world. Meanwhile, the pain caucus has found a new target, inventing dubious reasons for monetary tightening. And mass unemployment goes on.

So how does this end? Here’s a depressing thought: maybe it doesn’t.

True, something could come along — a new technology that induces lots of investment, a war, or maybe just a sufficient accumulation of “use, decay, and obsolescence”, as Keynes put it. But at this point I have real doubts about whether there will be events that force policy action.

First of all, I think many of us used to believe that sustained high unemployment would lead to substantial, perhaps accelerating deflation — and that this would push policymakers into doing something forceful. It’s now clear, however, that the relationship between inflation and unemployment flattens out at low inflation rates.

Last week, I wrote a piece arguing much the same thing:

It is also possible that we have reached what John Maynard Keynes called a “depressed equilibrium” where capital continues to be hoarded and not used to raise employment levels back to the pre-crash norm, and grow the economy out of the slump. With a private sector awash in debt and refusing to take on more to act as a source of growth, the only other agency with the ability to borrow and spend the economy back to growth is the government.

As the rate of technological growth accelerates, the chances of a technology shock that greatly increases investment seems to rise. New technologies coming onto the market in the coming years — lower-cost photovoltaic solar, 3-D printing, synthetic fossil fuels and more exotic things like asteroid mining — have a lot of potential to create a lot of demand. Yet, just as advanced manufacturing technologies have done in the past, they may end up destroying more jobs than they create. This could further accelerate the big post-2008 redistribution trend — falling wage and salary incomes and rising corporate profits as a percentage of GDP:

This general trend toward the obsolescence of labour is worrying. With less and less demand for labour in the economy due to things like robots, computerisation and job migration we could see more and more people sitting around doing nothing and collecting unemployment cheques. Perhaps this is the accidental fulfilment of the leisure society that Keynes envisaged. As humanity has gotten better at fulfilling our material needs, it takes less labour to do so. The unemployed are caught between a rock and a hard place; social and governmental expectations that able-bodied people should work, up against the economic reality that the demand for labour just doesn’t exist.

Without a technology shock or other exogenous shock, there may be another route out of the depressed equilibrium, and mass unemployment. I am not entirely convinced by Krugman’s argument that high unemployment won’t produce systemic price deflation. With core inflation at its lowest point in history in the United States and falling it does appear possible that the deflationary trend is beginning to accelerate even as headline unemployment gradually creeps down. This has after all been the norm in Japan for the last twenty years. With accelerating deflation, it seems much likelier that we will see both monetary and fiscal policy throwing money at lowering unemployment. But in the long run, if the trend toward the obsolescence of labour continues, this may only buy some temporary respite for the unemployment. In the long run, individuals, governments and society may have to adjust attitudes toward work and employment and adapt to a new normal encompassing less work, and more leisure.

See the original article >>

Slow-Motion U.S. Recovery Searches for Second Gear

by WSJ

See the original article >>

Dollar Gold Correlation - All The Wrong Reasons!

By: Darah_Bazargan

While most 4th rate analysts unwittingly misdirect you into watching for a big dollar collapse and cling on to its alleged correlation to gold, all you have to do is look back a year and see their relationship is worthless. The gold trade has been an obvious disappointment and its most recent breakdown through 1320 has brought about a ‘think tank’ infested with analysts fetching for all sorts of reasons that seem rational for calling a bottom. None of which are true--and of course these same analysts that tell you to keep an ‘open mind’ are the ones mentally blocked from knowing the characteristics of a downtrend. And they’ve been sending you emails and newsletters for months saying this “JUST MAY BE the TIME” we have reached the final low!

As you all know the reality has been much different, with every rally being met with tremendous selling pressure, giving you no indication of a possible bull market. Did you ever think that once the bull gets underway and reaches 3200, they will all tell you it’s time to get out?? The same crowd of forecasters that were keeping you in at $2000 have ridden the bear “A L L- T H E W A Y- D O W N” to these current levels, still claiming every oversold condition is just a pullback to a much bigger uptrend! I’m sure after 22 months it will be that ‘conspiracy theories of manipulation’ or some ‘finishing wave count’ are the reasons.
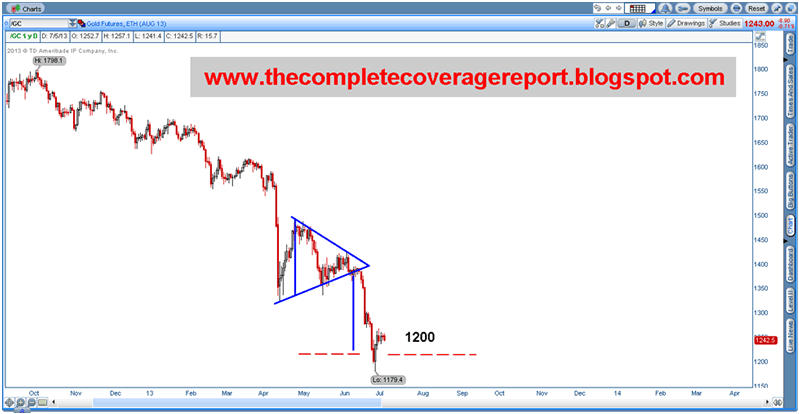
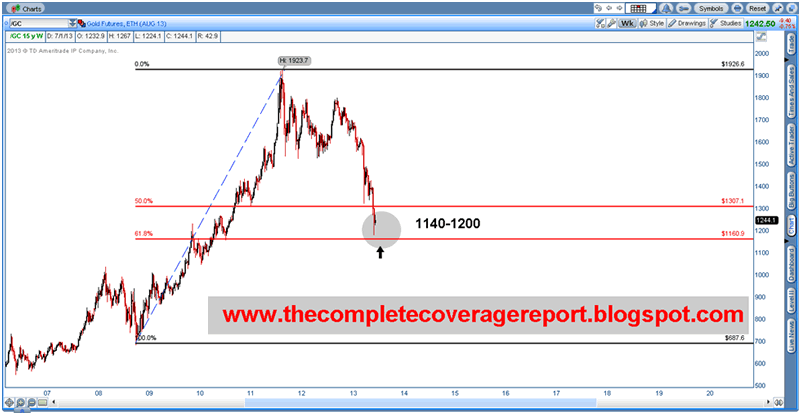
Truth is, once you break the apex and have a lower low you add the width of the triangle from the breakdown point to get the measured move. This shoots for a price target of 1200, which is a minimum expectation, but perhaps on the next failing rally we will see a climax low to 1140.

That also would have price return to the 61.8% area from the lows of 2008 to the highs of September 2011 and a good place for an extreme reversal bar to appear.

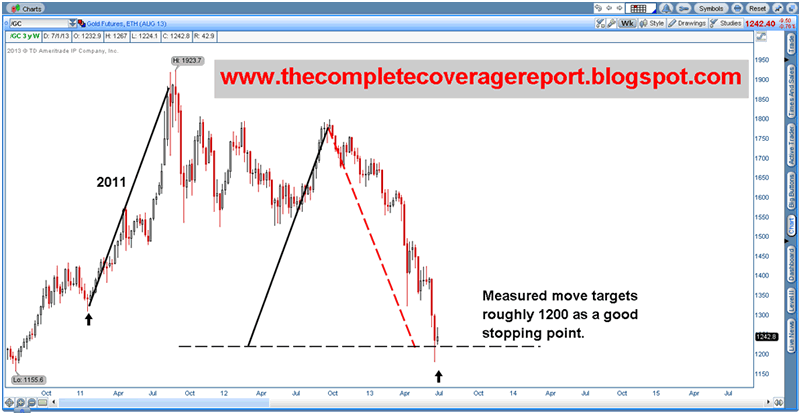
Here too is a potential fold back measured move from the point the trend went parabolic in 2011, to where we are now in the current downtrend. Notice that the parabolic uptrend of 2011 equals the parabolic downtrend of 2013 in size and that it happens to fall in the vicinity of these same target lows. Not to mention, the downside volume is now much lighter which is a sign that most of the selling pressure is being absorbed by central bankers and giant institutions controlling the demand.

Most people lose money in downtrends because they have no strategy, they become instant long term buyers, and, they must ‘wait it out’ only to recover 70% of their losses, if they’re lucky. Timing the market is not the same as ‘time in’ the market and you should know that after a price base of 4 to 5 weeks your odds of ‘a bottom’ is more likely. Or basically draw a horizontal line from 1200 out, and even with giving five or so percentage points to account for volatility it won’t be a surprise to see in a couple of weeks that price will be trading flat. We are hovering above extremely tough support on all time frames, and once 1350 is regained, the bull market will launch!

See the original article >>

Gold market report: gold down on upbeat US jobs data

by James Hickling

Better than-expected US jobs numbers have sent the dollar higher (the Dollar Index at a three-year high of 84.50 as of writing) and gold and silver lower. The Labor Force Participation Rate also ticked up for the month, though as the chart below – courtesy of ZeroHedge – makes clear, in multi-decade terms we’re still at distinctly unimpressive levels as far as this particular measure is concerned. Unemployment remains at 7.6%, though the underemployment rate rose from 13.8 to 14.3%.

Labor Force Participation Rate

Stocks have also risen, while US Treasury yields have shot higher on expectations that this report will lead to “tapering” from the Fed sooner rather than later.

The Fed may slow its purchases of securities later this year; though it’s worth remembering that jobs data is a lagging indicator. And with money supply growth in the US stalling, signs of a serious slowdown in China and emerging markets, and the eurozone expected to contract this year, this could prove to be the high-water mark of the current economic cycle. Moreover, the US economy and banking sector cannot shoulder a significant rise in interest rates, so the Fed cannot get too hawkish as far as quantitative easing is concerned.

All of this – combined with the relative strength in the dollar versus other currencies – suggests that Bernanke and his successor will continue to err on the side of loose monetary policy, with all the implications for the absolute value of the dollar that that implies.

True Money Supply

Next week

Next Wednesday sees the release of German inflation numbers and the minutes from the Fed’s June 18-19 FOMC meeting. French CPI numbers and an update from the Bank of Japan follow on Thursday. A quiet week as far as economic data is concerned.

See the original article >>

Cocoa moves higher as demand seen weak

By Jack Scoville

COCOA 

General Comments: Futures closed higher despite ideas of good harvest weather and active movement of beans to ports in western Africa. Reports of dry weather in Ivory Coast that could hurt development supported the market. Internal prices are reported weak in much of Africa on ideas of weak demand. The weather is good in West Africa, with more moderate temperatures and some rains. It is hotter and drier again in Ivory Coast this week, but the rest of the region is in good condition. Ivory Coast is starting to see showers, but will need more rain soon. The mid crop harvest is about over, and less than expected production along with smaller beans is reported. Malaysia and Indonesia crops appear to be in good condition and weather is called favorable.

Overnight News: Scattered showers are expected in West Africa. Temperatures will average near to above normal. Malaysia and Indonesia should see episodes of isolated showers. Temperatures should average near normal. Brazil will get mostly dry conditions and warm temperatures. ICE certified stocks are lower today at 4.873 million bags. ICE said that 23 delivery notices were posted today and that total deliveries for the month are 372 contracts.

Chart Trends: Trends in New York are up with objectives of 2260 September. Support is at 2200, 2170, and 2130 September, with resistance at 2250, 2280, and 2300 September. Trends in London are mixed. Support is at 1440, 1420, and 1360 September, with resistance at 1470, 1490, and 1520 September.

COTTON

General Comments: Futures were higher on follow through buying. It was a low volume session with the holiday yesterday, and today could be a low volume session as well. Futures held the short term range. It is possible that futures can work lower again as demand has turned soft. Ideas of better production conditions in the US caused some selling interest. Texas is reporting light precipitation, mostly in southern areas. Dry weather is being reported in the Delta and showers and storms are seen in the Southeast. The weather should help support crop development in the Delta and Southeast, and could help in Texas. Weather for Cotton appears good in India, Pakistan, and China.

Overnight News: The Delta should be dry and Southeast will see showers and rains. Temperatures will average near to above normal. Texas will be mostly dry. Temperatures will average near to above normal. The USDA spot price is now 82.78 ct/lb. ICE said that certified Cotton stocks are now 0.623 million bales, from 0.623 million yesterday. ICE said that 53 notices were posted today and that total deliveries are now 2,515 contracts. USDA said that net Upland Cotton export sales were 34,.500 bales this year and 41,500 bales next year. Net Pima sales were 2,900 bales this year and 1,700 bales next year

Chart Trends: Trends in Cotton are mixed. Support is at 86.20, 85.20, and 84.00 October, with resistance of 88.00, 88.20, and 89.70 October.

FCOJ

General Comments: Futures closed higher for one more day. There has been little selling pressure on the market since the dramatic move lower, but some may develop son as futures are closer to resistance areas. Better weather in Florida seems to be the big problem for the bulls at this time. Showers are reported and conditions are said to have improved in almost the entire state. Ideas are that the better precipitation will help trees fight the greening disease. No tropical storms are in view to cause any potential damage. Greening disease and what it might mean to production prospects continues to be a primary support ítem and will be for several years. Temperatures are warm in the state, but there are showers reported. Brazil is seeing near to above normal temperatures and mostly dry weather, but showers are posible later this week.

Overnight News: Florida weather forecasts call for showers. Temperatures will average near to above normal. ICE said that 0 delivery notices were posted today and that total deliveries for the month are now 0 contracts.

Chart Trends: Trends in FCOJ are mixed. Support is at 130.00, 125.00, and 122.50 September, with resistance at 135.00, 138.00, and 139.00 September.

COFFEE

General Comments: Futures were lower on a weaker Brazilian Real. The cash market remains very quiet. Sellers, including Brazil, are quiet and are waiting for futures to move higher. Buyers are interested on cheap differentials, and cheap futures. Brazil weather is forecast to show dry conditions, but no cold weather. Current crop development is still good this year. Central America crops are seeing good rains now. Colombia is reported to have good conditions.

Overnight News: Certified stocks are near unchanged today and are about 2.745 million bags. The ICO composite price is now 116.67 ct/lb. Brazil should get dry weather except for some showers in the southwest. Temperatures will average near to above normal. Colombia should get scattered showers, and Central America and Mexico should get showers, and rains. Temperatures should average near to above normal. ICE said that 2 delivery notices was posted against July today and that total deliveries for the month are now 809 contracts.

Chart Trends: Trends in New York are down with no objectives. Support is at 117.00, 116.00, and 113.00 September, and resistance is at 125.00, 126.00, and 127.00 September. Trends in London are mixed to up with objectives of 1835 nd 1900 September. Support is at 1755, 1720, and 1705 September, and resistance is at 1855, 1870, and 1900 September. Trends in Sao Paulo are down with no objectives. Support is at 140.00, 137.00, and 134.00 September, and resistance is at 150.00, 151.00, and 155.00 September.

SUGAR 

General Comments: Futures closed lower on a weaker Brazilian Real. Ideas are that mills had not had time to amass more Sugar due to a delayed harvest in Brazil because of rains and also because they are concentrating on producing ethanol. Futures might try to work lower this week. There is still talk that a low is forming or has formed for at least the short term, but there is still a lot of Sugar around, and not only from Brazil. The Indian monsoon is off to a good start and this should help with Sugarcane production in the country. But, everyone is more interested in Brazil and what the Sugar market is doing there. Traders remain bearish on ideas of big supplies, especially from Brazil. Traders in Brazil expect big production to continue as the weather is good.

Overnight News: Showers are expected in Brazil, mostly in the south and southwest. Temperatures should average near to above normal.

Chart Trends: Trends in New York are down with objectives of 1640 and 1580 October. Support is at 1620, 1600, and 1570 October, and resistance is at 1665, 1690, and 1715 October. Trends in London are mixed to down with objectives of 475.00, 465.00, and 448.00 October. Support is at 476.00, 475.00, and 470.00 October, and resistance is at 490.00, 496.00, and 499.00 October.

See the original article >>

Joe Friday-King Dollar hasn’t done this in 8-years! Bullish for stocks?

by Chris Kimble

CLICK ON CHART TO ENLARGE

King Dollar hasn't been able to "Close on a Monthly basis" above line (1) for the past 8 years. The US$ is working on a breakout above this 8-year line and is breaking above the top of the bullish ascending triangle, both at (3) in the chart above.

Most would think a US$ rally would be bearish for stocks and it was for almost 8 years! The chart below reflects from 2003 to 2011 (pink shaded area) the US$ and the S&P500 have been non-correlated (moving in opposite directions. Since 2011 the two have been correlated (moving in the same direction). 

CLICK ON CHART TO ENLARGE

Joe Friday.... The US$ is working on a breakout above an 8-year resistance line. (Since the top chart is of monthly closing prices, a true breakout would take place on a close above this line.)  For the breakout of the US$ to be negative, this high degree of correlation needs to end!

See the original article >>

An Option Trader’s View of New Highs in the S&P 500 Index

by J.W. Jones

Every investor and novice trader is looking for a newsletter that exemplifies the holy grail of investment acumen. It would seem that so many newsletters promote their latest or greatest trade idea. If the trade idea works, readers get quickly reminded of the analyst’s success. However, failed predictions about future price action in stocks typically are ignored by the analyst in subsequent articles.

I do not make wild predictions about the future prices of anything; much less make suggestions that are not based first on option chain derived probabilities. In fact, I spend most of my time studying probabilities that are driven by implied volatility calculations in the equity options marketplace. From an option standpoint, I would characterize myself as a volatility trader. I focus on equities which have implied volatility levels that are significantly higher than their historical norm.

Obviously I do take trades that are directional in nature, but I am typically contrarian in my view of the marketplace. I use very little technical analysis because most studies are not profitable consistently because of their inability to remedy the passage of time as a function. This more simply can be described as a false signal that is generated due to consolidating or choppy price action. When you hear the term price action moderated as a function of time rather than price, many times indicators and oscillators have thrown off failed signals that lead to losses.

Instead of having my screens full of indicators and analytical tools, I spend most of my days looking at option chains and price charts. My view of the marketplace is simple. Sell when prices are near recent highs and buy when prices are near recent lows.

As an example, recently I heard an analyst on television say that the S&P 500 would get to 1,700 by the end of the year. Instead of listening any further, I pulled up an S&P 500 Cash Index (SPX) option chain and looked at the December Quarterly contracts for more clarification.

Chart1(1)

As can be seen above, based on current implied volatility level calculations the analyst has a probability of being correct based on the July 2, 2013 close of about 28%. As shown below, in order for price to get to the 1,700 price level by the end of 2013, we would need to take out the all-time highs set back on May 22, 2013.

Chart2(1)

I have identified the key price levels on the chart above which ultimately have an impact on the short to intermediate term price action in the S&P 500 Cash Index. However, what is more important to understand is that the probabilities are not overwhelmingly favorable that a move to 1,700 will take place that holds through the end of the year.

Based on current market conditions, the odds of us taking out the all-time highs before 12/31/2013 are a little better than 1 out of 4. In reality, these numbers indicate that any perma-bulls out there should be cautious.

However, the short-term bulls out there or those analysts that are pontificating about new all-time highs being set in the near future need to consider the July monthly option expiration probability data which is derived yet again from implied volatility calculations.

As of the close of trade on July 2, 2013 the probability that the S&P 500 Cash Index (SPX) will close above 1,700 on Friday, July 19,2013 is less than 1.76%. The July monthly SPX option chain shown below highlights this important information.

Chart3(1)

I want to be clear that these probabilities change every day based on price movement and changes in the underlying asset’s implied volatility levels. However, what does not change are the standard deviation calculations that govern this data.

Based on the closing data for the S&P 500 Cash Index (SPX) on July 2, 2013 a one standard deviation move to the upside (68% Probability Price Stays Below This Strike) would be the 1,635 SPX July Calls.

Based on the closing data for the S&P 500 Cash Index (SPX) on July 2, 2013 a two standard deviation move to the upside (95% Probability Price Stays Below This Strike) would be the 1,685 SPX July Calls.

Based on the closing data for the S&P 500 Cash Index (SPX) on July 2, 2013 a three standard deviation move to the upside (99% Probability Price Stays Below This Strike) would be the 1,715 SPX July Calls.

While this data does not reveal precise expectations for future price action in the S&P 500 Cash Index (SPX), it does shed context on the wild predictions some of these television and newsletter analysts provide. In financial markets anything is possible, but I will continue to trade using statistical analysis that has been proven to be effective over long periods of time when large quantities of trades are taken.

I prefer analysis that is backed by statistical studies versus a quantity of indicators that all have their own set of limitations. While the probabilities are not always going to be favorable, over long periods of time the numbers will solidify the trading results.

While there is much more to my strategy than just this basic explanation, I was hoping that readers could come to understand that there is a mathematical way to use statistical analysis to enhance trading results.

See the original article >>

Meridian Market Update

by Marketanthropology

Two possibilities given the interest rate backdrop and equity market structure, should the SPX fail at finding traction for a third time since making all time highs at the end of May. Certainly, we would consider the scale of the 1994 equity market cascade the more likely outcome. With that said, long-term support from the Meridian is now found ~ 1560 which was initially tested and held in June.
Break below that level coming into August and the bears would roar once more. 

Click to enlarge images

Click to enlarge images

See the original article >>

L’enfer, c’est les autres: othering in Eurosceptic discourse

By Simon Usherwood

Euroscepticism-EUIn recent years, euroscepticism has become an ever-more visible part of the process of European integration, from the decline in public support to the pronouncements of political parties and governments. This scepticism is clearly wide-ranging and diverse, drawing on the full spectrum of political and social positions: it is hard to think of an ideological standpoint that doesn’t have something critical to say about the European Union. Self-evidently, euroscepticism isn’t an ideology itself, but rather a site for other ideologies to express themselves, often for reasons of political profiling or competition.

Often this simple fact is obscured by the way that both European and national elites have treated scepticism, as a marginal and inconsequential position, which creates a false impression of commonality of substance. But while the substance is not common, the tools of scepticism often are – a similarity that becomes apparent when one considers the recurrent use of othering in sceptical discourse.

Othering is simply the creation of an antithesis, an ‘other’, both to characterise and caricature it. In particular, by creating an ‘other’, you also necessarily create a ‘self’: put differently, a ‘them’ needs an ‘us’. What we see with eurosceptics is that their notion of ‘us’ undergoes an important shift around the time of the Maastricht treaty in the early 1990s, with some deep ramifications.

Before Maastricht, sceptics – relatively rare though they were – tended to place themselves in the middle of a series of overlapping identities: themselves (as individuals or a group), their country and ‘Europe’. Their strategy of othering was to place the then European Community as a distinct and marginal identity, without legitimacy to overlap fully with ‘Europe’. This allowed them to connect their position and their rhetoric to the international level – both in Europe and more widely.

To take just one example, Margaret Thatcher could talk as she did in her 1988 Bruges speech about the EC as “one manifestation of that European identity, but it is not the only one.” Even if most of the language in her speech was about “we British”, she did explicitly challenge the EC’s status, charging it with heterodox behaviour: “it is ironic that just when those countries such as the Soviet Union…are learning that success depends on dispersing power and decisions away from the centre, some in the Community seem to want to move in the opposite direction.” With such an approach, it is then unsurprising that she concluded by calling for “us” to regain control of both the EC and ‘Europe’.

However, the arrival of the European Union with the Maastricht treaty changed this fundamentally. While sceptics still identified themselves with their country, ‘Europe’ became highly contested: the Union was henceforth seen as the dominant expression of ‘Europe’, closing down the space for the sceptics to use it. Mundanely, we see this in the proliferation of the ‘euro-‘ prefix to pretty much anything one can think of, as well as the name of the single currency itself.

The language post-Maastricht is that of threat. From Viktor Orban’s statement (in March last year) that Hungary would ‘not become a colony’, to the endless confusion of the ECJ and the ECHR, ‘Europe’ is no longer a safe rhetorical space. In the UK, the UK Independence Party (UKIP) typifies the resulting sense of marginality best, when they talk in their 2010 manifesto of how “We will no longer be governed by an undemocratic and autocratic European Union or ruled by its unelected bureaucrats, commissioners, multiple presidents and judges.”  Even when there is push-back on this – as with the right-wing Jean-Pierre Chevènement during the 2005 French referendum on the Constitutional treaty, “A French ‘no’ to the ‘European constitution’ would not be a ‘no’ to Europe, but a republican ‘no’ to the abandonment of popular sovereignty” – this has not stopped the process.

The result is that ‘Europe’ as a frame of reference becomes problematised as an identification point for sceptics, and indeed makes it harder for them to challenge critiques and attacks on them being either nationalistic or even xenophobic. Moreover, sceptics become more and more bound to buy into the EU’s model of identification and hence define themselves as the ‘other’. Whereas pre-Maastricht it was the EC that was in this position, its (apparently) sudden increase in powers made it less a side-show to more general international cooperation and more of an existential threat.

Two main points arise from this.

Firstly, it highlights the mutability of frames and the power of language. We might reflect on how this process has helped to underpin the embedding of the integration process among publics and the way this creates a logic of naturalness to the Union.

Secondly, it returns us to the starting point, namely the diversity of euroscepticism. If there is to be a meaningful engagement with sceptics, as I would argue is necessary for the Union to have any future, then we need to understand how this shift in othering has conditioned both sides’ thinking and their sense of being. Jean-Paul Sartre’s idea that it is the things we detest that make us is one that finds a very practical application here.

See the original article >>

Canadian Dollar Analysis - Potential Emerging Trade

By: Michael_Noonan

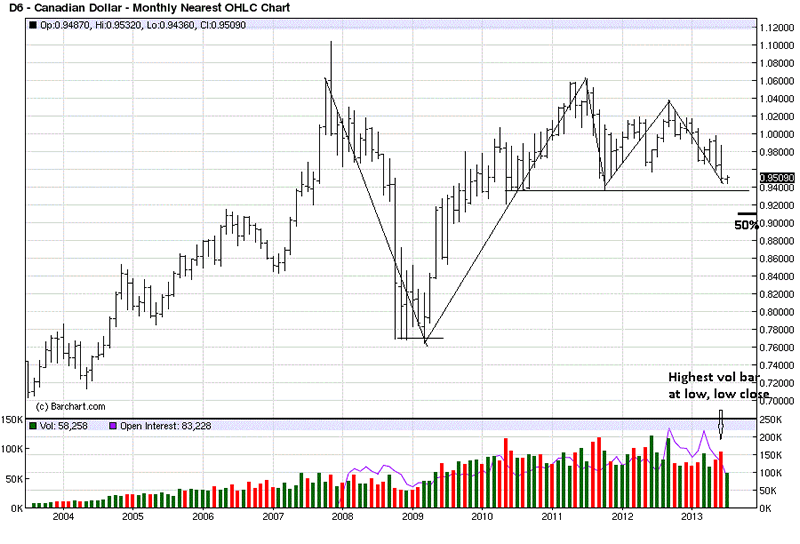
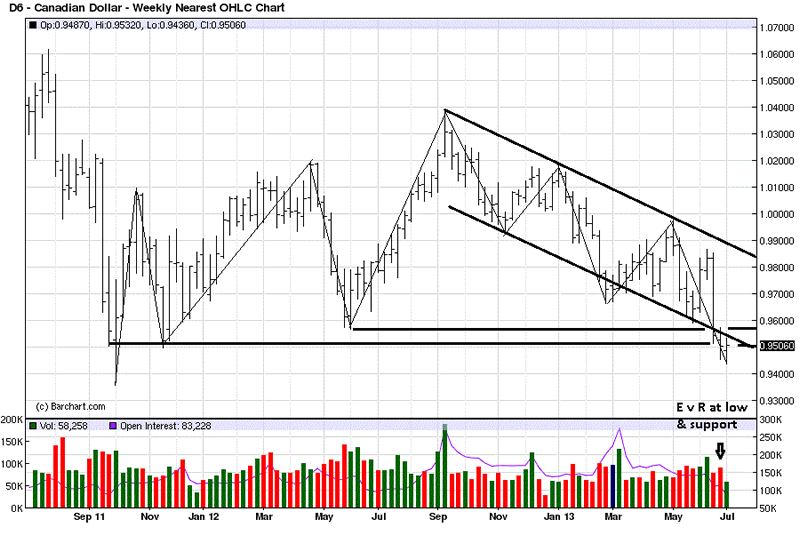
The volume activity recently caught our eye in the Canadian dollar and prompted a closer look. Our position is that by following the developing market activity, across a series of time frames, a story about a potential trade should emerge. What follows are our rough draft charts, without comments on them, beyond a few initial observations, going from one time frame to another. All that matters is the conclusion drawn from them.

Trend is always of primary consideration, and the daily seems to be at cross-purposes for positioning in harmony with the trend. Acknowledged and considered.

Had a 15 or 25 year span been chosen for the monthly chart, it would be clearer that this higher time frame is up. There is currently a sideways Trading Range, [TR], in progress, but note that it is well above a 50% retracement of the 2007 high to 2009 low range. A half-way retracement is a more general observation. When a correction holds above it, it is viewed as overall strength.

Red volume bars indicate when price closes lower than the previous one. The volume for June was the highest “down” volume in over a year, while at the same time, price is declining into an area of support from mid-2010 lows.

It is too soon to know if there will be downside follow-through, for July has just begun. For that possible answer, we look at the lower time frames.

We are calling the weekly trend a non-trend, a TR within a larger up trend. At present, price has declined to the lower area of the TR, which should act as support. When we look at the increased volume lower as price is declining, a closer inspection shows the last down volume bar, second from right, was greater than the previous week’s down volume, third bar from right.

The contrast between the two is stark. The 3rd bar from right clearly shows downward ease of movement, and on the lowest volume in several weeks. We attribute that to a lack of demand with sellers in control.

The next bar down, 2nd from the end, has a stronger increase in volume, but the range of the bar was about one-third the size of the previous one, and price was right at important TR support. This bar tells us that buyers stepped in and stopped the effort of sellers cold. The increased selling effort did not result in a move lower. This price area is being defended, and the increased volume is from “smart money,” buying whatever weak- handed sellers and stops are offering.

Smart money buys low and sells high. Weak hands and speculators are always on the other side. It is not an accident that the character of developing market activity turned more positive at a point where support would be expected to hold. It is usually a smaller risk consideration to buy within the lower 25% of a TR.

Also, notice the time factor from the May 2012 low and rally to the September 2012 high, 14 weeks. Since that swing high, it has taken 42 weeks for price to reach the current swing low, if the current low holds. Price declines faster in a down market than rallies. We see the opposite within this developing TR. This leads us to conclude that it is accumulation in preparation to go higher. We can always be wrong, but the risk/reward consideration, while price is at obvious support, is favorable.

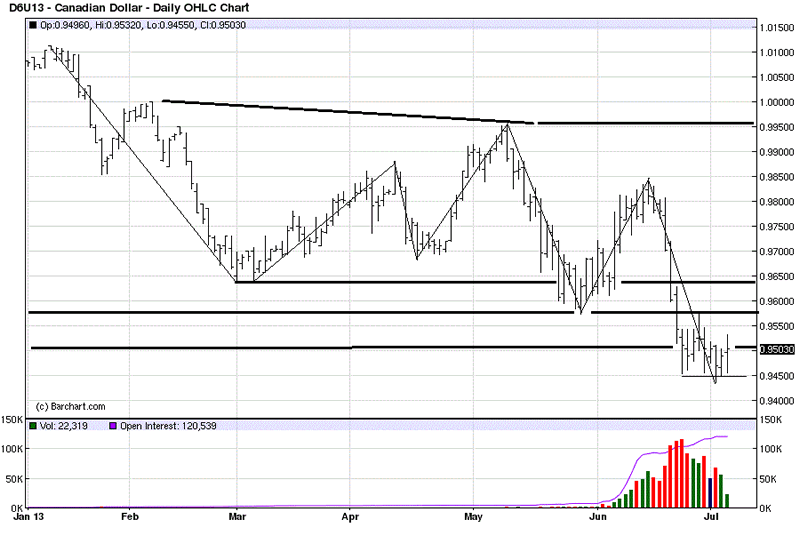
The two dark horizontal lines at the bottom are support from the weekly chart. What stands out on the daily, and in support of the two higher time frames just discussed, is the highest level of selling activity volume comes at the lows of the decline. If it were smart money selling, the volume would have been greater higher up, for smart money does not sell into/at support. The risk/reward does not make sense, at that level.

[This is the Sep contract, so volume from mid-June and earlier would have shown up on the June contract.]

Also worth noting is how price has since moved sideways and not lower, in response to the increased level of selling activity. A look at the composition of the current trading range confirmed the logic of the developing “story,” up to today’s activity.

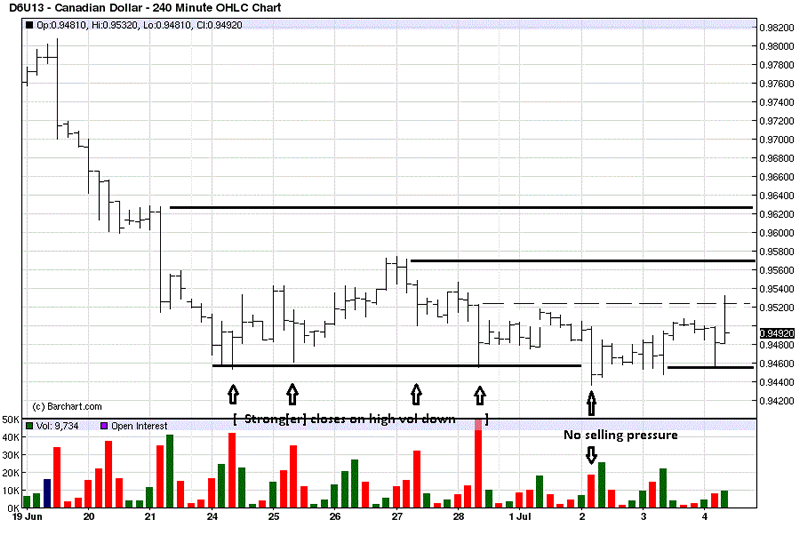
Professional forex traders use a 240 minute chart, primarily because it is a global market, and that time frame is more inclusive. High volume activity always bears watching to see what message market participants are sending.

The first four highest volume bars, [arrows], show closes lower than the previous bar, usually a form of selling, otherwise, the close would be higher. Look at where the closes are located for each of those “selling” bars: upper end to mid-range. On the highest volume activity for this lower-end developing TR, the close was mid-range, or a draw between buyers and sellers.

When price is at recent lows, who do you expect is in charge? Sellers. When the highest volume effort produces a draw, can it be said sellers are in control? Absolutely not. It was the effort from buyers that prevented sellers moving price lower, so from that point of view, it was more than a draw for buyers.

The last arrow down bar shows ease of movement lower, and in fact, price breaks the TR support from recent lows. Two things happen: 1. volume declined, which is a sign of less selling pressure, and 2. zero downside follow-though. Seven bars later, we see a rally on increased volume that erases the downside volume at the low.

Following the logic of developing market activity over four different time frames, each had a “story” to tell that gave credence to the next lower one, and the conclusion we draw is that price is undergoing accumulation, specifically at the lower support of the developing TR. If that turns out to be true, it makes sense to be long.

Hence, the buy recommendation today at 95.00. Stop at 94.22. From this point, we need to see future developing market activity to confirm this analysis. We could be timely; we could be early. There may still be another test lower, for anything can happen.

There is no question that buying within an established up trend is preferred and so much “easier.” Bernard Baruch once said, “You make money buying straw hats in January, [when nobody wants them."].

See the original article >>

The Breakout Trap

by Sam Seiden

Last week, a classic bull trap had been developing that we were going over in some of our trading rooms at Online Trading Academy. It reminded me of an article I wrote a while back. Below are some parts of that article, explaining last week’s bull trap and this week’s opportunity.

Before you read on, let me make perfectly clear that I am a huge animal lover! The polar bear and the seal…the crocodile and the wildebeest…the professional trader and the novice trader… What do these three relationships have in common?

Follow up:

One is the hunter and the other is the hunted. Polar bears are white just like the icy snowy areas of the world they live in. Seals spend much of their time in water under a sheet of ice but have to come up for air at some point. When they come up for air, it is typically through a hole in that sheet of ice. Each breath however is potentially a life or death action because often, there is a polar bear waiting at that hole in the ice for his or her dinner, the seal. A seal has choices as there is always more than one hole to choose from but they better chose wisely for if they don’t, the hole they chose will be a “trap” set by the polar bear and that will be the last breath the seal takes. Wildebeest live on land but have to find water to drink in order to survive. They too have choices as to which bodies of water to drink from. One lake or river is clean, cool water, void of any danger. The other may very well have a crocodile waiting just below the surface, waiting for the wildebeest to come drink. One is opportunity to drink, the other is a trap that leads to a quick death for the wildebeest and a nice hardy meal for the croc. No, this is not some National Geographic article and again, I am a big animal lover.

When it comes to trading and investing, the hunter and hunted relationship is no different than in the wild only the end result typically does not lead to end of life. Make no mistake about it, there is a winner and a loser, nothing in between. There are many invitations to buy into a market. Some are opportunities that lead to low risk and high reward buying opportunities that end up being very profitable trades. Others are traps that lead to losses for the hunted and profits for the hunter. One of the most favorite and high probability trades we like to take in the Futures Extended Learning Track (XLT, our live trading rooms) is the Bull Trap or Bear Trap. For today’s piece, let’s take a look at classic Bull Trap that happened last week and one that can happen again this week.

The opportunity was to short the S&P into a supply level. The specific strategy is the Bull Trap as you can see on the chart below. Notice the two supply levels on the chart on the left, the yellow shaded areas and origin of supply zone lines (S&P 60 minute chart). This is a price level where willing supply exceeds willing demand. How do we know this? Simple, price could not stay at this level and had to decline away. Again, it declines because supply exceeds demand at that level. We wrap two lines around those levels and carry them forward because we want to remember where supply exceeds demand because that is where price is likely to stop rallying and turn lower in the future when it reaches that level.


Click to enlarge

This is a Bull Trap shorting opportunity for the following reason. Notice the chart on the right… This is a 15 minute chart of the S&P showing the price action inside the red circled area on the 60 minute. Notice the sideways trading followed by the breakout to the upside. Most novice/retail traders will buy this upside breakout because that is what they are taught to do and because as price is basing sideways, the assumption is that price will break higher which tends to get people thinking bullish.

A bit later, the breakout happens and a rush of buying came into the market as expected. However, that simply brought price up to larger time frame solid supply which is where the smart money is selling. Price then begins to decline and ends up falling fast because retail traders were caught on the wrong side of the market, a Bull Trap.

For this week, we would look for another shorting opportunity should the S&P trade up into that supply area. The same holds true for the NASDAQ. Just keep in mind that this would be the second time price would reach these levels of supply so the odds are not as strong as the first.

If you’re going to compete in the game of trading, make sure you have an edge or you will lose your money to someone who does. This game is a transfer of accounts from those who fall for professional “traps,” into the accounts of those who can identify “traps.” It’s the old hunter and the hunted. I do apologize if I have offended anyone with what may seem like harsh analogies but the truth is, I meant to send a strong message because the average person loses money trading and that’s not ok with me. They lose because they don’t have the edge the professional does and they don’t even know it. Learn to spot the difference between traps and opportunities.

See the original article >>

Li Keqiang’s Bottom Line

by Zhang Jun

SHANGHAI – Everyone is talking about China’s economic slowdown. Last year, Chinese GDP growth reached a 13-year low, and no upturn is in sight. But, as Premier Li Keqiang seems to recognize, this trend could actually be beneficial, spurring the structural reforms that China needs to achieve its longer-term goal of more balanced and stable GDP growth.

This illustration is by Paul Lachine and comes from <a href="http://www.newsart.com">NewsArt.com</a>, and is the property of the NewsArt organization and of its artist. Reproducing this image is a violation of copyright law.

Illustration by Paul Lachine

Recent assessments have offered a downbeat picture of the world’s second-largest economy. In its latest Global Economic Prospects report, the World Bank cut its 2013 economic growth forecast for China from 8.4% to 7.7%. Moreover, recently released central-bank data show that Chinese banks increased their lending by only about ¥667 billion ($108 billion) in May – a roughly ¥125 billion decline from the same period last year.

But simply lending more would not improve the situation. Given that outstanding loans already amount to nearly double China’s GDP – a result of the country’s massive stimulus since 2008 – new loans are largely being used to pay off old debts, rather than for investment in the real economy. Thus, the more relevant concern is that the balance of outstanding loans has not risen.

In recent years, tight monetary policy and increasingly strict controls on the real-estate sector have caused the growth rate of fixed-asset investment to fall, from more than 25% annually before 2008 to around 20% today. Furthermore, the growth rate in China’s less developed eastern regions amounts to less than half of the national average. As a result, growth of industrial value added – which contributes almost half of China’s GDP – is slowing even faster, from an average annual rate of 20% during China’s boom years to less than 10% in 2010-2012 and just 7.8% in the first quarter of this year.

The key to restoring China’s GDP growth is, therefore, returning fixed-asset investment growth to at least 25%. With a new round of stimulus, China’s excess production capacity and underused outlays (for example, built-up real-estate assets) could be mobilized immediately, restoring 9% annual GDP growth.

But the willingness of China’s new leadership to initiate another round of growth-securing stimulus depends on what rate of GDP growth Li can tolerate. With China’s leaders having offered no indication that they will change current monetary policy, some economists have estimated that Li will not act until GDP growth falls below 7%.

The reason for Li’s inaction emerged in early June, when Chinese President Xi Jinping told his American counterpart, Barack Obama, that China had deliberately revised its growth target downward, to 7.5%, in order to pursue structural reforms aimed at supporting stable and sustained economic development. Given that China was moving toward such reforms before the 2008 global economic crisis prompted former Premier Wen Jiabao to launch his ¥4 trillion stimulus plan, Xi’s statement suggests that the new government will seek to restore the economy’s pre-2008 fundamentals.

In 2005, China was experiencing currency appreciation, which, as other fast-growing economies in East Asia have demonstrated, can stimulate the government and businesses to pursue structural reforms and industrial upgrading. But the subsequent increase in official fixed-asset investment – which rose by 32% in 2009 alone – delayed structural reforms, while over-capacity and a real-estate bubble became even larger and more deeply entrenched problems.

The government must now dispel the remaining vestiges of the stimulus-fueled over-investment of 2008-2010, however painful it may be. This means allowing the economy to continue to slow, while maintaining relatively tight macroeconomic policies that force local governments and the business sector to find new sources of growth.

The combination of external shocks and internal pressure from rising wages can serve as a powerful incentive for governments and businesses to pursue structural reforms. For example, firms in China’s export-dependent coastal regions have been burdened by renminbi appreciation since 2004. When the economic slowdown hastened the relocation of many manufacturers to inland provinces or neighboring countries, those in the coastal regions began to call for increased openness, deeper structural reforms, and industrial upgrading.

The view that Li will tolerate slower growth only above a particular threshold is based on the belief that GDP growth below 8% would hurt economic development more than it helped, and lead to social instability. And, indeed, if unemployment pressure had become as acute today as it was in the 1990’s, the prolonged economic slowdown would undoubtedly have precipitated government intervention.

But, over the last decade, structural changes to China’s economy have caused unemployment pressure to decline significantly – a trend that can be corroborated by across-the-board wage increases. Now, the setting is very favorable to build the stronger, more stable economy that Li wants – and that China needs.

See the original article >>

The Global Trust Deficit

by Peter Blair Henry

NEW YORK – In their preoccupation with fiscal deficits, developed-country policymakers continue to neglect a different, yet equally critical, shortfall: the trust deficit between advanced and emerging economies when it comes to global governance.

This illustration is by Tim Brinton and comes from <a href="http://www.newsart.com">NewsArt.com</a>, and is the property of the NewsArt organization and of its artist. Reproducing this image is a violation of copyright law.

Illustration by Tim Brinton

For decades, developed-country shareholders at the International Monetary Fund and the World Bank used loan conditionality to spur economic reforms – often including contentious fiscal-austerity measures – in the so-called Third World. Through pragmatic, sustained reform efforts, countries like Brazil, China, and India turned their economies around to achieve stunning increases in GDP growth – from an average annual rate of 3.5% in 1980-1994 to 5.5% since then.

But, although developing countries now account for more than half of global GDP growth, advanced countries have yet to admit them to leadership roles that reflect their growing influence in the world economy.

The failure so far of the US Congress to ratify the IMF reform package agreed to by G-20 finance ministers and central-bank governors in 2010 is the latest breach of trust – one that makes the promise of adequate representation for emerging economies seem like a shell game. America’s unwillingness or inability to ratify the package – which includes doubling the IMF’s funding quota and shifting 6% of the new total, together with two directorships, to developing countries – undoubtedly contributed to the decision by the BRICS (Brazil, Russia, India, China, and South Africa) to establish their own development bank.

In fact, a backlash against Western hegemony in global governance has been brewing for years, with developing countries increasingly turning away from the IMF in favor of creating alternative, regional sources of funding. The Association of Southeast Asian Nations (ASEAN), together with China, Japan, and South Korea, established the Chiang Mai Initiative in 2000, and Latin American countries launched negotiations on the Banco del Sur in 2006.

The accelerating erosion of emerging economies’ trust in the Bretton Woods institutions is particularly problematic now, given slow growth and continued economic weakness in advanced countries. While the world economy is expected to grow by 3.3% this year, average annual growth in the advanced countries is projected to be just 1.2%.

Developed and developing countries alike would benefit from greater economic-policy coordination. While regional groups may obtain some short-run benefits by pursuing narrower interests outside of multilateral channels, neither emerging nor advanced economies can fulfill their long-run potential in an environment characterized by isolationism and a zero-sum mentality in areas like trade and exchange-rate policy.

Policy coordination, however, depends on trust, and building trust requires advanced-country leaders to keep their promises and offer their developing-country counterparts opportunities for leadership. Instead, developed countries have been taking actions that compromise their legitimacy.

For example, after spending decades encouraging developing countries to integrate their economies into the global market, advanced countries now balk at trade openness. Indeed, despite pledges not to erect trade barriers after the global economic crisis, more than 800 new protectionist measures were introduced from late 2008 through 2010. G-8 countries, the supposed champions of the global free-trade agenda that dominates the World Trade Organization, accounted for the lion’s share of these measures.

Some question the leadership ability of the BRICS. But many emerging markets are already leading by example on important issues like the need to shift global financial flows from debt toward equity. Mexico, for example, recently adopted – ahead of schedule – the changes in capital requirements for banks recommended by the Third Basel Accord (Basel III), in order to reduce leverage and increase stability.

For too long, developed countries have clung to their outsize influence in the international financial institutions, even as their fiscal fitness has dwindled. By ignoring the advice that they so vehemently dispensed to the developing world, they brought the world economy to its knees. Now, they refuse to fulfill their promises of global cooperation.

Leaders in developed and developing countries alike must deepen their commitment to economic reform and integration. But only by giving emerging economies a real voice in global governance – thereby reducing the trust deficit and restoring legitimacy to multilateral institutions – can the global economy reach its potential.

See the original article >>

How Gold Lost Its Luster, How the All-Weather Fund Got Wet, and Other Just-So Stories

By Ben Hunt

"Gold is money. Everything else is credit."
John Pierpont Morgan

"The relationships of asset performance to growth and inflation are reliable – indeed, timeless and universal – and knowable, rooted in the durations and sources of variability of the assets' cash flows."
Bob Prince, Co-Chief Investment Officer, Bridgewater Associates

Like every middle-aged white guy I know, I am a big fan of Rudyard Kipling. I grew up on his Just-So Stories and as an adult found that his novels and poems spoke to me, as they did to my father and his father before that. Kipling writes simply, directly, and evocatively. Whether it's a poem, a short story, or a novel, the man knows how to tell a story. He was the youngest winner of the Nobel Prize in Literature (as well as the first English-language recipient), and after a too-long period of disfavor in the academy he now enjoys a well-deserved renaissance of interest and acclaim.

But there is also no doubt that what Kipling wrote was used by political and economic entities of his day to support their own self-interests. As George Orwell said, with wildly popular poems like "The White Man's Burden" he was the "prophet of British imperialism." Was he a simplistic rah-rah tout for the rewards of Empire? Not in the least. There is tension, nuance, and respect for the human condition in everything Kipling wrote, at least that I'm aware of. And this is exactly why he was such an effective prophet, such an effective Narrator for mainstream British policy in the first three decades of the 20th century. Kipling's skill as an author allowed British citizens to feel good about themselves and to support their government's policies without requiring them to check their brains or their scruples at the door.

These are the hallmarks of effective Narratives – they have an intrinsic ring of truth ("truthiness", to use Stephen Colbert's wonderful phrase) that speaks to us on an intellectual and emotional level AND they coincide with the goals and preferences of powerful political and economic entities. Neither of these qualities is inherently a bad thing, whatever "bad" means. Nor is the content of a Narrative necessarily less truthful because it helps serve broader interests, whatever "truthful" means. Questions of truth and falsehood, good and bad, are impossible to assess from the informational content of the Narrative itself and are only meaningful in the broader context of human society at some given point in time. Kipling's work gave a voice to the orthodoxy of foreign policy Common Knowledge in 1905 and the anti-orthodoxy of foreign policy Common Knowledge in 1965, even though Kipling's words themselves never changed. In both eras, the Narrative of Imperialism – pro in 1905, anti in 1965 – was highly relevant to political and economic entities, which gave the world a public lens to interpret Kipling's work. Today no one cares about the Narrative of Imperialism. It is a dead Narrative, like Manifest Destiny or Cultural Revolution. What Kipling wrote 100 years ago is largely irrelevant for the Narratives that shape our world today, which is probably what allows his work to be better appreciated for how it moves us on a personal level.

The Narrative of Gold was relevant 100 years ago and, unlike the Narrative of Imperialism, it remains relevant today. But like the Imperialism Narrative in 1965, it has morphed from a centerpiece of Common Knowledge orthodoxy into the foil or antithesis for a more modern, ascendant Narrative. Just as the Narrative of Imperialism was supplanted by the Narrative of Self-Determination, so has the Narrative of Gold been supplanted by the Narrative of Central Banker Omnipotence.

So long as the Narrative of Self-Determination was useful to powerful political and economic entities, the Narrative of Imperialism was relevant as well. It's much easier to make an argument for something when you have something to argue against. But when the Narrative of Self-Determination lost its usefulness (not coincidentally with the end of the Cold War), so did the Narrative of Imperialism fade away. Today the Narrative of Central Banker Omnipotence is extremely useful to powerful political and economic entities, which means that the Narrative of Gold is important, too. Gold is just not important in the same way that it was important 100 years ago, and that shift in meaning makes all the difference in understanding the price of gold.

What "Jupiter" Morgan said about the primacy of gold above all other stores of value rang true to almost everyone when he said it. Did his public statements in support of the gold standard also serve his own self-interest? Absolutely. The US Treasury bought 3.5 million ounces of gold in 1895 from the House of Rothschild and … J.P. Morgan, using funds from a massive (for the time) 30-year bond issue syndicated by … J.P. Morgan. In a highly unusual (i.e. unconstitutional) move, this bond issue was carried out by the White House without any Congressional approval, under the authority of a forgotten Civil War era statute that was identified by … J.P. Morgan.
But while there's no question that the bond sale and subsequent gold purchase lined Morgan's pockets and served the interests of the rich and powerful considerably, there is also no question that these moves effectively ended the Panic of 1893. Why? Because everyone knew that everyone knew that gold was money. And now the US Treasury had lots of it. Huzzah! Confidence is restored as the Republic is saved by Grover Cleveland and Jupiter Morgan.

To be sure, the Narrative of Gold as told by J.P. Morgan was not accepted at the time by everyone as good or wise policy, any more than the Narrative of Imperialism as told by Kipling was accepted by everyone as good or wise policy at the time. Political oratory being what it was back then, in fact, William Jennings Bryan famously compared the imposition of the gold standard as the equivalent of "crucifying mankind on a cross of gold" at the Democratic national convention of 1896 and was nominated by acclamation as his party's Presidential candidate. This despite Bryan being only 36 years old (the youngest Presidential candidate in American history) and despite Grover Cleveland, the outgoing President who bought the gold from Morgan and Rothschild, being a Democrat and the standard-bearer of the party. Clearly that must have been one hell of a speech!
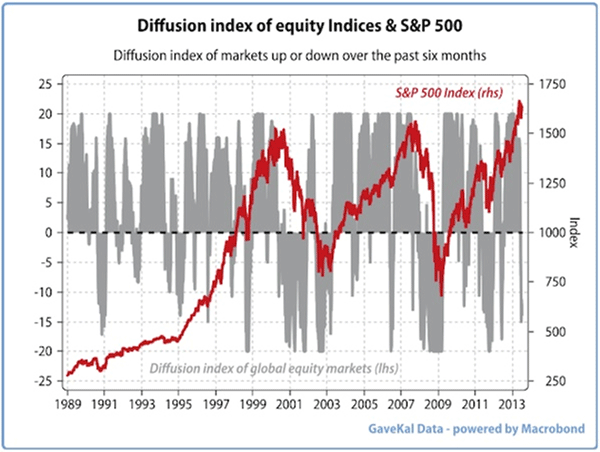
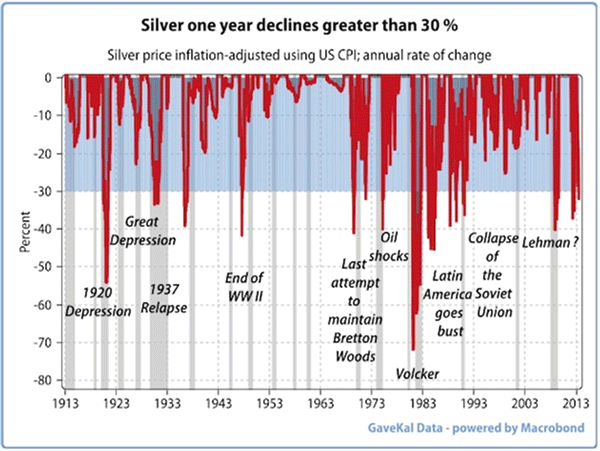
But Bryan and his Free Silver Democrats weren't opposed to the gold standard because they disagreed with the notion that gold was money; they just thought that silver should be money, too. Whatever you thought about the policy implications, the Common Knowledge about the meaning of gold in 1895 was clear: it was money, and the behavior of market participants in buying and selling gold reflected this meaning.

Now imagine if the current head of the House of Morgan, Jamie Dimon, made the same statement as Jupiter Morgan did, equating gold with money. People would think it was a joke. Everyone knows that everyone knows that gold does not mean the same thing to Jamie Dimon that it did to J.P. Morgan.
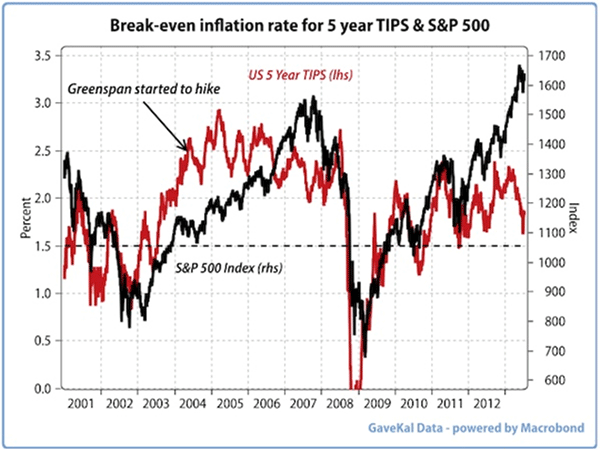
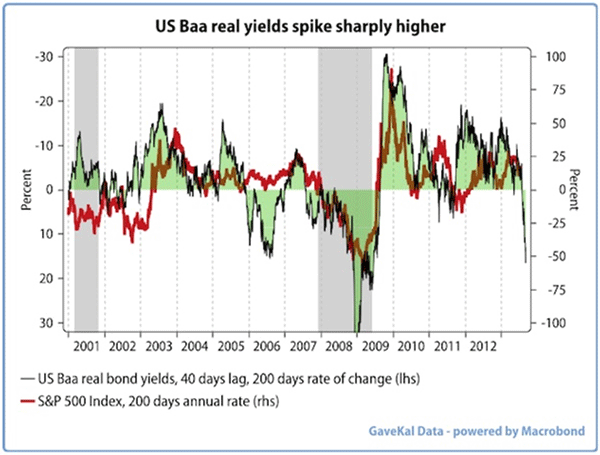
To market participants in 2013 gold means lack of confidence in money, and their behavior in buying and selling gold similarly reflects this meaning. Buying gold today is a statement that you believe that global economic events may spiral out of the control of Central Bankers. It is insurance against some sort of massive monetary policy mistake that cannot be fixed without re-conceptualizing the global economic regime – hyperinflation in a developed nation, the collapse of the Euro, something like that – not an expression of a commonly shared belief in some inherent value of gold.

The source of gold's meaning, whether you are a market participant in 1895 or 2013, comes from the Common Knowledge regarding gold. J.P. Morgan said that gold is money, and he was right, but only because at the time he said it everyone believed that everyone believed that gold is money. Today that same statement is wrong, but only because no one believes that everyone believes that gold is money.

You may privately believe that J.P. Morgan is still right, that gold has meaning as a store of value. But if you participate in the market on the basis of that belief, then you will buy and sell gold in an incredibly inefficient manner. You would be a smart gold investor in 1895, but a poor gold investor today. Or let's say that you privately believe gold to be a "barbarous relic" and that it's ridiculous for gold to have any ascribed value at all other than what jewelry demand would bring. You, too, will buy and sell gold in an incredibly inefficient manner. In fact, you would be a poor gold investor in both 1895 and today.

In some periods of history gold is money. In other periods of history gold is not. But gold is always something, and that something is defined by the Common Knowledge of the day. To be an efficient gold investor in any period, I believe it's crucial to identify and measure the relevant Narrative that is driving the Common Knowledge regarding gold. Only then can one construct an informational surface that predicts how the equilibrium price of gold will respond to new information (see "Through the Looking Glass" for a description of this game theoretic methodology).

There is no stand-alone Narrative regarding gold today, as there was in 1895. Today gold is understood from a Common Knowledge perspective only as a shadow or reflection of a powerful stand-alone Narrative regarding central banks, particularly the Fed … what I will call the Narrative of Central Banker Omnipotence. Like all effective Narratives it's simple: central bank policy WILL determine market outcomes. There is no political or fundamental economic issue impacting markets that cannot be addressed by central banks. Not only are central banks the ultimate back-stop for market stability (although that is an entirely separate Narrative), but also they are the immediate arbiters of market outcomes. Whether the market goes up or down depends on whether central bank policy is positive or negative for markets. The Narrative of Central Banker Omnipotence does NOT imply that the market will always go up or that central bank policy will always support the market. It connotes that whatever the central bank policy might be, it will drive a market outcome; whatever the market outcome, it was driven by a central bank policy.

Like all effective Narratives it has a great deal of "truthiness" … it rings true to our intellect even as it appeals to our emotions. How comforting to believe that there is a reason why markets go up and go down, and that this reason is clearly identifiable and attributable to the decisions of a few Wise Men and Women, as opposed to the much scarier notion that the world (and markets) are adrift on a sea of chaotic events and hidden currents. And like all effective Narratives it serves the interests of the world's most powerful political and economic entities … not that there's anything wrong with that.

The strength of the Narrative of Central Banker Omnipotence has nothing to do with whether people believe that central bank policy is wise or foolish, good or bad. To predict market behavior it really doesn't matter if QE is the balm of Gilead or the work of the Devil, any more than it mattered in 1895 whether the gold standard saved the Republic or crucified mankind. The only thing that matters from an Epsilon Theory perspective is whether everyone believes that everyone believes that central bank policy determines market outcomes.

The stronger the Narrative of Central Banker Omnipotence, the more likely it is that the price of gold goes down. The weaker the Narrative – the less established the Common Knowledge that central bank policy determines market outcomes – the more likely it is that the price of gold will go up. In other words, it's not central bank policy per se that makes the price of gold go up or down, it's Common Knowledge regarding the ability of central banks to control economic outcomes that makes the price of gold go up or down.

Look below at the price chart for gold over the past year. Gold peaked in late September and early October 2012, immediately after the Fed announced its open-ended QE program (red line). From the perspective of traditional macroeconomics, this makes no sense at all. The Fed had just announced its most aggressive monetary easing policy in history. Not only were they announcing yet another balance sheet expansion, but this time they were telling you that they weren't going to stop at any pre-determined level, but were going to keep going for as long as it took to satisfy their full employment mandate. This is an inflation engine, pure and simple, and gold should go up, up, and away in price if the standard macroeconomic correlation between the price of gold and monetary easing held true.

London Gold Market Fixing Price, June 30, 2012 – June 30, 2013 (Source: Bloomberg L.P.)

But what was more relevant for the price of gold was the strengthening of the Narrative of Central Banker Omnipotence after the open-ended QE announcement. When you examine the public statements in major media outlets in the weeks following this announcement through a Common Knowledge methodology – both direct statements from Fed governors and "analysis" statements from prominent journalists, investors, and politicians – there was remarkably little opinion-leading or Narrative effort devoted to the direct economic or market implications of the new QE program. There was a one-day spike in inflation expectations and a few public comments to quell the "Oh my God, this means rampant inflation" crowd in the first day or so, but very little else. Instead, the focus of the mainstream Narrative effort moved almost entirely towards what open-ended QE signaled for the Fed's ability and resolve to create a self-sustaining economic recovery in the US. And it won't surprise you to learn that this Narrative effort was overwhelmingly supportive of the notion that the Fed could and would succeed in this effort, that the Fed's policies had proven their effectiveness at lifting the stock market and would now prove their effectiveness at repairing the labor market. Huzzah for the Fed!

Within a week or so, however, opinion-leading voices from other prominent journalists, investors, and politicians joined the fray to say that this congratulatory viewpoint of the Fed's new policy was entirely misplaced. There was absolutely no evidence showing that further expansion of the Fed's balance sheet would have any impact whatsoever on US labor conditions, and that to claim otherwise was simply magical thinking. Moreover, according to this counter-argument, there was clearly a declining economic utility to more and more QE, so this latest program was a bridge too far.

But here's the crucial point … whether these opinion-leaders and Narrative creators thought open-ended QE was a wonderful thing or a terrible thing, they ALL agreed that Fed policy had been responsible for the current stock market level. It was J.P. Morgan and William Jennings Bryan all over again, just arguing the merits of more QE versus less QE instead of the merits of the gold standard versus the gold + silver standard. But just as the debate over Free Silver only intensified the Common Knowledge that gold was money in 1896, so did this debate over the merits of open-ended QE only intensify the Common Knowledge that Fed policy was responsible for market outcomes in 2012. This was a positive informational inflection point in the Narrative of Central Banker Omnipotence, and as a result the price of gold has not had a good day since.

Gold is the most pronounced example of an asset with a mutable behavioral foundation because for all practical purposes there is no practical use for gold. It's pretty and shiny and relatively rare, but so are a lot of things. For gold, at least, there is no "timeless and universal" relationship between it and economic constructs like inflation and growth, or monetary policy constructs like easing and tightening. There is a relationship, to be sure, but the nature of that relationship changes over time as the Common Knowledge regarding the meaning of gold changes.

The same is true of every other symbolized asset, which is to say every cash flow or fractional ownership interest or thing that is securitized and traded.

Not to the same extent as gold … there's a continuum to this perspective, with securities representing gold and other precious metals at one end, then securities representing foreign exchange, then securities representing industrial metals and other commodities, then securities representing publicly traded stocks and bonds, and finally securities representing privately traded equity and debt at the other end of the spectrum. Within each of these categories, the more symbolic the security the more fragile the correlation between it and real-world economic factors (so, for example, an aggregation of stock symbols via an ETF is more prone to game-playing than an individual stock.) Put slightly differently, the more clearly identifiable and directly attributable the cash flow foundation of an asset, the less the impact of the Common Knowledge game. Still, the assignment of value to any symbolized asset is inherently a social construction and will inevitably change over time, occasionally in sharp and traumatic fashion.

The notion that the preference function of market participants may change over time has been around for a long time, particularly in the study of commodity markets. Ben Inker at GMO recently wrote an excellent paper on this topic ("We Have Met the Enemy, and He Is Us") that I highly recommend if you want to dig into the gory details, but here's the basic idea:

Back in the 1930's Keynes proposed an idea called "normal backwardation" to explain how commodity futures markets could support a profit for traders who specialized in those markets. In this theory, commodity producers like farmers were typically risk averse when it came to market risk, and so would be willing to accept a forward contract guaranteeing a lower future price for their crop than a straightforward projection of the current spot price would suggest. The difference between this agreed upon futures price and the projected futures price was the risk premium required by the specialized commodity trader to take the other side of the trade. As Keynes pointed out, the risk premium would have to be pretty high for the commodity trader to engage in this trade (and thus push the futures price down) because, obviously, the commodity trader's entire livelihood was based on making a profit on these trades.

But now let's fast-forward 80 years to a world where anyone can be a commodity trader, or rather, anyone can make commodity trades without being a specialized commodity trader. In fact, the notion of an entire market being made by specialists seems terribly quaint today. More importantly, the meaning of a commodity futures contract has changed since Keynes proposed his theory, in the same way that the meaning of gold has changed since J.P. Morgan smoked his last cigar. Pretend you're a giant pension fund with several hundred billion dollars worth of current assets and future liabilities. Do you think about owning a commodity futures contract because you're interested in making a small profit in the difference between a farmer's hedge and a projected forward spot price? Are you agonizing over a few basis points like a specialized commodity trader? Of course not. The only reason you are interested in owning a commodity futures contract is because you're worried about inflation within the context of your portfolio of assets and liabilities. It's your preference function regarding inflation that will drive your behavior, not a preference function regarding the intricacies and competitive risk premium associated with this particular commodity.

Whatever historical correlations and patterns existed in this commodity market when it was limited to specialty traders have to be tossed out the window when the pension funds and other enormous asset managers get involved. It's like playing poker at a table with five penny-pinching off-duty Vegas dealers, and then moving to a table with five rich doctors in town for the weekend. If you don't change the way you play your cards, even if you're dealt exactly the same cards from one table to another, then you're a fool.

This transformation in the composition and goals of market participants is by no means limited to commodity markets. Over the past decade there has been a sea change in the structure of global debt and equity markets, as well. Multiple papers by Simon Emrich and Charles Crow at Morgan Stanley lay out the structural transformation in equity markets in fantastic detail, most recently "Trading Strategies for 2013 – Optimal Responses to Current Market Structure" (March 18, 2013), but here are the two most striking findings from a game theoretic perspective:

1) Over the past 10 years, institutional management of equity portfolios has increased from 54% to 81%.

2) Over the same period, the share of what Emrich and Crow call "real institutional trading" has declined from 47% of trading volume to 29%.

There are far fewer market participants today than just ten years ago, managing much larger portfolios across more asset classes, and using much less trading. In future letters I'll lay out in detail how this structural shift has large and specific consequences for the nature of game-playing in markets, but for the balance of this letter I just want to make a simple, and I hope obvious, point: structural change in any social environment wreaks havoc on historically observed correlations and patterns within that environment.

Unfortunately this sort of structural change is effectively invisible to econometric modeling of portfolios, and as a result understates the risks inherent in portfolios that rely heavily on historical correlation patterns. In a market undergoing structural change, all of the "timeless and universal" relationships that form the backbone of Risk Parity funds like Bridgewater's All-Weather Fund and similar offerings by Invesco and AQR are much less certain than their econometric justifications would suggest. The underperformance of these strategies in recent weeks and months ("Fashionable 'Risk Parity' Funds Hit Hard", Wall Street Journal, June 27, 2013) takes on new meaning when seen in this light.

There's nothing wrong with the math of the correlation exercises that underpin Risk Parity funds, any more than there was anything wrong with the math of the correlation exercises that ratings agencies like Moody's and S&P used to grade Residential Mortgage-Backed Securities (RMBS). But in both cases there is an assumption about market behavior – the relationship of asset performance under varying conditions of growth and inflation for Risk Parity funds; the role of geographical diversity in mitigating the risk profile of mortgage portfolios for RMBS ratings – that is exogenous to the calculation of the projected returns. In both cases, the standard portfolio model of y = α + β + Ɛ, where Epsilon is treated as an error term and the preference functions of market participants are assumed, gives a very compelling result: Risk Parity funds demonstrate an excellent risk-adjusted return profile, and trillions of dollars worth of RMBS deserve a AAA rating. But if you are wrong in your exogenous assumptions – if, for example, there is a nation-wide decline in US home prices for the first time since the 1930's and geographical diversity provides no protection for a mortgage portfolio – then all the Gaussian cupolas and other econometric legerdemain in the world won't save your AAA-rated security.

Risk Parity funds are a more broadly conceived, less levered version of Long-Term Capital Management. I mean that as a compliment, because it was the narrow conception and over-use of leverage at LTCM that ruined a solid investment premise and made it impossible for that firm to survive even a small disruption in patterns of market participant preferences – in LTCM's case, the strong historical preference of major sovereign nations not to default on their debt obligations and the strong historical preference of major bond investors not to pay non-economic prices for the safety of US sovereign debt. The investment premise of LTCM was to identify small arbitrage opportunities between securities on the basis of historical correlations and to lever up those opportunities to generate nice returns. If you can take that premise and improve it significantly by expanding the scope and depth of the arbitrage opportunities and by shrinking the leverage turns required for acceptable returns … well, that seems like a really great idea to me. And I have zero doubt that investment giants like Ray Dalio, Bob Prince, and Cliff Asness can design a complex levered bond portfolio that is both safer and more rewarding than a simple unlevered stock and bond portfolio under most conditions. But I get VERY nervous when I am told that the reason these complex levered bond portfolios work so well is that a socially constructed behavior such as the assignment of value to highly symbolic securities is "timeless and universal", particularly when the composition and preference functions of major market participants are clearly shifting, particularly when monetary policy is both massively sized and highly experimental, particularly when political fragmentation is rampant within and between every nation on earth.

Timing is everything with levered bond arbitrage, just ask Jon Corzine. Five years ago, this is a guy for whom there was a plausible path to become President of the United States. This is why he left the US Senate to become Governor of New Jersey, so that he could more easily and more effectively run for President. Losing his re-election bid in 2009 to Chris Christie closed that door, but only temporarily, as F. Scott Fitzgerald's line that "there are no second acts in American lives" was probably wrong when he wrote it and is clearly not applicable to American society today.

So MF Global came along after the gubernatorial defeat and gave him a place to hang his hat for a few years, maybe refill the personal coffers that had been depleted by his phenomenally expensive campaigns. Within a year of taking the MF Global reins in March 2010, Corzine transformed the firm from a poorly managed commodities brokerage plagued by rogue traders and seemingly constant regulatory fines into a significant capital markets and prop trading player under his direct control. The culmination of this transformation was MF Global's approval by the New York Fed as a primary dealer in February 2011, allowing the firm to fund itself as cheaply as any major investment bank. From that moment on Corzine – who started his career at Goldman Sachs as a sovereign bond trader – began to build a levered position in distressed European peripheral sovereign debt. By levering MF Global's capital to the hilt in order to borrow dollars at historically low rates and buy, say, Portuguese 5-year paper with a 10% current yield in April 2011, Corzine stood to make an absolute killing as soon as the Europeans got their act together. After all, this is the sovereign nation of Portugal we're talking about here, a full-fledged member of the European Union with a currency backstopped by the ECB and Germany, and it's trading like a distressed corporate bond? Time to back up the truck. In fact, why don't we put a little bit of duration risk into the mix to juice the returns even more. What could possibly go wrong?
We all know the rest of the story. One day you're at the pinnacle of business and politics, poised to make a billion or two on a killer trade; the next day you're testifying before Congress about misuse of client funds and considering taking the Fifth; tomorrow there may be a perp walk. The irony, of course, is that if Corzine had put this trade on 6 to 9 months later, we would today be talking about the brilliance of Jon Corzine, Lion of Wall Street, and how he had created a new Goldman Sachs.

The lesson? Pride may goeth before a fall, but so does leverage, bad timing, and poorly examined assumptions. A dislocation in the price of gold may be the least of our worries in a market and world undergoing structural change.

See the original article >>

Why Is US Inflation So Low?

by Martin Feldstein

CAMBRIDGE – Why has quantitative easing coexisted with price stability in the United States? Or, as I often hear, “Why has the Federal Reserve’s printing of so much money not caused higher inflation?”

This illustration is by Paul Lachine and comes from <a href="http://www.newsart.com">NewsArt.com</a>, and is the property of the NewsArt organization and of its artist. Reproducing this image is a violation of copyright law.

Illustration by Paul Lachine

Inflation has certainly been very low. During the past five years, the consumer price index has increased at an annual rate of just 1.5%. The Fed’s preferred measure of inflation – the price index for personal consumption expenditures, excluding food and energy – also rose at a rate of just 1.5%.

By contrast, the Fed’s purchases of long-term bonds during this period has been unprecedentedly large. The Fed bought more than $2 trillion of Treasury bonds and mortgage-backed securities, nearly ten times the annual rate of bond purchases during the previous decade. In the last year alone, the stock of bonds on the Fed’s balance sheet has risen more than 20%.

The historical record shows that rapid monetary growth does fuel high inflation. That was very clear during Germany’s hyperinflation in the 1920’s and Latin America’s in the 1980’s. But even more moderate shifts in America’s monetary growth rate have translated into corresponding shifts in the rate of inflation. In the 1970’s, US money supply grew at an average annual rate of 9.6%, the highest rate in the previous half-century; inflation averaged 7.4%, also a half-century high. In the 1990’s, annual monetary growth averaged only 3.9%, and the average inflation rate was just 2.9%.

That is why the absence of any inflationary response to the Fed’s massive bond purchases in the past five years seems so puzzling. But the puzzle disappears when we recognize that quantitative easing is not the same thing as “printing money” or, more accurately, increasing the stock of money.

The stock of money that relates most closely to inflation consists primarily of the deposits that businesses and households have at commercial banks. Traditionally, greater amounts of Fed bond buying have led to faster growth of this money stock. But a fundamental change in the Fed’s rules in 2008 broke the link between its bond buying and the subsequent size of the money stock. As a result, the Fed has bought a massive amount of bonds without causing the stock of money – and thus the rate of inflation – to rise.

The link between bond purchases and the money stock depends on the role of commercial banks’ “excess reserves.” When the Fed buys Treasury bonds or other assets like mortgage-backed securities, it creates “reserves” for the commercial banks, which the banks deposit at the Fed itself.

Commercial banks are required to hold reserves equal to a share of their checkable deposits. Since reserves in excess of the required amount did not earn any interest from the Fed before 2008, commercial banks had an incentive to lend to households and businesses until the resulting growth of deposits used up all of those excess reserves. Those increased deposits at commercial banks were, by definition, an increase in the relevant stock of money.

An increase in bank loans allows households and businesses to increase their spending. That extra spending means a higher level of nominal GDP (output at market prices). Some of the increase in nominal GDP takes the form of higher real (inflation-adjusted) GDP, while the rest shows up as inflation. That is how Fed bond purchases have historically increased the stock of money – and the rate of inflation.

The link between Fed bond purchases and the subsequent growth of the money stock changed after 2008, because the Fed began to pay interest on excess reserves. The interest rate on these totally safe and liquid deposits induced the banks to maintain excess reserves at the Fed instead of lending and creating deposits to absorb the increased reserves, as they would have done before 2008.

As a result, the volume of excess reserves held at the Fed increased dramatically from less than $2 billion in 2008 to $1.8 trillion now. But the new Fed policy of paying interest on excess reserves meant that this increased availability of excess reserves did not lead after 2008 to much faster deposit growth and a much larger stock of money.

The size of the broad money stock (known as M2) grew at an average rate of just 6.2% a year from the end of 2008 to the end of 2012. While nominal GDP generally rises over long periods of time at the same rate as the money stock, with interest rates very low and declining, households and institutions were willing to hold more money relative to total nominal GDP after 2008. So, while M2 grew by more than 6%, nominal GDP grew by just 3.5% and the GDP price index rose by only 1.7%.

So it is not surprising that inflation has remained so moderate – indeed, lower than in any decade since the end of World War II. And it is also not surprising that quantitative easing has done so little to increase nominal spending and real economic activity.

The absence of significant inflation in the past few years does not mean that it won’t rise in the future. When businesses and households eventually increase their demand for loans, commercial banks that have adequate capital can meet that demand with new lending without running into the limits that might otherwise result from inadequate reserves. The resulting growth of spending by businesses and households might be welcome at first, but it could soon become a source of unwanted inflation.

The Fed could, in principle, limit inflationary lending by raising the interest rate on excess reserves or by using open-market operations to increase the short-term federal funds interest rate. But the Fed may hesitate to act, or may act with insufficient force, owing to its dual mandate to focus on employment as well as price stability.

That outcome is more likely if high rates of long-term unemployment and underemployment persist even as the inflation rate rises. And that is why investors are right to worry that inflation could return, even if the Fed’s massive bond purchases in recent years have not brought it about.

See the original article >>

Follow Us