Monday, July 1, 2013

Mesch Market Outlook Commentary for July: Gold

By Robin Mesch

Gold spent the first half of June locked in development between the 1415-1365 as the market used price against the developing bottom of value, forming a pronounced mode as time was spent accepting this lower range as fair value.  By mid month, the sell order flow was reignited with the directional initiation out of this high usage area (as noted on the Profile).  Last month's breakdown should have cured any remaining doubt that the Bull market in Gold is over.  Once the Bears cracked through the long-term high usage ledge of 1330-1335, trapped Bull-believers were finally flushed out of the market which triggered what we anticipated would be a rapid plunge to 1250 and lower.  While most of the trapped buyers look gone, this decline has likely reversed enough of the bullish mindset to trigger a change of psychology that will invigorate new selling on rallies.  We anticipate that the new Bears will have the strength of conviction to carry the market down to our next major downside target of 1015-930, which we expect to see over the course of the next 6-8 months.  Coming into July, there is a small ledge of high usage from 1270-1290 that is apt to serve resistance and we see this area as a viable spot to short if offered early this month.  The short term downside target for this sell is around 1140. 


The charts included in this report are Price Usage charts which depict the usage of a given price over time. The vertical left axis represents price, while the horizontal axis represents time. Price Usage charts display where the market has 'used' price, thus accepting - or rejecting - value. The result of this market auction process are Bell Curve shaped composite Profiles, which indicate phases of development and create a top and bottom of perceived value in the market.

See the original article >>

Oppenheimer: "Time To Cover All Shorts In Gold And Gold Miners" Because "Gold Stocks Are So Bad, They're Good"

by Tyler Durden

Whether lucky or good, Oppenheimer's Carter Worth was accurate in calling for a drop in gold back in January of 2013. From his note at the time: "For those without the time or inclination to read past the first page (we're told by the marketing experts that many people don't read past the first page of most research reports) here is the summary, in one word, of today's edition of "Money in Motion" focusing on Gold Bullion: SELL."

Fast forward to today, when the technician pulls a U-Turn, and says that "at this time, we believe gold and gold miners represent good risk/reward. Indeed, the recent extreme weakness is judged to be the reciprocal or correlative of the extreme strength witnessed in the summer of 2011. The "despair" relating to gold now is as palpable as "euphoria" then."

And always one with a witty turn of the phrase, Worth summarizes his shift in sentiment as follows: "The bottom line, by our work, is this: at this time it is right to cover all shorts in gold and gold miners… and we would look for opportunities on the long side.... The charts of the individual equities are atrocious. And that is the circumstance that compels today's report. The stocks are judged to be "so bad, that they're good"."

Worth's short-term target, based on charts and squiggles: $1,395.

Some more squiggles...

And even more squiggles:

There are many more squiggles in the full report, leading Worth to also give a "buy" reco on the following miners:

Of course, as we showed over the weekend when we demonstrated the unprecedented technical sentiment dislocations behind gold with a stunning amount of gross gold shorts, should the long-overdue gold squeeze indeed take place, then $1395 will be merely the first stop.

See the original article >>

Performance of Precious Metals in 2013

By Peter Fertig

Most analysts polled by the London Bullion Market Association at the start of 2013 were optimistic for precious metals in 2013. They predicted annual average prices to be higher for another year. However, after the first half of 2013 is over, it looks rather unlikely that average prices in this year will be above the average price of 2012.

The table below shows the spot price of the four precious metals as well as the percentage change over the end of the previous end of quarter and also the percentage change in the first half. The development of gold and silver in the first quarter of 2013 could still be interpreted as a correction after the end of the festival season, which is not uncommon. Platinum and palladium moved higher due to the development in South Africa and fears of supply shortage. But the second quarter had been a disaster for all precious metals. 

Based on our quantitative fair value model for gold, we investigate whether this plunge of precious metals in Q3 could be explained by the major fundamental factors driving the price of gold. Our model is based on weekly data. As also financial and commodity markets show seasonal influences, we did not use weekly, but annual percentage changes. Thus, there was no need to include also further seasonal adjustments in the model equations. All fundamental factors were included in the equations for the four precious metals. These factors are the 1) the US dollar Index, 2) the price of crude oil (WTI), 3) the S&P 500 composite index, 4) the yield on 10yr US Treasuries and the net long position of non-commercials in the futures traded at the Comex division of the Chicago Mercantile Exchange (CME). For the US Treasury yield, instead of percentage changes, the absolute yoy-change in basis points had been used. The net-long position has been divided by 1000.

Linear regression models based on time series of financial asset or commodity prices often lead to residuals, which are serially correlated. Therefore, the models include a first order autoregressive term for the residuals and the parameters for the exogenous fundamental factors and the autoregressive error term have been estimated simultaneously. The model was first developed in 2006, and therefore, data from January 1997 until September 2006 was used in the estimation. The regression coefficients are all significant at the 5% level and have the expected sign.

The following chart shows the development of the yoy percentage change of the spot gold price and the estimated values. At a first glance, the model appears to predict the development of the gold price still quite well. However, this good fit could be the result of the autoregressive error term, which might deviate further away from the fair value instead of oscillating around it.

Since the end of 2012, the yoy percentage change of gold dropped from 2.47 to -22.07% at the end of June 2013, which is a change of 24.54 percentage points. Thus, we investigated how much the five fundamental factors contributed to the dismal performance of gold. The US dollar index firmed on the strength of the US dollar against the Japanese Yen and thus contributed a -0.64 percentage points. Also the drop of the net-long positions held by the large speculators contributed with -2.15 percentage points to the negative performance of gold. However, crude oil, the S&P 500 index and the yield on the 10year US Treasury notes all made a positive contribution. In total, the five fundamental factors indicated that gold should have shown a decline of the yoy percentage change by 0.92 points to 1.55% instead of falling to -22.07%. 

This already indicates there must have been a structural change in the precious metals markets. Relationships collapsed, which held before the financial crisis and even in the first few years after the crisis.

One possible reason for a structural change might have been the speech by ECB president Draghi held in July 2012 in London, where he pledged to do everything necessary to keep the euro intact and announced what later became known as OMT.  A second reason might have been the introduction of Abenomics in Japan in the final quarter of 2012. Thus, the regression coefficients have been estimated again, but based on data from July 2012 until the end of June this year. Most of the variables or lag structures are no longer significant at the 5% level. Only the US dollar index and the S&P 500 index remained significant factors. However, the regression coefficient of the S&P index increased and changed the sign from positive to negative.

Slight modifications of the lag-structure led to a model, where the five fundamental factors are significant again. However, now also the regression coefficient for the annual change in the 10year US Treasury yield changed sign and magnitude. Rising yields, which had earlier been interpreted as a sign of rising inflation rates, are no longer positive for gold. They now lead to falling gold prices, which reflect the fear that an end of QE would eliminate any reason for holding gold.

Crude oil was the only one of the five factors, which made a positive contribution of 4.75 percentage points. The US dollar and the S&P 500 index both contributed less than one percentage point to the decline. The rise of the 10year US Treasury yield contributed -6.7 percentage points. The fall of the net-long position held by large speculators had the strongest negative impact on gold's negative performance with -8.75 percentage points. All in all, according to the adjusted and re-estimated model the five fundamental factors contributed -12.45 percentage points to the fall of the yoy percentage change of the gold price in the first half of 2013.

The chart above shows the development of the yoy percentage change of the gold price and the estimate based on the adjusted model fitted for the period from July 2012 until June 2013.  It is obvious, that a good fit is only obtained for the period from early 2012 onwards. For the time before, the fit is worse. This clearly indicates that the structure of the gold market has changed last year.

It is uncertain, how long the US stock market and the US Treasury yield will have a negative impact on the development of the gold price performance. However, even if the regression coefficients of the adjusted model remain valid beyond the estimation period, the fundamental factors explained only 12.45 of the 24.54 percentage point drop in the yoy gold price change. Thus, almost half of the plunge could not be explained by the major fundamental factors of the model. This implies that gold overshoot on the downside. If the fundamentals don't deteriorate further, there is some potential for a recovery. But the sentiment in the gold market is seriously damaged and the famous knife is still falling. Thus, it appears too early to try catching the knife now.

See the original article >>

Banks benefiting from "taper" on both sides of the balance sheet

by SoberLook

US equity markets are continuing to price in higher premiums for bank shares relative to the overall market. The increased steepness of the yield curve will mean higher net interest income, as banks borrow at historically low rates from depositors and lend longer term at the highest rates in two years. The chart below compares the S&P bank index (KBE) with the S&P500 index (SPY) over the past 5 days.

Not only are banks increasing the longer term rates at which they lend, but they also have lowered rates they pay on various types of deposits.

Checking accounts that pay interest (source: Bankrate.com)

Money market accounts (source: Bankrate.com) -
Note: these are bank savings accounts, NOT money market funds

Even without growing their balance sheets - and for now US banks' balance sheet growth has stalled - banks can improve their margins simply through lower interest expense. That's part of the reason for bank share ongoing outperformance.
In the mean time, in spite of higher rates elsewhere, US savers are hurting.

See the original article >>

Rising yields: A bullish signal for equities?

By Jamie Macrae

The sharp rally in 10-year U.S. Treasury yields seen since the start of May has pushed government bond yields above the average dividend yield for U.S. equities, removing one of the strongest tailwinds supporting the rally that took the S&P 500 to new all-time highs (Chart 1). Conventional wisdom dictates that this should be a negative for stocks, as the yield gap between debt and equities generally favors the riskier equity assets. In addition, higher yields translate into higher corporate borrowing costs, which act as a drag on economic growth and puts pressure to equity prices. When viewed in this context, the bull market in equities may be facing some headwinds going forward.

What’s missing from the “conventional” wisdom above is the source of the rising yields, as there are numerous reasons for bond yields to rise. In the current context, yields are rising from an exceptionally low starting point, one that was designed to breathe life into a listless economy, and rescue a housing market from a devastating crash. With that in mind, rising yields are an indication of an economy that is picking up speed, which is hardly a negative for corporate earnings and by extension, equity valuations. Beyond a certain point, however, rising yields do start to act as a drag on the economy.

Based on our quantitative study of the relationship between 10-year nominal U.S. Treasury yields and the price-earnings ratio of the S&P 500 Composite Index, that tipping point is around 5%-6% (Chart 2). The red asterisk on Chart 2 indicates the current 10-year Treasury yield and the current S&P 500 p/e ratio. If the historical relationship between government bond yields and equity valuations holds, and Treasury yields continue to rise, so should equities – up to a point.

Whether yields continue to rise, however, is far from assured. The current rally, at its peak on June 25, took the 10-year Treasury yield over 30% above its 50-day moving average, the largest relative rally in at least 50 years (Chart 3). Given the extent of the rally, it may well be overextended.

See the original article >>

SPY Trends and Influencers: Monthly Edition June into July 2013

by Greg Harmon

Last month in this space my Monthly Macro Review/Preview had the monthly outlook suggesting the short term upside for Gold ($GLD) would continue while Copper ($JJC) might continue to drift. Crude Oil ($USO) was also set up to continue to consolidate as Natural Gas ($UNG) moved higher. The US Dollar Index ($UUP) looked stuck in the tightening triangle with US Treasuries ($TLT) biased to break the long consolidation to the downside. The Shanghai Composite ($SSEC) looked better to the upside, but not nearly as strong as the German DAX ($DAX) while Emerging Markets ($EEM) looked to continue to move lower. Volatility ($VIX) could go either way but looks to remain low keeping a tailwind at the backs of the Equity Index ETF’s. The Equity Index ETF’s themselves, $SPY, $IWM and $QQQ were set up to continue higher in the coming months with the trend in the QQQ the strongest. How does an additional month impact the longer term picture? Let’s look at some charts.
As always you can see details of individual charts and more on my StockTwits feed and on chartly.)

SPY, $SPY
spy

The SPY finally hit a top and consolidated the move higher from the January break up. It held above the previous high and is riding the middle between the Upper and Median and Median Lines on the Andrew’s Pitchfork. The Relative Strength Index (RSI) is stalling and starting to pullback from being technically overbought while the Moving Average Convergence Divergence indicator (MACD) continues higher slowly. All of the Simple Moving Averages (SMA) are pointing higher though and below the price as the Bollinger bands are pointing up. This has the feel of a pause and go. There is no resistance above 169.07, the 113% extension of the move lower, and the 127% extension is above at 181.8 with 138.2% at 192 well above. There is support lower at 157.52 and 145.50. Consolidation in the Uptrend.

The monthly outlook suggests that Gold and Copper will consolidate with downside biases, much strong on the bias for Gold than Copper. Crude Oil also looks to consolidate as it has been but with an upward bias, while Natural Gas pulls back in the uptrend. US Treasuries look to be a mess and will continue the trend lower while the US Dollar Index consolidates in its uptrend. The Shanghai Composite and Emerging Markets look to continue to move lower as the DAX pulls back in the short term in its uptrend. Volatility looks to remain low but with a slight upward drift. This paints a mosaic for the Equity Index ETF’s SPY, IWM and QQQ that supports more upward movement in the coming months. As noted on the individual charts, there is room for some short term consolidation and even a short pullback without breaking the upward bias. Use this information to understand the long term trends in Equities and their influencers as you prepare for the coming months.

See the original article >>

Market Rally: Oversold Bounce In Downtrend

by Lance Roberts

A couple of weeks ago I discussed that on a longer term basis (weekly data) that the market had thrown off an initial "sell" signal.  I stated then that:

"...in last weekend's newsletter this initial 'Sell Signal' is a warning that a further correction is likely to come. This is a wake up call to pay attention to your portfolio. However, this is not a signal to 'panic sell' and make emotional based investment mistakes."

However, since these signals are working on slower moving weekly data, by the time a signal is issued the market is generally getting very oversold on a short term basis and is due for a bounce.   As I stated in this past weekend's newsletter:

"The good news is that the market rallied off of some very minor support last week after getting oversold on a daily basis as shown in the chart [below].

However, the bad news is that, on a daily basis (which is very short term and more for traders rather than investors), the market has registered all three critical short term 'SELL' signals with the short term moving average cross below the long term moving average. This suggests that the most likely trend of prices in the short term – is lower.

Furthermore, though the market did rally last week it failed to break above resistance at the downward trending short term moving average (blue dashed line.)

The market is still oversold, although less so, on a short term basis which could provide fuel for a continued rally in stocks next week. However, as we will discuss in a moment, the current downward trend is still intact and any advance above the short term moving average will be met by the longer term moving average, which is also now trending lower, at 1630."

I have updated the chart from this past weekend to include the rally on the first trading day of July.

SP500-Marketupdate-070113

On a short term basis the market was able to break above the short term moving average and is now likely going to test the longer term moving average at 1630.  However, the markets are still confined within a negative downtrend channel so traders should remain more cautious about adding exposure currently.  However, there is also no indication to drastically reduce exposure at this point either.

If the market is able to break out of the current negative trend above 1640 then the market will make an advance towards the previous highs.

With the Fed still fully engaged in their bond buying program (no tapering on the schedule as of yet as $45 billion in bonds is slated to be bought in July) the liquidity injections are likely  to push the markets higher short term.

It will take a sustained move higher to reverse the weekly "initial sell signal" that are currently in play as discussed previously.  Much of the sustainability of the current advance will come from continued improvement in the economic landscape.  While there has been some improvement in the macro-economic backdrop in recent days - there is little evidence that such improvements are anything other than bounces within negative data trends.  For example, take a look at the most recent release of the ISM Manufacturing data which showed an increase from 49.0 in May to 50.9 in June.

ISM-Manufacturing-RealGDP-070113

However, when smoothing the data with a 6-month average we find that manufacturing activity peaked in early 2011 along with real economic growth.  The problem is that the markets are extrapolating bounces in economic data as the beginning of the long expected recovery.  However, actual economic growth continues to muddle along at less than 2%.

Even with the ongoing liquidity push from the bond buying programs, the markets, and in particular valuations, are tied to long term corporate profitability and economic growth.  The eventual reversion of prices to underlying fundamental realities is inevitable.  With the debt ceiling/budget debate rapidly approaching, China showing increases signs of economic stress and the Euro-zone trapped in an ongoing recession there are plenty of risks to market participants in the short term.

The technical indicators are currently sending up warnings that should be paid attention to.  In the past these warnings have generally kept investors out of more severe trouble.  When these signals turn back to positive, and issue an "all clear" signal, it will provide a more risk adverse entry point for equities.

For longer term investors, it is important to remember that we are very late in the current economic expansion.  As I stated last week in "Investors Continue To Make The Same Mistakes:"

"The biggest problem currently is that there is virtually no expectation, or analysis that incorporates the impact, of an average economic recession ever occurring again.

What is important for investors is an understanding that, despite claims to the contrary, a recession will occur in the future. It is simply a function of time. These recessionary drags inflict lasting damage to investment portfolios over time. The table above shows the start and finish dates, prior peak, and peak to trough price declines during previous recessionary periods. The average draw down for all recessionary periods was 30.76% with an average recovery period of 43 months. For someone close to, or in retirement, this can be devastating."

Has the correction that begin in June run its course or is there is more to come? The next two weeks should answer that question.

See the original article >>

Cotton moves lower after USDA showed large cotton crop planted

By Jack Scoville

COTTON

General Comments: Futures were lower in response to the USDA reports that showed plenty of cotton was being planted. However, futures held the short term range and gave no clue to the next short term move. It is possible that futures can work lower again as demand has turned soft. Ideas of better production conditions in the US caused some selling interest. Texas is reporting light precipitation, mostly in southern areas. Dry weather is being reported in the Delta and showers and storms are seen in the Southeast. The weather should help support crop development in the Delta and Southeast, and could help in Texas. Weather for Cotton appears good in India, Pakistan, and China.

Overnight News: The Delta should be dry and Southeast will see showers and rains. Temperatures will average near to below normal. Texas will get a few showers early this week, but will be mostly dry. Temperatures will average near to below normal. The USDA spot price is now 81.26 ct/lb. ICE said that certified Cotton stocks are now 0.612 million bales, from 0.596 million yesterday. ICE said that 38 notices were posted today and that total deliveries are now 1,560 contracts.

Chart Trends: Trends in Cotton are mixed to down with no objectives. Support is at 85.10, 84.00, and 82.80 October, with resistance of 86.40, 86.90, and 88.00 October.

FCOJ

General Comments: Futures closed a little higher in consolidation trading. More buying was seen in July as traders get out of positions before First Notice Day today. Better weather in Florida seems to be the big problem for the bulls at this time. Futures have been working generally lower as showers have been seen and conditions are said to have improved in almost the entire state. Ideas are that the better precipitation will help trees fight the greening disease. No tropical storms are in view to cause any potential damage. Greening disease and what it might mean to production prospects continues to be a primary support item and will be for several years. Temperatures are warm in the state, but there are showers reported. The Valencia harvest is continuing but is almost over. Brazil is seeing near to above normal temperatures and mostly dry weather, but showers are possible next week.

Overnight News: Florida weather forecasts call for showers. Temperatures will average near to above normal. ICE said that 0 delivery notices were posted today and that total deliveries for the month are now 0 contracts.

Chart Trends: Trends in FCOJ are down with no objectives. Support is at 125.00, 122.50, and 121.50 September, with resistance at 130.00, 131.50, and 132.50 September.

Share on twitter Share on facebook Share on email Share on print More Sharing Services 2

COTTON

General Comments: Futures were lower in response to the USDA reports that showed plenty of cotton was being planted. However, futures held the short term range and gave no clue to the next short term move. It is possible that futures can work lower again as demand has turned soft. Ideas of better production conditions in the US caused some selling interest. Texas is reporting light precipitation, mostly in southern areas. Dry weather is being reported in the Delta and showers and storms are seen in the Southeast. The weather should help support crop development in the Delta and Southeast, and could help in Texas. Weather for Cotton appears good in India, Pakistan, and China.

Overnight News: The Delta should be dry and Southeast will see showers and rains. Temperatures will average near to below normal. Texas will get a few showers early this week, but will be mostly dry. Temperatures will average near to below normal. The USDA spot price is now 81.26 ct/lb. ICE said that certified Cotton stocks are now 0.612 million bales, from 0.596 million yesterday. ICE said that 38 notices were posted today and that total deliveries are now 1,560 contracts.

Chart Trends: Trends in Cotton are mixed to down with no objectives. Support is at 85.10, 84.00, and 82.80 October, with resistance of 86.40, 86.90, and 88.00 October.

FCOJ

General Comments: Futures closed a little higher in consolidation trading. More buying was seen in July as traders get out of positions before First Notice Day today. Better weather in Florida seems to be the big problem for the bulls at this time. Futures have been working generally lower as showers have been seen and conditions are said to have improved in almost the entire state. Ideas are that the better precipitation will help trees fight the greening disease. No tropical storms are in view to cause any potential damage. Greening disease and what it might mean to production prospects continues to be a primary support item and will be for several years. Temperatures are warm in the state, but there are showers reported. The Valencia harvest is continuing but is almost over. Brazil is seeing near to above normal temperatures and mostly dry weather, but showers are possible next week.

Overnight News: Florida weather forecasts call for showers. Temperatures will average near to above normal. ICE said that 0 delivery notices were posted today and that total deliveries for the month are now 0 contracts.

Chart Trends: Trends in FCOJ are down with no objectives. Support is at 125.00, 122.50, and 121.50 September, with resistance at 130.00, 131.50, and 132.50 September.

Next page: Coffee, Sugar and Cocoa

COFFEE

General Comments: Futures were lower on speculative and light volume origin selling against roaster buying. The world production is big, but the cash market remains very quiet. However, roasters are showing more buying interest late last week than they have in months. Sellers, including Brazil, are quiet and are waiting for futures to move higher. Buyers are interested on cheap differentials, and might start to force the issue if prices hold and start to move higher in the short term on ideas that the market made a bottom. Brazil weather is forecast to show dry conditions, but no cold weather. There are some forecasts for cold weather to develop in Brazil early next week, but so far the market is not concerned. Current crop development is still good this year in Brazil. Central America crops are seeing good rains now. Colombia is reported to have good conditions.

Overnight News: Certified stocks are lower today and are about 2.744 million bags. The ICO composite price is now 114.99 ct/lb. Brazil should get dry weather except for some showers in the southwest. All areas could gt showers early next week. Temperatures will average near to above normal. Colombia should get scattered showers, and Central America and Mexico should get showers, with some big rains possible in central and southern Mexico and northern Central America. Temperatures should average near to above normal. ICE said that 3 delivery notices was posted against July today and that total deliveries for the month are now 792 contracts.

Chart Trends: Trends in New York are down with no objectives. Support is at 117.00, 116.00, and 113.00 September, and resistance is at 123.00, 125.00, and 126.00 September. Trends in London are mixed. Support is at 1720, 1705, and 1680 September, and resistance is at 1765, 1775, and 1800 September. Trends in Sao Paulo are down with no objectives. Support is at 140.00, 137.00, and 134.00 September, and resistance is at 148.00, 151.00, and 155.00 September.

SUGAR 

General Comments: Futures closed lower. Futures could not take out resistance areas and might try to work lower early this week. Some liquidation trading was seen in July contracts. July went off the Board on Friday. There is still talk that a low is forming or has formed for at least the short term, but there is still a lot of Sugar around, and not only from Brazil. The Indian monsoon is off to a good start and this should help with Sugarcane production in the country. But, everyone is more interested in Brazil and what the Sugar market is doing there. Traders remain bearish on ideas of big supplies, especially from Brazil. Traders in Brazil expect big production to continue as the weather is good.

Overnight News: Showers are expected in Brazil, mostly in the south and southwest. Temperatures should average near to above normal.

Chart Trends: Trends in New York are mixed. Support is at 1680, 1665, and 1650 October, and resistance is at 1715, 1750, and 1760 October. Trends in London are mixed. Support is at 484.00, 478.00, and 475.00 October, and resistance is at 490.00, 496.00, and 499.00 October.

See the original article >>

Hedge funds cut gold positions as Goldman lowers outlook

By Debarati Roy

Hedge funds cut wagers on a gold rally to a five-year low as a record quarterly drop drove prices below $1,200 an ounce for the first time since 2010 and Goldman Sachs Group Inc. forecast more declines.

Money managers reduced their net-long position by 20% to 31,197 futures and options by June 25, U.S. Commodity Futures Trading Commission data show. That’s the lowest since June 2007. Holdings of short contracts climbed 5% to 77,027, the second-highest on record. Net-bullish wagers across 18 commodities tumbled 9%, the most in 12 weeks.

Gold’s 27% slump to the end of June, the worst first-half performance since 1981, erased $60.4 billion from the value of assets in exchange-traded products as investors cut holdings to a three-year low. The metal is poised to snap 12 consecutive annual gains. Banks from Goldman to Credit Suisse Group AG cut their gold forecasts last week after the Federal Reserve said it may taper stimulus as the economy improves.

“The things that supported gold have begun to crack,” said Mark Luschini, chief investment strategist at Janney Montgomery Scott LLC in Philadelphia, which manages about $58 billion of assets. “Worries about inflation have completely disappeared with the Fed talking about ending the easing at some point. As macroeconomic risks diminish, the stool from beneath gold prices has been pulled away.”

Quarterly Losses

Gold futures dropped 23% last quarter, the most since Bloomberg data begins in 1975, and reached $1,179.40 on June 28, the lowest since August 2010. Traders are divided on the outlook for prices this week with 15 surveyed by Bloomberg expecting an advance. Fourteen were bearish and three neutral.

The Standard & Poor’s GSCI gauge of 24 commodities tumbled 6.7% last quarter, the most in a year. The MSCI All- Country World Index of equities slid 1.2%. The dollar rose 0.2% against a basket of six currencies. A Bank of America Corp. Index shows Treasuries lost 2.2%. Gold futures for August delivery rose 1.1% to $1,237.30 at 10:17 a.m. on the Comex in New York.

Goldman expects prices to drop to $1,050 by the end of next year, 17% less than its previous forecast of $1,270, the bank’s analysts said in a June 23 report. Declines will continue as the Fed trims its bond-buying program and investors sell ETP holdings, the bank said. Fed Chairman Ben S. Bernanke said June 19 the central bank will reduce its $85 billion in monthly asset purchases if the U.S. economy continues to improve.

‘Shattering’ Confidence

Bullion’s declines are “shattering” investors’ confidence and the metal will probably fall to $1,150 in 12 months, Credit Suisse’s head of commodity research, Ric Deverell, said in a report June 25. Morgan Stanley lowered its 2014 outlook by 16% the same day, citing waning demand for haven assets. U.S. consumer sentiment held close to a six-year high in June, while economic confidence in the 17-nation euro area improved more than forecast, separate reports showed last week.

Even if the Fed slows asset buying, countries including Japan and China may continue to stimulate their economies, boosting demand for gold as a hedge against inflation, according to Martin Murenbeeld, the chief economist at Toronto-based DundeeWealth Inc., which manages about C$100 billion ($95 billion) of assets.

Japan is making monthly bond purchases of more than 7 trillion yen ($70.6 billion). Bullion priced in yen reached the highest since March 1980 in April. The People’s Bank of China will work to maintain market stability, Governor Zhou Xiaochuan said June 28. The country’s benchmark money-market rate fell the most since 2011 that day. Bullion rose 38% since the end of 2008 as policy makers printed money on an unprecedented scale to boost growth.

‘Money Floating’

“With all the easy money floating and some economies continuing to stimulate, we will see inflation, and gold will find favor at some point,” Murenbeeld said. “Gold is going through a mid-cycle correction, but the fundamentals for higher prices remain intact.”

Money managers pulled $2 billion from gold funds in the week ended June 26, according to Cameron Brandt, the director of research for Cambridge, Massachusetts-based EPFR Global, which tracks money flows. Total outflows from commodity funds were $2.68 billion, according to EPFR.

Bullish bets on crude fell 11% to 232,194 contracts, the biggest drop since February, CFTC data show. Platinum holdings slumped to the lowest since August as prices fell for a fifth straight month, the longest slide since 2001. Palladium wagers dropped the most in 11 weeks. The metal tumbled 12% in June.

Economic Growth

Investors increased their net-short position in copper to 32,599 contracts, from 29,018 a week earlier, CFTC data show. Prices fell 7.1% in June, the most in 13 months. Goldman cut its outlook for the metal saying slowing economic growth in China will crimp consumption. Supplies will outpace demand through 2016, the bank said in a June 25 report.

A measure of net-long positions across 11 agricultural products gained 5.9% to 313,428 futures and options. The S&P’s Agriculture Index of eight commodities plunged 10% last month, the most since September 2011.

Bullish corn positions dropped 5% to 70,701 contracts, the fourth consecutive decline and the longest slump since January. Prices reached a 32-month low on June 28. Soybean holdings reached the lowest in four weeks. U.S. farmers will plant more grain than forecast and the largest oilseed crop on record, the government said June 28.

Planting of corn, the biggest domestic crop, jumped to 97.379 million acres, the most since 1936, the U.S. Department of Agriculture estimates. Analysts in a Bloomberg survey expected 95.431 million. Wheat acreage reached a four-year high of 56.53 million and soybeans were sown on a record 77.728 million acres.

“A slowdown in China, coupled with rising supplies does, not augur well for commodities,” said Jeff Sica, who helps oversee more than $1 billion as the president of Sica Wealth Management in Morristown, New Jersey. “We are in an era of lower commodity prices.”

See the original article >>

Russia and China building their gold reserves

By Alasdair Macleod

Western economic commentary on China and Russia is usually colored by monetarist assumptions not necessarily shared in Moscow and Beijing. For this reason, Russian and Chinese fiscal and monetary policies are misunderstood in financial markets, as well as the reasons their governments buy gold.

China has been notably relaxed about her own people acquiring gold, and the government itself appears to be absorbing all of China’s mine output. Russia is also building her official reserves from her own mine supply. The result over time has been the transfer of aboveground gold stocks toward these countries and their allies. The geo-political implications are highly important, but have been ignored by western governments.

China and Russia see themselves as having much in common: They are coordinating security, infrastructure projects and cross-border trade through the Shanghai Cooperation Organisation. Furthermore, those at the top have personal experience of the catastrophic failings of socialism, which have not yet been experienced in Western Europe and North America. Consequently neither government subscribes to the economic and monetary concepts prevalent in the West without serious reservations.

We saw evidence of this from Russia recently, with Putin’s appointment of his own personal economic adviser, Elvira Nabiullina, as the new head of Russia’s central bank. Ms Nabiullina is on record admiring, among others, the writings of Robert Higgs – a leading U.S. economist of the Austrian School. She is therefore likely to take a strong line against the expansion of bank credit, which is confirmed by Russian commentators who believe she will prioritize reforms to strengthen bank balance sheets.

She is not alone. The People’s Bank of China recently let overnight money-market rates soar to over 20%. The message is clear for those prepared to look for it: They are not going to fuel an extended credit bubble. The two countries have learned how damaging a bank-credit-fuelled business cycle can be, and are determined to restrict bank lending. Western commentators find this hard to understand because it does not conform to the way western monetary policy works.

It seems that the leaders of both Russia and China are also painfully aware of the importance of currency stability in a way the West is not. The comparison with the West’s reckless monetary policies is stark. It follows that Russia and China are increasingly concerned about the major currencies, given both countries have substantial trade surpluses. Their exposure to this currency risk explains their keenness for gold. Furthermore, they know that if the renminbi and the rouble are to survive a western currency crisis, they must have the sound-money credibility provided by a combination of monetary restraint and gold backing. And the reason China is happy to let her citizens plough increasing amounts of their savings into gold is consistent with ensuring her people buy into sound money as well.

While the Chinese and Russian governments are authoritarian mercantilists, there are elements of the Austrian School’s economics in their approach. The tragedy for the West and Japan is they have embarked on the opposite weak-money course that can only end in the ultimate destruction of their currencies, leaving Russia and China as the dominant economic powers.

See the original article >>

Stocks need to do this, to have a great second half of 2013!

by Chris Kimble

CLICK ON CHART TO ENLARGE

Well the first half of 2013 is behind us and the S&P 500 had a great first half, gaining over 12%.  Two of the broadest index's that had a good first half as well, ran into an confluence of Emotipoints dating back several years recently at (1) in the above chart.

For the NYSE, Wilshire 5000 to have a good second half, they need to... hurdle above the key resistance lines a (1)!

See the original article >>

Rate of Gold Decline is Unsustainable

by Erik McCurdy

Gold closed sharply lower today, moving down to a new low for the cyclical downtrend from 2011. As expected, the breakdown of the descending triangle formation last week has been followed by a severe decline during the last five sessions.

gold-crash

Follow up:

Click on any chart for larger image.
2013/06/26/ta/gold

In September 2011, our cycle analysis predicted the formation of a long-term top in the gold market. Following the development of a consolidation formation from late 2011 until early 2013, prices moved below congestion support in the 1,550 area. As expected, the breakdown was followed by a severe decline of 23 percent during the last three months. However, the cyclical downtrend is moving lower at an unsustainable rate and it will almost certainly be followed by a violent oversold reaction.

2013/06/26/gold_weekly

The Gold Miners Index has lost two-thirds of its value during the cyclical bear market and it is also experiencing an unsustainable decline.

2013/06/26/gdm_weekly

Given the historic expansion in the monetary base since 2008, the fundamental foundation for the secular bull market in gold remains intact and we are likely several years away from the terminal phase of the rally.

2013/06/26/fred_m0

Cyclical corrections such as this one are healthy developments as they purge speculative excesses from the market, thereby preparing it for the next phase of the advance. Additionally, they provide long-term investors with opportunities to add to their positions. As always, those accumulation opportunities are best identified through the use of optimal entry points as defined by the judicious application of chart analysis and we will report those opportunities as they develop.

See the original article >>

"Risk On" Sentiment Returns In Aftermath Of Stronger European Manfucaturing Data

by Tyler Durden

Following the Friday plunge in the ISM-advance reading Chicago PMI, it was a night of more global manufacturing data, which started off modestly better than expected with Japanese Tankan data, offset by a continuing decline in Chinese PMIs (which in a good old tradition expanded and contracted at the same time depending on whom one asked). Then off to Europe where we got the final print of the June PMI which continued the trend recent from both the flash and recent historical readings of improvement in the periphery, and deterioration in the core. At the individual level, Italy PMI rose to 49.1, on expectations of 47.8, up from 47.3; while Spain hit 50 for the first time in years, up from 48.1, with both highest since July and April 2011 respectively. In the core French PMI rose to a 16-month high of 48.4 from 48.3, however German PMI continued to disappoint slowing from 48.7, where it was expected to print, to 48.6. To the market all of the above spelled one thing: Risk On... at least until some Fed governor opens their mouth, or some US data comes in better than expected, thus making the taper probability higher.

More PMI by country:

  • Ireland 50.3: 4-month high
  • Spain 50.0: 26-month high
  • Italy 49.1: 23-month high
  • Netherlands 48.8: 4-month high
  • France 48.4: (flash 48.3) 16-month high
  • Austria 48.3: 4-month high
  • Greece 45.4: 24-month high
  • Germany 48.6 (flash 48.7): 2-month low

Overall, at the macro level Markit reported that the Final Eurozone Manufacturing PMI at 16-month high of 48.8 in June up from a flash: 48.7, with the PMIs rising in all nations except Germany. How sustainable is this latest bifurcation at a time when the periphery-supporting carry trade is ending will be seen very soon.

The above manufacturing data, together with hope that China's liquidity situation may be normalizing following yet another drop in Chinese SHIBOR reats (it isn't, and once the market realizes that China is effectively undergoing a $1 trillion deleveraging the eye of the hurrican will shift) has set a mood of optimism for the first day of the second half, sending US futures sufficiently high to nearly offset all of Friday's losses.

More on sentiment from Ransquawk:

Stocks in Europe continue to edge back toward their best levels of the session, as market participants react positively to reports that Japonica Partners amended its Greek bond offer and increased total size of offer to EUR 4.0 bn from EUR 2.9 bn, however at a price of 40% of par, compared to 45 cents a month ago.

  • Of note, Japonica Partners said it would purchase the Greek bonds issued last year through a tender offer that expires today. Japonica said it planned to purchase almost 10% of the total debt outstanding, which has a face value of EUR 29.6 bn.
  • Peripheral bond yield spreads are seen tighter by 8-13bps, while the Euribor curve is trading marginally steeper. However credit spreads continue to show signs of improvement, with the iTraxx Crossover index down 8 bps
  • Stocks being driven higher by consumer services and industrial sectors. The risk on sentiment remains supported by better than expected macroeconomic data out of Europe and the UK this morning. While overnight in Asia, the Nikkei 325 also benefited from a positive BoJ Tankan survey, which pointed to an improving outlook to Japan's industries.

On today's docket we have Manufacturing ISM which should make for interesting reading in light of last Friday’s
disappointing Chicago PMI print which came in at 51.6 vs the previous
month’s reading of 58.7 and consensus expectations of 55.0. In keeping with the tradition of Baffle with BS, we expect the ISM to come in well above expectations to offset the major Chicago PMI disappointment.

* * *

Goldman has more on the European June PMI data:

Bottom line: The Euro area final manufacturing PMI for June printed at 48.8, 0.1pt higher than the Flash reading (and consensus expectation). The June final manufacturing PMI stands 0.5pt higher relative to the May reading and 2.1pt above the April reading. Among the large Euro area economies, material increases in June were registered in France, Italy and Spain, while a somewhat noticeable (0.8pt) decline was recorded in Germany.


1. The final reading of the June manufacturing PMI for the Euro area was 48.8, one tenth above the flash reading released on June 20. This Final/Flash difference is somewhat consistent with developments since January, where the final manufacturing PMIs have been 0.2pt higher than the Flash print on average.

2. The final Euro area manufacturing PMI was up half a point in June, building on previous gains in May. The index now stands at its highest level since February 2012 and has generally been trending upwards since reaching a trough of around 44 during last summer.

3. The forward-looking orders-to-stocks difference rose further as the increase in the 'new orders' sub-component (0.3pt) was higher than the increase in the 'stock of finished goods' sub-component (0.1pt). New orders rose more materially in May and with the (small) increase in June, Euro area new orders now stand 4pt higher than in April and at the highest level since mid-2011.

4. The figure for Germany was revised down marginally relative to its Flash reading. The German manufacturing PMI came in at 48.6, 0.1pt down relative to its Flash and 0.8pt down on the month. In contrast, the French PMI came in one tenth above the Flash reading, and the index rose 2pt on the month to 48.4 (Chart 1). The German manufacturing PMI decline in June may be related to the flooding, and other German business indicators, such as the flash services PMI and the Ifo, showed robust increases in June.

5. Unlike Germany and France, the Italian and Spanish manufacturing PMIs do not provide a flash reading. Both the Italian and Spanish PMI showed a monthly gain; now for the third consecutive month. The June Italian manufacturing PMI rose from 47.3 to 49.1, notably higher than expected (Cons: 47.8). The Spanish PMI also surprised on the upside in June, improving from 48.1 to 50.0 (Cons: 48.5).

6. Manufacturing PMIs outside the four major Euro area economies rose modestly on the month. The largest increase was registered in Ireland which rose half a point (to 50.3). The manufacturing PMI for Greece and the Netherlands also ticked up (Chart 2).

7. In our macroeconomic forecast, we expect the Euro area recession to continue in the first half of 2013, with a stabilisation of economic activity in the second half of the year and a very modest recovery in area-wide GDP towards year-end. Both our PMI-based indicator and the Euro area CAI improved for a third consecutive month after declines in February/March.

* * *

DB's Jim Reid has the full weekend event recap, and what to look forward to:

The week ends with a payroll report that will have the market on tapering tenderhooks although Independence Day the day before might leave the markets more sparsely populated than usual for such a big release. As we stand, consensus is forecasting a 165k and 175k gain in the headline and private payrolls respectively (vs 175k and 178k previous). The unemployment rate is expected to tick down to 7.5% from 7.6%. A number around this level won't really settle the tapering argument but one notably below or above will certainly lead the arguments fairly aggressively one way or the other. So with time running out until the September FOMC, such prints are going to be huge for markets. Other important data releases include today's ISM manufacturing (consensus 50.5) and all the usual equivalent PMI numbers from around the globe. China has kicked off proceedings this morning with an official manufacturing PMI reading for June of 50.1. Though in line with consensus estimates, the result is the lowest in four months. Meanwhile the final HSBC manufacturing PMI came in at 48.2, slightly below a preliminary reading of 48.3 and 1pt below the final May reading of 49.2.

The reaction from Asian markets this morning to the Chinese data has been relatively muted. Most Asian equities are trading about half a percent lower but this was partly driven by the late sell-off in US equities on Friday which saw the S&P500 (-0.43% on the day) lose 0.6% in the final half hour of trading. The Hang Seng is closed for a public holiday today while the Shanghai Composite (-0.8%) and ASX200 (-1.4%) are both softer. The Nikkei is +0.4% helped by a strong Tankan quarterly survey which continues the recent run of better Japanese data. The large manufacturers’ index improved to 4 versus estimates of 3 and Q1’s reading of -8. The large manufacturers’ outlook component increased to 10 (vs 7 expected and -1 previously). The dollar-yen’s creep back up to 100 (99.4 as we type) is also helping sentiment in Japanese equities.

Aside from the PMIs there was also a fair bit other China-related news over the weekend. Firstly, there were some interesting comments from President Xi over the weekend on growth. The state news agency, Xinhua, quoted President Xi as saying that the performance of government officials shouldn’t be judged solely on their record in boosting GDP growth and more importance should be placed on improving people’s livelihood, social development and environmental quality.

Some commentators have taken this to mean that top officials are legitimising the case for slower growth. As far as bank liquidity is concerned, the Chairman of China’s banking regulator said in a speech over the weekend that banks had about RMB1.5trillion in excess reserves as of June 28th that could be used for payment and settlement needs, or 2x normal requirements.

We should also note the ECB meeting this week which could be interesting even if the general consensus is for no changes in refi/deposit rates. At moment only one economist surveyed by Bloomberg is expecting the ECB to cut the refi rate, and no economists are expecting a cut in the deposit rate to negative territory at this meeting. Nevertheless, Draghi's press conference usually offers up something for the market to pounce upon. Also worth watching out for is chatter about redemptions now we've passed H1 end. This has been scaring a lot of people I've talked to over the last week or so. Will there be a deluge post month/half year end in EM (equities and FI), rates and credit? That's the billion dollar question.

Over the next 24 hours, final Euroarea PMIs (including the first readings for Spain and Italy) and the US ISM manufacturing will be attracting most of the attention. The ISM should make for interesting reading in light of last Friday’s disappointing Chicago PMI print which came in at 51.6 vs the previous month’s reading of 58.7 and consensus expectations of 55.0. Over the course of the rest of the week, there will be plenty of economic data releases as we build up to the Thursday’s ECB meeting and Friday’s all-important payrolls.

Starting with Tuesday, we have US factory orders and the RBA’s board meeting. On Wednesday, the focus will be on the services PMIs for China and the Euroarea. The US non-manufacturing ISM and ADP employment prints will provide the final indications on the trend in employment ahead of Friday. US equity markets shut early on Wednesday ahead of Independence Day on Thursday. On Thursday, we have the ECB meeting/Draghi press conference together with the BoE’s first MPC meeting with Carney at the helm. Friday will be all about payrolls, but we should also highlight that German factory orders and Spanish IP will be released on the day.

* * *

SocGen's macro highlights see, not surprisingly, the ECB's wednesday meeting the the Friday NFP as the key events of the week.

Anything but a quiet start to the week and the second half of the year is pencilled in for today in the wake of Friday's whipsaw price action across different asset classes. A good deal of anxiety has returned to the market after a deceptive bounce in risk assets in the middle of last week, and which has accordingly seen positions adjusted in the light of dovish central bank speak (Fed, ECB, BoE). Gold in particular (and the ZAR as a result in EM FX) continues to bear the brunt of corrective flows and technically the slide may not be over until stability returns around the $1,155 level even as prices are staging a decent $20 bounce overnight.

This week is indeed all about the ECB and US non-farm payrolls, two events separated by the 4th of July holiday in the US, and so there will be a 24-hour stint where liquidity could be poor and thus have a significant bearing on the price action. If the ECB was surprisingly neutral last month, risk/reward suggests a more candidly dovish message this time despite a round of better data. As we pointed out on Friday, the constellation has changed after the spike in periphery yields and council members gave the game away last week by stressing the importance of accommodation in the light of rising US yields to keep control of funding and borrowing rates in the periphery. Fresh policy initiatives are unlikely to be on the table, but press reports that a ‘360-degree review' of the ECB's tools is underway means concrete measures may soon be presented if the periphery sell-off worsens. Ironically, US payrolls data on Friday may be the judge of that. Solid data will nudge the Fed closer to tapering and could bring about another leg of higher yields. The SG forecast of the manufacturing is 51.5, above the consensus of 50.5. Also due today are final EU PMIs, CPI, unemployment and the UK manufacturing PMI.

Ahead of the RBA decision tomorrow, AUD/USD sank to a 33-month low on Friday and, briefly trading below 0.9144, will have pushed bulls deeper into hibernation. Technicians are targeting a 6% move to 0.8550 from here, and could get some help from the central bank if another dovish message is rolled out in the statement. Given the weak data from China lately, there could be another push lower in short-term Australian yields.

See the original article >>

Brokers, Goldman see cut to US corn acres estimate

by Agrimoney.com

Commentators such as Allendale, Goldman Sachs and RJ O'Brien warned over the potential for US farm officials to cut a forecast for corn sowings, amid questions over the methodology used in compiling the estimate.

The US Department of Agriculture on Friday sent prices of Chicago's best-traded corn futures contract tumbling 5% by revealing that growers had sown 97.4m acres with the grain, a rise of 100,000 acres from initial intentions.

Investors had expected a figure of 95.3m acres, reckoning that a spring which was record wet in some areas had forced farmers to abandon some areas, or at least switch them to later-sown crops such as soybeans.

However, while December corn futures on Monday came under further selling pressure, driving them to a near-18-month low at one point, losses were limited to 0.9% as of 12:30 UK time (06:30 Chicago time) amid doubts over the accuracy of the data.

"Many are looking at the planted acreage number as unbelievable," Paul Georgy at Allendale, the Illinois-based broker, said.

Timing issue?

The report came under criticism for its methodology, in including plantings completed as of, at the latest, June 15 during a sowing season when, thanks to the delayed sowings, many farmers were still in the thick of seeding activity.

"We must remember that the data for Friday's report was taken from a survey of producers in early June at a time when producers still believed they were going to get their crops in the ground," Mr Georgy said.

At Rice Dairy, chief feed grains analyst Jerry Gidel restated "concern about the USDA's timing of this year's survey of acreages not revealing the total impact of 2013's wet spring".

Goldman Sachs also flagged that risk that farmers chose "to abandon corn planting after the USA survey was conducted".

… or would area have been bigger still?

However, another theory for the apparent discrepancy emerged too, supporting the idea of higher sowings - that growers may have understated corn sowing intentions in the USDA's initial survey, in March.

"The reason the corn acreage actually increased from the March Intentions report of 97.3m acres is that actual corn acres would have been over 99m acres if the weather had been supportive," Darrell Holaday at Country Futures said.

"We have talked endlessly about the fact that USDA was not picking up the increased acreage from pasture ground and [released from environmental programmes] that had become crop ground over the last couple of years. They have finally begun to reconcile those numbers."

Goldman Sachs also highlighted the possibility that the "USDA's March forecast had underestimated true planting intentions", with the 97.4m-acre forecast "actually reflecting the acreage cut contemplated by consensus".

Nonetheless, Goldman analyst Damien Courvalin said that the bank expected the sowings data "to be revised, with our bias towards a lower corn acreage", but showing wider plantings of soybeans than the 77.7m acres indicated on Friday.

Chicago broker RJ O'Brien raised its forecast for corn sowings in 2013, but to 96.65m acres, some 750,000 acres short of the USDA estimate

Wheat question

Separately, the USDA data on wheat sowings, showing farmers planted 12.3m acres with spring wheat, some 200,000 acres more than investors expected, also attracted questions given the extent to which waterlogging affected farmers in some northern US areas.

"I didn't see a big push to plant wheat the later it got," Brian Henry at Benson Quinn Commodities said.

At Macquarie, Chris Gadd said that even the 12.3m-acre number, "in conjunction with the loss in spring wheat planting area that was reported in Canada last week breeds further concern for global supplies of quality wheat".

Macquarie has, among other commentators, cautioned that while the world wheat harvest looks like turning out strong on volume this year, ample supplies of high-quality grain are not yet assured.

See the original article >>

EMI Weekly Price Performance

By Dominick Chirichella

See the original article >>

June Macro Strategy Review

by Jim Welsh

Forward Markets: Macro Strategy Review

Macro Factors and Their Impact on Monetary Policy,

The Economy and Financial Markets

U.S. Economy

Although corporate earnings were decent in the first quarter, they could be vulnerable if revenue doesn’t pick up in coming quarters. According to Global Equity Analytics & Research Service, sales growth fell for two-thirds of the companies in the Dow Jones U.S. Total Stock Market Index in the first quarter. The index includes every U.S. stock traded in the U.S., excluding bulletin board stocks. As such it includes more companies than any other index. Capital weighted average sales growth for the companies in the index fell for a fifth straight quarter to 3.1%. The last time sales growth was this weak was during 2001-2002, which was not a good time for equities. Average net profit margins fell to 24.3%, their steepest decline in 20 years. Profit margins are falling due to rising inventories and receivables, while selling, general and administration costs have begun to rise after companies had cut them to the bare minimum during the recovery. This suggests any further slowing in sales growth will immediately hit a company’s bottom line. Earnings in the first quarter were aided by a special factor: corporate stock buybacks. Corporations purchased $345 billion of their own company stock, which reduced shares outstanding at an annual rate of 8% through May, and contributed more than 30% to first quarter earnings. Boosting earnings through stock buybacks may look good in the short run (and increase the value of executives’ stock options), but the strategy seems to be lacking in the longer-term vision and commitment most companies need to innovate and prosper in the future.

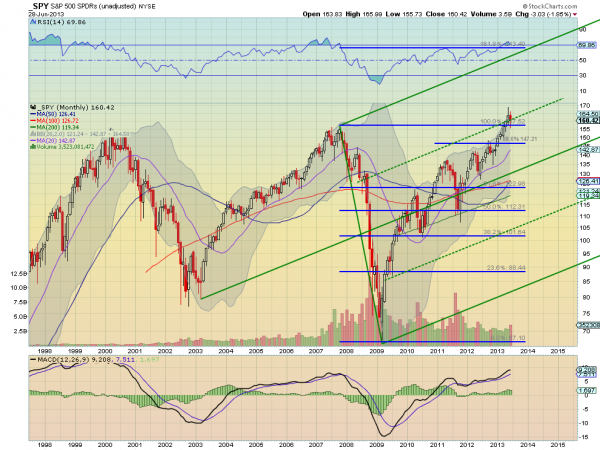
In April and May, good and bad news alike were treated as good news by investors since the Federal Reserve was likely to maintain the third round of quantitative easing, or QE3. This one-way psychology was reflected in surveys of investor sentiment. We cited the Barron’s Big Money Poll in our April commentary, which found that 74% of responding money managers described themselves as bullish or very bullish for the balance of 2013. This was the highest level of bullishness in the 20-year history of the Big Money Poll. Incredibly, 86% were optimistic for the next 12 months, and 94% thought the next five years would be good. In our April commentary we thought the bullish psychology surrounding QE3 could lead to a blow off in the stock market that might carry the S&P 500 Index to between 1680 and 1700. The high on May 22 was 1687.

The bullish psychology generated by QE3 was also manifested in other markets. Leveraged loans are used by heavily indebted companies to finance growth, acquisitions and capital investments. Banks underwrite the loans, but distribute most of the debt to investors, including high yield bond funds. As demand increased in 2012 from investors looking for higher yielding alternatives to government bonds or certificates of deposit, Wall Street distributed $465 billion in leveraged loans, not much below the all-time record of $535 billion in 2007. According to data provider S&P Capital IQ, Wall Street sold $78 billion in leveraged loans in February 2013, eclipsing the prior record of $71 billion in February 2007. In addition, the quality of the loans deteriorated. The average borrower of leveraged loans carried a debt load of 4.8 times earnings, near the average ratio in 2007, and up from 4.3 last year. More than half of the loans sold in the first quarter didn’t include basic investor protections, compared to a peak of 25% in 2007. Who says history doesn’t repeat itself?

Chart
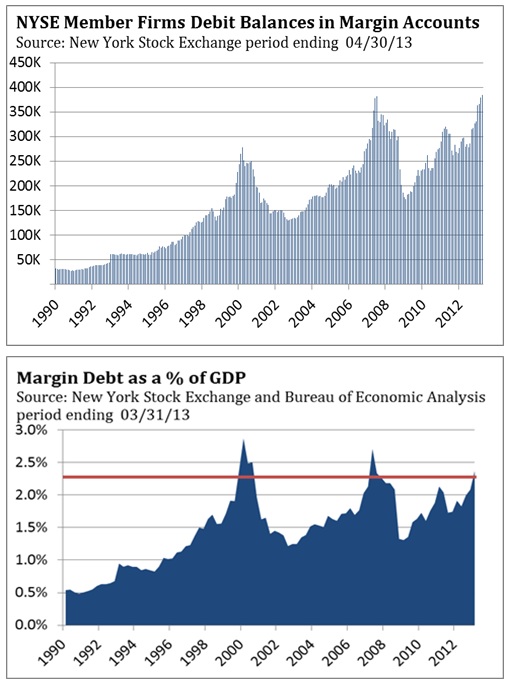
Despite the record supply of leveraged loans of ever-decreasing quality, demand was nearly insatiable. On May 8, the yield on the Barclays U.S. Corporate High Yield Bond Index fell to a record low of 4.97%. With the stock market scaling new heights, stock investors decided it was time to leverage their equity investments. In April, margin debt rose to a record $384 billion, surpassing the prior peak of $381 billion achieved in 2007, according to the Financial Industry Regulatory Authority. Margin debt has only exceeded 2.25% of gross domestic product (GDP) on three occasions: December 1999, March 2007 and January 2013. In 1999 and 2007, the stock market rallied for three to six months before topping, while the high in May this year was four months after margin debt reached 2.25% in January.

Since the beginning of 2013, the debate within the Federal Reserve about the benefits of QE3 and its negative unintended consequences intensified. Members of the Federal Open Market Committee (FOMC) have expressed concerns about its potential to spark inflation, create distortions in the credit market and increase risk-taking by investors reaching for yield. In recent months, a number of FOMC members have publically discussed the activity in the leveraged loan market, real estate investment trusts (REITs) and the overall reach for yield by investors into more risky investments. More evidence of this activity was seen in the issuance of leveraged closed-end fund structures and the increasing appetite of Japanese investors for levered U.S. REIT portfolios. We think the Federal Reserve concluded it was time for the markets to receive a sobriety checkup, which is why Chairman Ben Bernanke discussed the conditions under which the Federal Reserve would begin scaling back the amount of its QE3 purchases in his congressional testimony on May 22. Within minutes of Bernanke’s comments, the stock market reversed from all-time highs and the yield on the 10-year Treasury bond jumped above 2%. Investors were shocked that the free lunch quantitative easing has provided investors since 2009 might actually come to an end some day. When Chairman Bernanke reaffirmed the Fed’s commitment to “tapering” QE3 after the FOMC meeting on June 19, financial markets convulsed, sending stocks plunging and bond yields soaring.

Here’s our take on the situation. Given the current level of economic growth, unemployment rate and inflation, the Federal Reserve will not scale back their QE3 purchases next month. Any action will be dependent on incoming data and whether GDP growth, the unemployment rate and rate of inflation trend toward the Federal Reserve’s forecasts. The Fed expects GDP growth of 3-3.5% in 2014, the unemployment rate to fall from 7.5% to 6.5-6.7% and inflation to rise toward 2%. Our expectation is that QE3 may continue at its current level through 2013 since growth is unlikely to accelerate as forecast, muting the expected improvement in the unemployment rate. And weak global aggregate demand and excess capacity will keep inflation from rising as forecast. The sharp increase in mortgage rates only reinforces our view.

Since the recovery began in June 2009, the number of jobs has increased just 3.9%, versus the 9.7% average for all post-World War II recoveries. This is why 11.8 million people remain unemployed after four years of recovery.Chart 
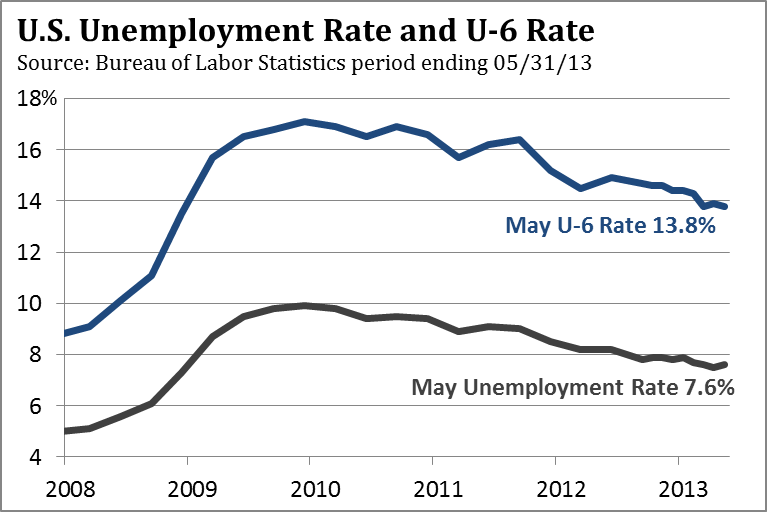
There are two million fewer people working now than in December 2007. The U.S. needs to generate 100,000 new jobs each month just to keep up with population growth and new entrants coming into the labor market. This means another 4.8 million jobs would have been needed over the past 48 months just to accommodate new workers. The true job shortfall in the number of jobs since 2007 isn’t two million jobs, but 6.8 million jobs. Since “real” job growth begins above 100,000 and not zero, actual job growth has been 72,000 per month over the last year, not the 172,000 as reported. This is one reason why the average jobless person remains out of work for 36.9 weeks. Annual growth in hourly pay for production workers and non-supervisors has been below 2% for 21 of the past 22 months. The earnings of the majority of those who are working are not keeping up with the increase in the cost of living. According to the Bureau of Economic Analysis, disposable personal income as of the end of March has climbed a total of 10.5% over the last five years. That is the smallest increase over any five-year period going back to 1959.

The Federal Reserve’s preferred measure of inflation is the core index of personal consumption expenditures (PCE), which excludes food and energy. The Fed would like to see the core PCE near 2%, but not above 2.5%. Chart
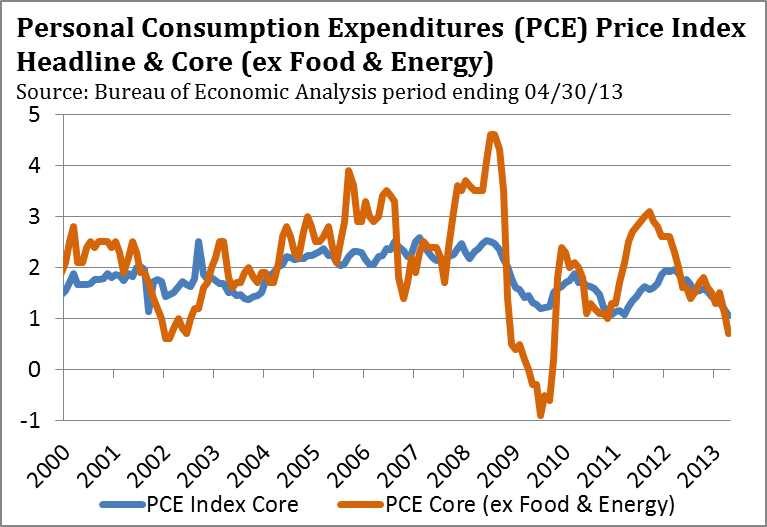
However, since early 2012, the core PCE has been trending lower, falling from just under 2% to 1.1% in May—one of the lowest readings in the index’s 54-year history. Inflation is the result of rising wages and too much money chasing too few goods and services. Neither is happening now and there is nothing on the horizon that suggests a pickup in inflation is right around the corner. Globally, there is an overcapacity of labor and production capacity. Between inflation and deflation, deflation is the greater risk.

China – An Echo Credit Bubble

In the United States between 1982 and 2007, total market credit as a percent of GDP grew from 165% to 350%. This means that for each $1.00 of GDP there was $3.50 of debt. The surge in debt during this 25-year period assisted economic growth and enabled GDP to grow faster than it would have without the extra boost from debt-fueled demand. The prime beneficiary of the increase in debt was home prices, which jumped from 3.2 times median income in 2000 to 4.7 times median income in 2007. The deflation of home values was the primary cause of the 2008 financial crisis, as leveraged bets on home prices blew up. More than 11 million homeowners were forced into foreclosure, as more than 8 million workers lost their job and others, still employed, were undone by ballooning mortgage payments. Investment banks were forced to seek a taxpayer bailout after the use of 30 to 1 leveraged dispelled any misguided notion they were “masters of the universe.” European bankers proved they were no smarter than their U.S. counterparts, and European consumers were just as gullible in their willingness to buy overpriced homes. In response to the financial crisis, the U.S. government and governments throughout Europe significantly increased government spending. The resulting large budget

deficits were used to replace the loss of consumer demand as unemployment soared in every developed nation and to prevent a far deeper recession from developing.

In 2009 China instituted a two-year, $586 billion stimulus program (equal to 16% of GDP). However, the Chinese government has in recent years relied more on forced lending through state-run banks to maintain growth to offset the impact of Europe’s recession and slow U.S. growth. According to McKinsey Global Institute, a global management consulting firm, China’s debt-to-GDP ratio rose to 183% in mid-2012 from 153% in 2008. However, if lending by trust companies and other sources in China’s “shadow banking” system is included, the debt-to-GDP ratio is above 200%, according to estimates by Nomura Holdings, a Japanese financial holding company. Total social financing, China’s broadest measure of credit since it includes bank lending and credit created outside formal banking channels (i.e. trust companies), increased an extraordinary 52% in the first five months of 2013 as compared to 2012. This suggests Nomura’s estimate is likely more accurate.

Compared to the United States’ total market credit ratio of 350%, and many European nations whose ratio of total debt-to-GDP exceed 400%, China appears a paragon of credit prudence. However, under the surface there are a number of cracks in China’s growth foundation that are concerning. According to the International Monetary Fund (IMF), rapid increases in a country’s total credit to GDP ratio can prove problematic. An IMF analysis of quick increases in credit growth over the last 40 years found that about one-third of the occurrences ended in a crisis, and subpar growth in subsequent years in another one-third of instances. China tried to slow credit growth in early 2010 and quarterly GDP growth weakened in 10 consecutive quarters through the third quarter of 2012. Credit growth resumed in April 2012 and continued through the first five months of 2013. Since economic activity lags changes in monetary policy by about six months, the recent surge in credit should continue to stabilize China’s GDP growth between 7 and 8% through the third quarter. The risks are to the downside since electricity output rose 4.1% in May versus 6.2% in April. Electricity output is a proxy for industrial activity and suggests recent GDP data may be overstating China’s actual growth.

In April and May, the People’s Bank of China (PBOC) moved to curb the explosion of credit growth that began in April 2012. In May, total social financing fell by one-third to $194 billion, after also declining in April. New bank lending, which is a subset of total social financing, also registered a significant decline. Despite the pullback in credit growth during the last two months, total social financing is still up 52% from May 2012. If the PBOC maintains its less accommodative stance in coming months, China’s economy will likely show signs of slowing sometime in the fourth quarter.

Since the 2008 financial crisis, the People’s Bank of China has alternated between stepping on the gas in 2009, hitting the brakes in early 2010, putting the pedal to the metal in April 2012 and in the last two months, at least tapping on the brakes. Despite this on and off approach, total debt as a percent of GDP continues to climb at a fairly rapid pace. It is not a good sign that the increase in lending since April 2012 is merely stabilizing growth, rather than generating a gain in the rate of GDP growth. In our view, this is a warning sign that China is progressively creating its own credit bubble. This was certainly the case in the U.S. when credit growth rose significantly during the 2004-2007 period without a commensurate jump in GDP.Chart

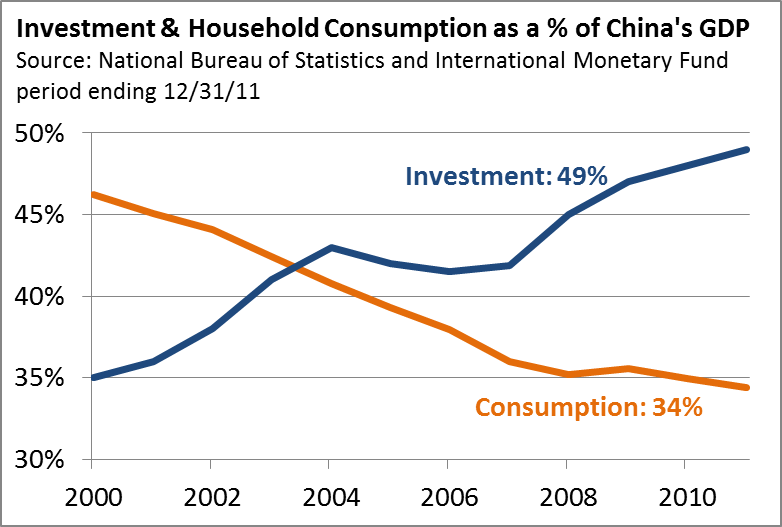
In the IMF analysis of prior rapid increases in a country’s total debt-to-GDP ratio, a growth slowdown occurred one-third of the time. China experienced this after they slowed credit growth in 2010. The risk that China could experience a more significant slowing or a credit crisis within the next three years is rising, especially since the imbalance between fixed investment and domestic consumption remains large. As we discussed in our November 2012 commentary, the surge in China’s growth from 2000 until 2008 was the result of a significant increase in fixed investment that expanded China’s infrastructure and export capacity. Cities for millions of inhabitants were built along with the power grid and power generation to keep these new cities humming. The expansion in export capacity allowed China to capitalize on its low cost of production, so it could increase its exports to Europe and the United States. As a result, fixed investment as a share of GDP rose from 34% in 2000 to 49% by the end of 2011, while domestic consumption contracted from 46% to 34%. By comparison, consumption in the U.S. is 70% of GDP, while fixed investment is 16.2%, according to the IMF.

We noted last November that it was likely to take China many years to correct its overreliance on fixed investment, and that the transition would be made more difficult by Europe’s recession and slow growth in the U.S. Europe is China’s biggest export market, with the U.S. a close second. The slowdown in export sales has created an excess capacity problem that is plaguing China’s export dependent sectors, while domestic demand has not increased sufficiently to offset the slowdown in exports. This is why GDP growth has not picked up and why the surge in lending this year is, in part, a reflection of China reverting to its old ways.  According to the National Bureau of Statistics of China, fixed investment has only dipped from 49% to 46.1% since the end of 2012, while household consumption only experienced a modest increase from 34% to 35.7%.

According to a survey of 4,000 companies by the ManpowerGroup, a workforce solution provider, the net percentage of firms planning to hire workers in the second quarter fell to 12%,

from 18% in the first quarter. This is the lowest increase since the end of 2009. Year-over-year growth in disposable income for China’s urban households fell from 9.6% in 2012 to 6.7% in the first quarter. Weaker job and income growth suggest a meaningful pickup in domestic consumption is unlikely. Export growth was up only 1% in May from a year ago. We expect Europe to remain in recession for the balance of 2013, while growth in the U.S. holds near 2%. The recent decline in the value of the Japanese yen versus the Chinese yuan is also likely to further pressure China’s export competitiveness. A meaningful increase in exports during the balance of 2013 is not likely, nor is a big increase in domestic demand. This suggests that China will not add appreciably to global aggregate demand in the next two quarters.

In the last few years, the reliance on fixed investment to generate GDP growth has resulted in excess capacity in many industries, which is being exacerbated by slowing export growth and relatively tepid domestic demand. Before the 2008 credit crisis, steel, coal, glass, aluminum, cement and solar panels were all sectors that boomed, since these sectors provided everything needed to build out China’s infrastructure and export capacity. Mae West once said that, “Too much of a good thing can be wonderful.” That certainly is not the case in China as the amount of excess capacity in some industries is staggering. According to the National Bureau of Statistics of China, there are currently 3.7 billion square meters of property under construction in China, which is enough to satisfy demand for almost four years without starting a single new property. Steel production overcapacity is becoming a chronic problem. Domestic demand for steel was 684 million tons in 2012 compared to the production of 800 million tons, according to global investment banking firm Jeffries. Since there is more supply than demand, Chinese steel prices have fallen almost 15% in 2013. In a search for buyers, Chinese producers have been exporting some of their excess production to Europe, which has caused European steel prices to fall. Aluminum Corporation of China reported a $158 million loss in the first quarter and said more than 90% of the aluminum produced in China is produced at a loss. In early May, Huaxin Cement said cement makers need to shut down old plants to avoid “catastrophe” for the industry. According to the China Enterprise Confederation, a non-governmental representative of employers, the utilization rate for cement producers in 2012 was 65%.

Chart Firms with government connections are not likely to close excess capacity since they expect to get ongoing financial support. And this is what may prove to be China’s undoing. Chinese state-run banks have lent enormous sums to Chinese state-run companies who have continued to expand capacity, even if it means selling goods at a loss. Part of the 52% increase in total social financing through May was the result of Chinese state-run banks rolling over or extending

bank loans to state-run companies, even those companies running at 70-80% of capacity and barely profitable. Although China can easily continue this charade, international investors may not be so forgiving. At some point (perhaps 2014 or 2015) China could prove vulnerable to large capital outflows that will undermine its growth story and create liquidity problems for China’s state-run banking system. It could also potentially deflate the credit bubble that has been expanding in China since 2008.

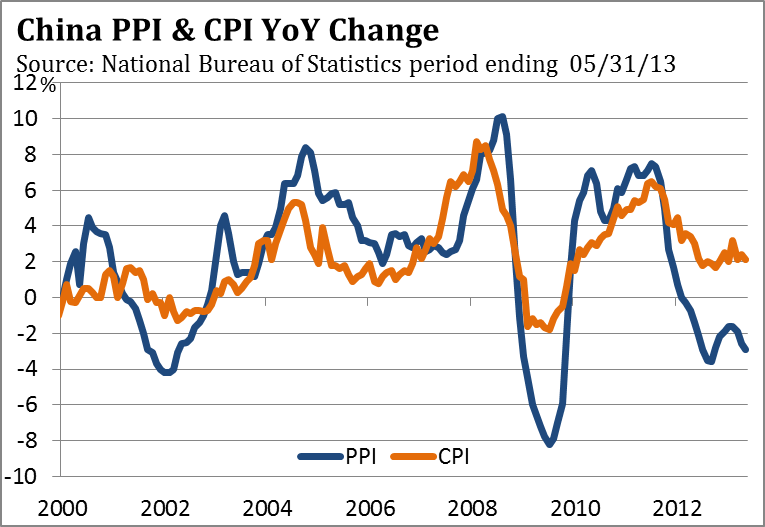
Falling prices as a result of excess capacity are reflected in China’s consumer price index, which has dropped from 6.5% in late 2011 to 2.1% in May. More importantly for Chinese companies, producer prices have declined year-over-year for 15 consecutive months and were -2.9% lower in May than in 2012. If the second largest and fastest growing economy on the planet is experiencing a whiff of deflation, what are the deflationary risks for developed countries with much slower growth and far more debt as a percent of GDP?

Japan — Winning in a Zero-Sum Growth World

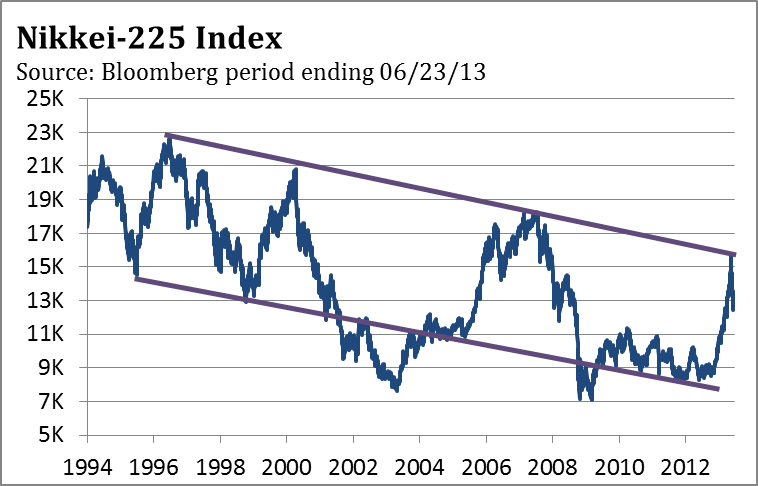
As we wrote in our February 2013 commentary, Japan’s effort to depress the yen’s value was not only risky but had the look of desperation after 20 years of monetary and fiscal policies failed to rejuvenate the Japanese economy. Since last November the yen has lost more than 20% of its value versus the dollar and is down more than 25% against the euro. As we pointed out, there isn’t much difference between a country that cheapens its currency by 20-25% and a country that slaps imports from competing countries with tariffs of 20-25%. This is 1930s protectionism masquerading as 21st century monetary experimentation pioneered by the Federal Reserve with quantitative easing. The Bank of Japan (BoJ) has no idea how this will eventually play out. The bank must be encouraged with the initial impact of “Abenomics,” so named after Prime Minister Shinzō Abe. In the first quarter, GDP surged 4.1%, powered by a pickup in domestic consumption and exports, which grew 10.1% in May from last year. Global equity investors have learned from the Federal Reserve and European Central Bank that quantitative easing is good for stocks. From a low below 8,700 last November, the Nikkei 225, a stock market index for the Tokyo Stock Exchange, soared to 15,760 on May 22, before dropping 20% by mid-June. Interestingly, the Nikkei reversed just below a trend line going back to 1996.

Chart

Amid all the hoopla surrounding the BoJ’s adoption of quantitative easing, global strategists have overlooked the potential negative fallout from the weaker yen. Global economic growth is not likely to increase materially over the next year. Gains in Japan’s GDP will come at the expense of other countries, which are heavily dependent on exports. Exports represent 56% of South Korea’s GDP, 50% of

Germany’s, 37% of Portugal’s, 31% of China’s, 30% of Spain’s, 29% of Italy’s, 27% of France’s and 14% of the United States’ GDP. Given the concentration of export dependence in the European Union, the 25% increase in the euro versus the yen represents another hurdle for Europe as it deals with its recession. Global investors responded to the adrenaline rush from the BoJ’s move to implement quantitative easing. However, the drag from the yen’s depreciation is likely to take six to nine months to ripple through the global economy. In a zero-sum global growth world, Japan’s gain will come at the expense of other nations.

Eurozone

According to Eurostat, the unemployment rate in the 17-nation eurozone rose to 12.2% in April, the highest since records began in 1995. Car sales fell again in May to the lowest level in 20 years, as reported by the European Automobile Manufacturers’ Association. Bank lending continues to contract so any turnaround is still months away. Contrary to most strategists, we expected the eurozone to remain in recession during 2012, and for the recession to continue at least in the first half of 2013. The good news is that the recession is likely to bottom in the last half of 2013. The bad news is that meaningful growth is unlikely anytime soon. The eurozone may not be the drag it has been on global growth since late 2011, but it isn’t going to add much to global aggregate demand in the second half of 2013.
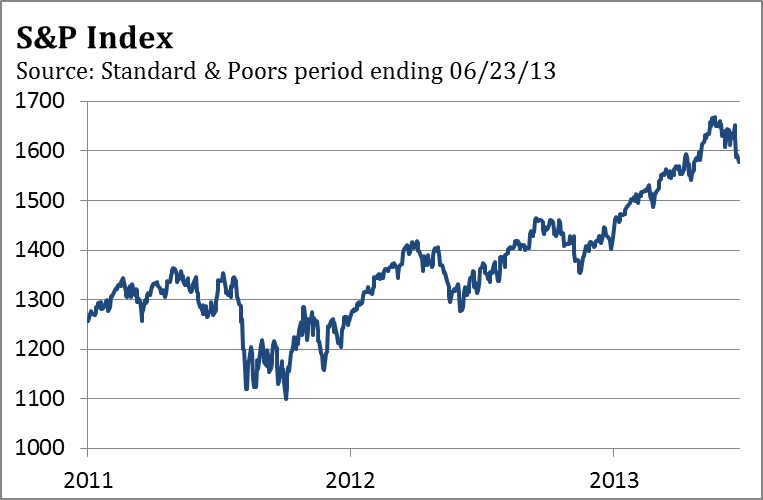
 Chart

Stocks

When the S&P 500 Index reversed on May 22, every major market average had just made a new all-time high, as did the advance/decline line, along with 925 stocks that established a new 52-week high during the week of May 20.  Normally, market prices peak after peak momentum, so it is would be unusual for market prices to top out coincidently with such strong upside momentum. Last month we thought the S&P 500 was likely to retest the break out level of 1,600 at a minimum, which it has done. The initial decline was 89 S&P 500 points to 1,598. After rallying to 1,654, an equal decline of 89 points targeted the index at 1,565, which is just below the 2007 peak of 1,575.  Since the March 2009 low, the S&P 500 has marched higher to new highs, with each intermediate low higher than the previous low. This is the classic definition of an uptrend. As long as the S&P 500 does not breach the April 18 low of 1,536, the long-term trend remains up.

Markets don’t top because there are too many bulls. Markets top when investors are given a reason to sell and doubts about QE3 provided a reason. If the economy fails to validate the Federal Reserve’s forecasts, as we expect, investors will realize their expectations that QE3 will be ending soon are unfounded. That could provide the story that supports another rally and tests the May peak.

Treasury Bonds

Chart 
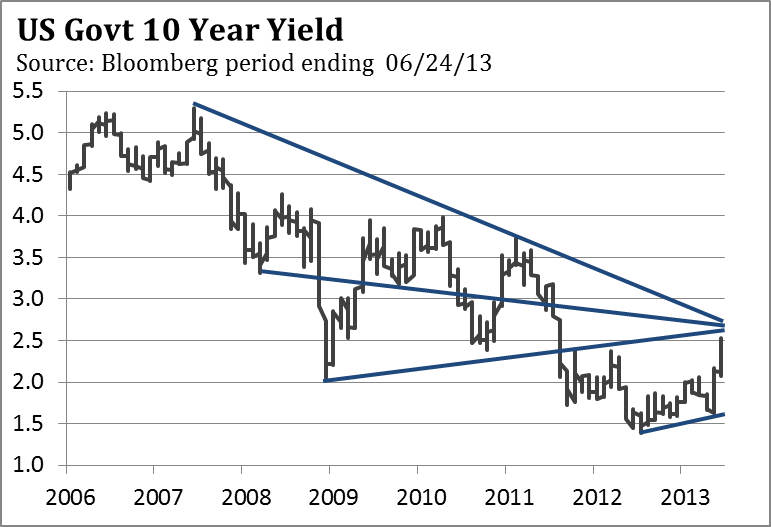
The yield on the 10-year Treasury bond has risen above the peak of 2.4% during March 2012, which is a negative for the long-term trend and lowers the probability that the 10-year yield might challenge the all-time low of 1.39% reached in July 2012. There are a number of trend lines that converge in the area of 2.55% and 2.70%. The initial increase from the July 2012 low of 1.38% was 0.70%, bringing it up to 2.08%. If the current move is a “Fibonacci number”—1.618 times that 0.70% rise—the yield would reach 2.74% (May 3, 2013 low of 1.61% + 1.13%). Technically, the 10-year Treasury bond is approaching an area that could provide intermediate support. If the economy fails to validate the Federal Reserve’s forecasts, as we expect, Treasury bonds could enjoy a nice rally in coming months, especially since bearish sentiment is reaching an extreme.

See the original article >>

Follow Us