Tuesday, June 25, 2013

Consumers to factories point to durable U.S. expansion

By Lorraine Woellert and Jeanna Smialek

Consumers and companies are starting to act as if the economic expansion is here to stay.

Purchases of new homes jumped in May to a five-year high, while business investment plans improved for a third straight month, figures from the Commerce Department showed today in Washington. The last time households were this confident was in January 2008, according to another report.

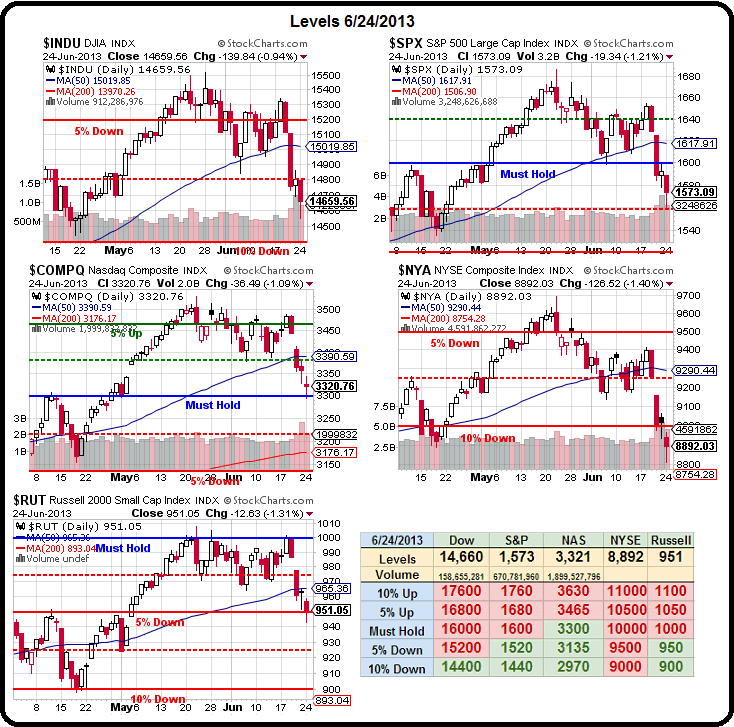
The data point to the self-sustaining expansion the Federal Reserve is seeking to nurture as rising property values boost household wealth and spending, while businesses invest in new equipment to meet growing demand. Stocks climbed, with the Standard & Poor’s 500 index rebounding from a nine-week low, as the figures supported forecasts the economy will overcome a mid- year slump and accelerate in the second half of 2013.

“It’s all good news,” said Mark Zandi, chief economist at Moody’s Analytics in West Chester, Pennsylvania. “The economy is going to gain traction.”

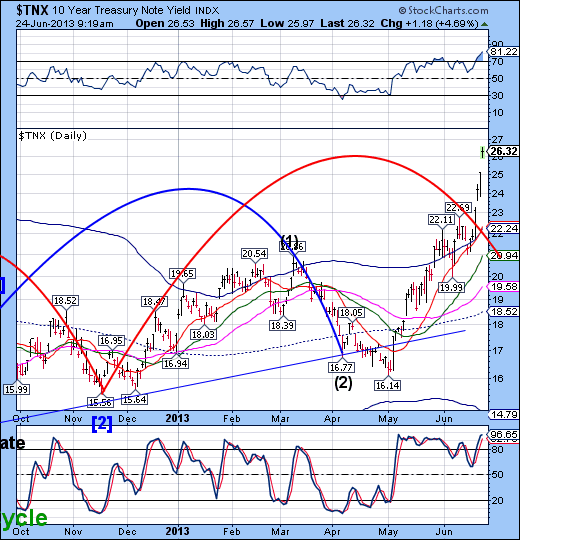
The S&P 500 climbed 0.9% at 1,587.61 at 1:07 p.m. in New York. Treasuries fell, pushing the yield on the benchmark 10-year note up to 2.60% from 2.54% late yesterday, as the data boosted the case for the Fed to slow bond purchases later this year.

Builders sold 476,000 new properties at an annualized rate last month, a 2.1% gain from April, exceeding all estimates in a Bloomberg survey and the most since July 2008, the Commerce Department figures showed. The median selling price climbed to $263,900, up 10.3% from May 2012.

Builder Earnings

Lennar Corp. is among builders seeing increased sales, orders and higher average purchase prices. The third-largest U.S. homebuilder by revenue today reported second-quarter earnings that beat analysts’ estimates.

Miami-based Lennar delivered 4,464 houses, compared with 3,222 homes a year earlier, while the average sales price increased to $283,000 from $250,000. Orders rose 27%.

“Against the backdrop of recent investor concerns over mortgage rate increases, we believe that our second-quarter results together with real-time feedback from our field associates continue to point towards a solid housing recovery,” Chief Executive Officer Stuart Miller said in the statement.

Values of existing properties are also picking up. Home prices in 20 U.S. cities rose 12.1% in April from the same month in 2012, the biggest year-over-year gain since March 2006, a report from S&P/Case-Shiller showed. The 1.7% increase in April from the prior month followed a 1.9% March advance, marking the biggest back-to-back gains since records began in 2000.

Housing Outlook

The demand for housing is driving residential construction and aiding the economic expansion. Consumers who long held off on purchases are entering the market even as borrowing costs rise, encouraged by the increases in property values and gains in employment.

“The housing recovery is alive and well and has a long way to go, and higher rates aren’t going to choke it off,” said Joe LaVorgna, chief U.S. economist at Deutsche Bank Securities Inc. in New York, who projected a gain to 475,000, matching the highest in the Bloomberg survey. “It’s given the economy, or will give the economy, a lot of oomph.”

Americans are gaining confidence as their biggest asset, a house, becomes more valuable. The New York-based Conference Board’s consumer sentiment index increased to 81.4 in June from 74.3 a month earlier, data from the private research group showed.

Other Measures

Today’s figures are in line with the Bloomberg Consumer Comfort Index, which has been hovering around a five-year high reached in late April. American households last week were the least pessimistic about the current state of the economy in more than five years, the Bloomberg index showed.

Spirits are lifting as employment picks up. The Conference Board’s survey showed more consumers thought opportunities will open up in the next six months and an increasing share said jobs were plentiful right now.

Houses aren’t the only thing consumers are more willing to buy as prospects improve. Cars and light trucks sold at a 15.2 million annualized rate in May, putting 2013 on course to be the best year for automakers since 2007, according to industry figures.

The gains in spending, which account for 70% of the economy, are helping to bolster the expansion after government budget cuts took effect in March.

“Unambiguously, the economy is showing signs of improvement despite sizable fiscal drag,” said Jim O’Sullivan, chief U.S. economist at High Frequency Economics in Valhalla, New York. Among the positives “has been the improving labor market, but in addition, wealth in general has been rising, at least up until the last week.”

Early Cutoff

The Conference Board said the cutoff day for responses to be included in the report was June 13. Since then equities have declined, with the S&P 500 dropping 2.5% on June 20, the biggest one-day selloff since November 2011.

Growing demand for cars and trucks and gains in homebuilding are helping counter weakness in export markets, benefiting manufacturers such as BorgWarner Inc. and United Technologies Corp. Businesses may also decide to replace aging equipment, which will help bolster expansion in the second half of 2013.

Orders for durable goods, those meant to last at least three years, climbed a larger-than-projected 3.6% for a second month reflecting broad-based gains, according to figures from the Commerce Department.

Business Investment

Orders for non-defense capital goods excluding aircraft, a proxy for future business investment in computers, electronics and other equipment, climbed 1.1% in May after rising 1.2% and 1.1% in each of the prior two months.

Shipments of those products, a measure used in calculating gross domestic product, rose 1.7%, the biggest gain since November.

“This is the missing piece for an upswing in economic activity,” said Millan Mulraine, director of U.S. rates research at TD Securities USA LLC in New York. “Business capital investment activity is off to a strong showing. If businesses start investing, they’ll add to their workforce.”

Fed Chairman Ben S. Bernanke said last week that the central bank may begin to pare its $85 billion in monthly asset purchases this year if the economy performs as policy makers forecast. The process could be completed by mid-2014, by which time the jobless rate will probably have dropped to around 7%, he said.

See the original article >>

The Big Four Central Banks Muddy The Same Sea Of Liquidity, And Then There's China

by Lee Adler

Shortly after I completed this post, the BoE announced a 200 billion yuan ($32.6 billion) swap line with the PBoC, according to the Financial Times. This is the first time a G7 country has taken a step to provide funding for the PBoC, although Japan already has such a line, according to the FT. Might not the Fed be far behind? What a firestorm that would ignite. The headline, “Bernanke bails out China?” I can’t see it but it would certainly make things interesting if they did.

The world’s major central banks are now working at cross purposes, creating massive crosscurrents that are making life extremely difficult for investors.  This isn’t likely to end soon. In fact, conditions should get worse.

The 4 big central banks in the world are the Fed,  ECB (European Central Bank), BoJ (Bank of Japan), and PBoC (Peoples Bank of China). The BoE, (Bank of England) is far smaller but important from a policy signaling perspective and because of who its counterparties are. They include not only the 3 mammoth British banks that are US primary dealers but all the other major players in world markets, who all have big operations in London.

The Fed, ECB, BoJ, and BoE all deal with the same banks and the securities dealers affiliates of those banks. For example, of the Fed’s 21 Primary Dealers who are the Fed’s sole counterparties, only seven are US domiciled. Three are Canadian banks. Eight are European, including three British banks, and three are Japanese. All of these banks are also major players in Europe and Japan.

These banks are all playing in the same sea of liquidity. When one central bank pumps, that action may impact not only the central bank’s home market, but any or all of the world’s markets. When central banks buy securities, those purchases cash out the counterparty banks and dealers, who then use the cash and the leverage it creates to buy other securities and push asset prices higher. What they buy is up to them. They deploy the funds where their money gets the love. Over the past 7 months, until last week, that was mostly US equities.

The situation with the PBoC is different. Its system is not fully integrated with the world financial system. China’s central bank serves only its domestic banks, and they in turn serve only domestic financial institutions, including the out-of-control shadow financial system. However, many of those institutions are significant players in the world markets.

US and European banks who were engulfed by bad loans and their own horrendous practices were bailed out by the Fed, ECB, and BoE. Unlike them, the major central banks are not there to bail out China’s miscreants. Apparently the PBoC has also decided, no more! It has slammed the door on them to put a stop to the wild speculative bubbles they have blown. Now that they are swamped with trillions in  bad loans these players have no place to go and no means to raise the needed cash other than to sell whatever liquid assets they can, wherever they can around the world. If not the primary impetus for last week’s selloff, this selling was at least a major contributor to it.

While the PBoC doesn’t play directly in the world liquidity sea, it has dammed a major tributary and has inserted massive reverse flow pumps into the pool. As a result, the players along that tributary have not only stopped the flow of liquidity into the world sea, but in order to replenish their own liquidity which has run dry, they are  pulling cash out of world markets that they had previously pumped in.  These institutions are largely insolvent. The reverse flows going back into China aren’t likely to turn back toward the rest of the world again anytime soon unless the PBoC relents and prints money.

PBoC Balance Sheet- Click to enlarge

PBoC Balance Sheet- (Data-Reuters) Click to enlarge

As it grew its balance sheet, the PBoC in the past provided funds to the world cash pool indirectly via its shadow financial institutions.  This year it pulled the punch bowl. It shrunk its balance sheet early in the year, then has grown it by only 1.3% since April, hardly enough to prop up massive overhangs of bad loans in both the banks and shadow financial system. Its assets remain below the peak levels reached early in the year.

The Fed and BoJ are still furiously pumping cash into the world pool, and markets were responding accordingly until the last few weeks, or at least the equities markets were.  However,  the European banks have been pulling funds out of the pool to repay loans from the ECB. Some of them who did not want the funds originally but were forced to take them, had bought Treasuries.  When the ECB opened the repayment window early this year the banks liquidated the Treasuries they had bought with the funds. Others sold other sovereign bonds they had bought. Still others who had reached for yield in emerging markets began selling those securities. The process began to snowball over the past few weeks.

Fed ECB and BoJ - Click to enlarge

Fed ECB and BoJ – Click to enlarge

The BoE has also stopped providing funds to the pool. After growing its assets by 50% from Q4 2011 to Q4 2012, it too has stopped supplying funds to the markets.

Bank of England Total Assets - Click to enlarge

Bank of England Total Assets – Click to enlarge

The Fed and BoJ are the last two major central banks still adding cash to the system. They are fighting the PBoC, BoE, and ECB. Unlike the other central banks, the ECB’s money printing involved mostly loans rather than direct asset purchases. The ECB is allowing banks to pay down loans, with the resulting liquidation pressures beginning to snowball.  As those loans are repaid they create liquidation pressures in world markets. It started with US Treasuries and has spread to other sovereigns and emerging markets, and last week it hit US stocks.

Central banks working at cross purposes have generated liquidity crosscurrents that have buffeted the markets in recent months. Those crosscurrents are likely to turn more difficult to navigate as the Fed begins to wind down QE, assuming it does what Bernanke said that it would do. But until that happens, there should still be net liquidity growth overall as the Fed and BoJ continue to pump. It depends on just how bad things become in China and just how much selling and asset price decline the PBoC is willing to tolerate. China holds massive stores of assets around the world including US Treasuries, and it’s not clear how much pain it is willing and able to bear. It’s also not clear how much difference it will make  if the PBoC does decide to print money.

As the world’s Last Ponzi Game Standing, the US is likely to see most of the benefit of whatever positive liquidity flows remain, particularly in equities where most of the recent funding has headed. The cross currents of liquidation will make the seas far more choppy and treacherous to navigate, fun for traders who strictly trade the charts both long and short, but longer term investors probably won’t be able to keep their ships afloat. Contributed by Lee Adler, of The Wall Street Examiner.

Wolf here: In theory, the Fed could continue to print money and buy Treasuries and mortgage-backed securities, even pure junk, until the bitter end. But the bitter end would be unpleasant for those that the Fed represents – and now they’re speaking up publicly. They’re worried that their system might break down. It would threaten their empires. It would be the bitter end. Read.... Controlling The Implosion Of The Biggest Bond Bubble In History

See the original article >>

China Stock Market 400-Point Flip-Flop

By: PhilStockWorld

The worst is now past.

That's the word from an HSBC economist after the PBOC's Ling Tao assures the bank will keep money-market rates "within reasonable ranges." The People’s Bank of China has provided liquidity to some financial institutions to stabilize money market rates and will use short-term liquidity operation and standing lending facility tools to ensure steady markets, according to a statement posted to its website today. It also called on commercial banks to improve their liquidity management.

The PBOC is giving the market “a pill to soothe the nerves,” Xu Gao, Everbright Securities Co.’s Beijing-based chief economist. “The message is clear: the central bank doesn’t want to see a tsunami in China’s financial markets and market rates will drop further.” That saved the Hang Seng from an additional 500-point nosedive and, in fact, they bounced back 400 points off the low at 19,426 to finish back at 19,855

As I said yesterday, it's an artificial crisis and one we felt had ran its course (see yesterday's post) and, in our Member Chat, we went more aggressively bullish off yesterday's low as we flip-flopped our bearish index positions at 10:07, pretty much catching the day's lows on the nose.

However, just because China is TRYING to stop their economic slowdown from turning into a crash doesn't mean they can successfully regain their lost momentum and now we need to turn our focus back to the myriad of problems that plague the rest of the World so we are in now way complacently bullish – merely playing for the bounce we expected to get into the end of quarter at some point this week – it just so happens that point came earlier than expected yesterday.

As you can see from our Big Chart, there's been quite a lot of technical damage done to our indices, with all of them breaking below their 50 dmas and already you can see them curling over but the 200 dmas (5-10% below the 50s) are generally rising so it would be easy to turn the 50s back up – if we can get over them by the end of the week.

If, on the other hand, we stay below them – the daily dots will pull the line that connects them lower and we all know what happens when a 50 dma is falling and a…

See the original article >>

VXTYN Measures Volatility in U.S. Treasuries and Potential Spillover Effect

by Bill Luby

Recently I have been highlighting some non-traditional measures of volatility and risk in the financial markets, including VXEEM (CBOE Emerging Markets ETF Volatility Index); DXJ (WisdomTree Japan Hedged Equity Fund); and DBV (PowerShares DB G10 Currency Harvest Fund). Part of my intent in focusing some attention on these largely under-the-radar indices and ETPs is to get more investors to think about risk more broadly across geographies and asset classes.

One asset class that should absolutely be watching closely by even those stubbornly equity-centric investors (and I know you are out there in larger numbers than you care to admit) is U.S. Treasuries. Of course U.S. Treasuries come in quite a few flavors, but the most important is probably the U.S. 10-Year Treasury Note. In a display of impeccable timing, last month the CBOE and the CFE teamed up to launch a new volatility index based on this security: CBOE/CBOT 10-year U.S. Treasury Note Volatility Index (VXTYN).

In the chart below, I show the path of VXTYN and the SPX going back to January 10, 2013, which is the beginning of the historical data for VXTYN provided by the CBOE. Note that VXTYN only began rising in May and when hit has made a substantial move up, that has preceded a decline in stocks.

[source(s): CBOE, Yahoo, VIX and More]

Just for fun, I am also including a chart that shows a 21-day rolling average of the correlation between VXTYN and the SPX. Here the relationship between the swings in correlation and subsequent moves in stocks may be easier to visualize. With less than months of historical data to draw on, I would caution against jumping to conclusions regarding correlation and causation, but at the very least I thought this graphic might provide some food for thought.

[source(s): CBOE, Yahoo, VIX and More]

Last but not least: did you know there are ETPs for placing bets on whether the Treasury yield curve will get steeper or flatter? I highlighted these products back in 2010 in Treasury Yield Curve ETNs and Volatility; they are known formally as the iPath US Treasury Steepener ETN (STPP) and the iPath US Treasury Flattener ETN (FLAT).

See the original article >>

Europe: Your Rope

Marc to Market

European finance ministers will meet tomorrow ahead of the Summit that begins Thursday afternoon in order to see if more progress can be made on the banking union. Talks broke down at the end of last week, without resolution. There are four dimensions to the issue and like a Mobius strip or an Escher drawing, it is difficult to know what comes first and what is last.

The four elements are a single supervisor, a single bank resolution authority, direct bank recapitalization from the ESM and new rules to regarding how the costs would be distributed between investors, creditors, depositors and tax payers.

There has been some, albeit limited progress, though much remains up in the air. What we can be fairly certain about is the banking union will most definitely not come into effect this year, as was initially anticipated by officials a year ago. In fact, these four components are unlikely to be in place before the end of 2014 at the earliest.

The single bank supervisor appears to have been agreed upon and that is the ECB. However, rather than supervise all banks as some initially wanted (perhaps some want this in some Machiavellian way to tie the ECB up and its resources) the ECB is likely to be responsible for around 200 of the largest banks. The ECB, however, is insisting that it has some authority to shutter insolvent institutions and that a rigorous examination of the financial condition of the institutions it will be responsible for before it accepts its new mandate.  What the ECB has in mind appears to be more than the unconvincing stress tests seen in recent years. 

Direct recapitalization of banks is an important step to break the link between the sovereign and the banks, which has produced horrible contagion throughout the  European periphery.  However, direct recapitalization from the ESM requires the single supervisor to be in place and for the magnitude of the problem to be fully understood.  Again, this seems virtually impossible this year and even another 18 months may not be sufficient. 

The issue that bedeviled the finance ministers at the end of last week were how the losses should be distributed.  The disagreement is more fundamental than the role of senior creditors and depositors.  The key dispute that reportedly pitted a German-led bloc against a French-led bloc was who should make the decision.  Germany and its allies find comfort in agreed upon rules that can be uniformly applied.  France and its allies see this at too more encroachment upon their sovereignty and want national leaders to have a wide berth to decide these issues. 

In some ways, the tension between national sovereignty and central authority (integration) continues to cut across all important issues in Europe.  This issue remains intractable and European agreements seem to end up as some compromise formation.   We have argued that one way this issue would be resolved is in strengthening the link between sovereign and solvency.    This has been the case in Greece, Ireland, Portugal, and Cyprus most acutely.  France remains the sticking point.

France had neither the fall of the Berlin Wall to force it to restructure, as Germany did , nor the capital strike, that forced the periphery to capitulate and reform.  It bonds continue to trade like (somewhat) higher yielding bunds.  Consider that here in Q2, French  10-year yields have risen a little less than Germany's (44 bp vs 48 bp). 

Without resolving this issue and the so-called "bail-in rules", the fourth component of the banking union, a single resolution entity makes little sense.The EU Summit, of course, has other issues to address, including Cyprus and Greece, but the failure to make more progress on a banking union undermines investor confidence.    German Chancellor Merkel may have hoped for a quiet period before the German national elections in late September, but the dramatic backing up of interest rates threatens to cut short the cyclical recovery that the PMI surveys suggested was unfolding, and the failure to show more progress toward a banking union threatens to renew investor angst. 

See the original article >>

Technical Analysis of the Silver Market

By EconMatters

Portfolio Rebalancing for start of 2013

Silver closed Friday`s trading session at $28.46 an ounce, capping off what has been an auspicious start to 2013. On January 23rd Silver was trading at $32 and has been in a downtrend ever since trying to find a support level that will hold. 

There is some real minor support at the $28 level, but nothing to hang your hat upon. The real 2-year support is the $26 level, where it has bounced four times from the level in the last three years.

If it breaks the $26 level, then there is pure air all the way down to $20 an ounce, which we last saw in August of 2010. The next level of support would be the $17.50 - $15.00 area which used to be upward resistance prior to 2008.

Technical Uptrend Levels

If $28 or $26 holds and silver bounces off these levels a break above $30 would be a start, but an uptrend to be confirmed needs to close above the downtrend upper channel line around $32 with conviction, which will attract new buyers in the metal.

If Silver can close above $32, then $34-$35 is in the cards. The $35 level of resistance has been tested four times during the last two years, and silver has been unable to break out above this area.

$35 Resistance Level

However, a close above the $35 level brings the $40 resistance level into play. The next upward resistance level is around the $45 an ounce area, and expect a downward rejection of this level for the first test - if historic patterns are our guide.

The final level of resistance is the $50 an ounce level which has never really been tested since the April 2011 period, needless to say, this level should also provide substantial selling pressure the first attempt at breaking through the barrier, depending upon the reasons silver is up there in the first place.

Unchartered Territory

If Silver breaks out above the $50 an ounce level, then the market is in new territory, and you want to be long until some resistance level is rejected. Whenever a market gets into unchartered territory, the rules are being made up on the fly so to speak from a technical standpoint. This is an area that shorts can really get hurt because moves can explode around these types of historical technical breakouts.

Value Trading vs. Major Trending Market

I anticipate the Silver market being used more as a value trading market like it has been basically for the last two years with buyers coming in looking to buy low and sell for a trade, and at the high end of the range, sellers coming in for a range trade, anticipating selling at the high end of the two year range, and closing out their positions at the bottom end of the trading range.

The Silver market has been unable to go on a sustained trend in either direction during the better part of two years after what I refer to as the liquidation drop in September of 2011. Ergo, it will be interesting to watch when the next definable trend will take hold in the Silver market, and the related market events that play out as the catalysts for such a move.

See the original article >>

Greenspan, Bernanke and a Return to Normalcy

by rcwhalen

"America’s present need is not heroics, but healing; not nostrums, but normalcy; not revolution, but restoration; not agitation, but adjustment; not surgery, but serenity; not the dramatic, but the dispassionate; not experiment, but equipoise; not submergence in internationality, but sustainment in triumphant nationality."

President Warren Harding

1920

One of the themes that I hit in my 2010 book, “Inflated: How Money & Debt Built the American Dream,” is that way in which the Federal Open Market Committee has used progressively lower and lower interest rates to artificially boost economic growth.  In theory the Fed is responsible for promoting full employment and price stability, but in fact the real focus of policy is the former.  

One of the troubling things about the market “correction” of last week is the way in which economists, Fed officials and members of the media persist in describing the US economy as “recovering” even though the interest rate policy remains extreme.  The chart above from FRED shows that, according to economists, the US economy has been out of recession for three years.  But with interest rates ~ 0, is this an accurate description? Whether you talk about housing, stocks or bonds, all of these prices are a function of extreme FOMC policy.

The roots of the Fed’s extreme policy actions start in the late 1980s, when former Fed Chairman Paul Volcker was replaced by Alan Greenspan.  This change in leadership at the Fed was very significant because the central bank essentially capitulated to political pressure for growth.  Think of the arrival of the nominally Republican Greenspan as the final victory of the socialist tendency in American politics that starts with FDR and the New Deal. 

Greenspan’s FOMC put on a good show for the public, but in substantive terms gave up on using interest rates to control inflation in the face of growing federal budget deficits and unfunded entitlements.  Compared with the actions taken by the Fed following WWII and in the 1970s under Volcker, policy under Greenspan from 1987 onward was entirely accommodative and with no protest regarding swelling fiscal excesses.  See “Washington & Wall Street: Volcker Challenges Bernanke on Inflation.”

My friend Roger Kubarych, who worked at the Federal Reserve Bank of New York, then on Wall Street as an economist for Henry Kaufman, and most recently at the CIA, frames the issue thusly:

"In '87, with the LDC debt crisis and the failure of the thrift industry front and center in people's minds, only a few diehards were confident that the financial system was stable, or that bankers knew what they were doing.   But there were penalties for pointing this out to Reagan confidantes like Walter Wriston, George Shultz, and Don Regan.  So Paul Volcker was replaced by Alan Greenspan.  The 90's were essentially successes for the Greenspan followers, which included 90% of the media and most of official Washington.  Even the high-tech bubble and its nasty aftermath didn't quash the notion that Greenspan was the man.  Dissents became almost a thing of the past (apart from the estimable Gary Stern and more quietly Ned Gramlich behind the scenes).  But then came the housing & financial collapse, along with Bernanke, deference to the US Treasury on a number of issues, and a splintered FOMC that leaves the financial markets with the nagging sense that we are living through a Potemkin Village of pseudo-stability.  A great many serious professionals are convinced that it is only a matter of time before the day of reckoning comes.  In short, in '87 there was knowledge that much was wrong with the financial system, but that smart guys like Volcker and (while his aura lasted) Greenspan would put things right.  That's not the case anymore."

Today whether you talk to people in the financial media or among the investment community, you almost never hear any recognition that we are living in an anomaly both in economic and financial terms.  None of our supposed leaders at the Fed, the White House or in Congress will admit this publicly.  Thus when Fed Chairman Ben Bernanke suggested that the FOMC would end the heroin drip that has been keeping the US economy growing – at least in nominal terms – the markets tanked. 

This AM on CNBC, during an interview with Jed Kolko of Trulia (~ 3:50 into the interview,) one of the hosts makes the key point:  “We got a real problem.  If we can’t sell homes for anything but a bargain basement mortgage rate, then we’ve got a problem.” 

The Fed has been using artificially low interest rates to boost economic activity for 30 years.  In some respects, the end of QE* marks the culmination of that long term trend, but it also implies that a “normal” economy will look nothing like it does today.  Thus when you hear economists talking about future home prices, growth or job creation, you must adjust these prognostications for an eventual “return to normalcy,” to recall the words of President Harding.

Unlike the period following WWI and WWII, when the US economy was like today operating under extreme government intervention, today we are living through the last painful adjustment to those conflicts and the resulting demographic distortions in the decades that followed. 

A century ago, we had leaders who understood that price stability is more important than employment and were not afraid to make tough decisions to avoid inflation, which had been a big problem during both conflicts.  Today we are led by political cowards who, in general, lack the honesty and personal integrity to tell Americans the truth about growth and inflation.  I do not put Ben Bernanke into this category because he seems to have the intelligence to understand that our current economic course is “unsustainable,” to use a very overused term. 

When Chairman Bernanke started to describe a world after QE in the press conference following the latest the FOMC meeting, investors fled.  David Kotok, Chairman and CIO of Cumberland Advisors, puts the situation succinctly in a comment written over the weekend during our fishing trip to Maine:

"The takeaway from the group and others gathering here at Leen’s Lodge is pretty clear. Housing, finance, mortgaging, and the recovery in the US will see a setback. How severe that setback will be remains to be seen. The range of outcomes may span several hundred thousand single-family housing starts a year. The news is not good. The economy is likely to slow because of the slowdown in the housing recovery. The policy options available to the Fed are likely to become more difficult.  What is the Fed going to do if housing slows and we get well under two-percent GDP growth rates because of that? What happens to the incipient recovery in terms of consumer discretion? What happens to job creation in the housing sector, which offers higher-paying jobs? Is the Fed about to repeat its 1937 mistake of too-quick tightening? In 1937 the Fed did not have to deal with the balance sheet side and escrow reserve deposit rates. Policy was made differently then. However, the ramifications of imposing a serious shock on a recovering economy may be quite similar.”

There is no greater crime in Washington today than speaking truth about the US economy in public.  This is why Ben Bernanke is not being reappointed for another term as Fed Chairman.  Bernanke did what was required following the 2009 credit implosion, but now he is showing signs of doing the right thing when it comes to inflation. 

My guess is that President Obama probably will select his childhood friend and former Treasury Secretary Tim Geithner as the next Fed Chairman, this in an effort to keep the great pretense about "economic growth" going a little while longer.  Geithner by his own admission knows nothing about economics or finance, but he certainly understands politics.  Politics rather than any flavor of economics is driving Fed policy today. 

See the original article >>

China’s “Lehman” Moment Could Bring About Another 2008

by Graham Summers

The global Central Banks are in damage control mode.

The big story here is China, which is fast approaching its “Lehman” moment with interbank liquidity drying up rapidly and overnight rates are soaring.

As I’ve warned Private Wealth Advisory subscribers before, China’s shadow banking system equal to over $18 trillion (more than 200% of China’s GDP), so this could be the mother of all bubbles bursting.

Indeed, China’s stock market has now fallen 20% and is in a free fall.

The Central Bank of China spoke yesterday to assure the market that there was ample “liquidity” in the system. But the market isn’t buying it. Smart investors shouldn’t either.

In the US, two Fed Presidents (Fisher and Kocherlakota) engaged in verbal intervention yesterday, trying to convince investors that the market misinterpreted Ben Bernanke last week when he said the Fed could taper QE by late 2013 or the middle of 2014.

There isn’t much to interpret here. The Fed has failed miserably to generate economic growth of any significance. All it’s done is create a stock market bubble while draining high quality collateral from the system. Put another way, it’s created a situation in which leverage is even worse today than it was before 2008.

Bernanke knows this and is desperately trying to let the bubble down easily without it bursting. This is impossible. And as the bond and stock market action of the last week shows us, the very second the Fed backs off the system is at risk.

This is just the start. I warned Private Wealth Advisory subscribers in our most recent issue that higher rates were coming noting a collapse in bonds in Europe and the emerging market space.

This could easily become truly catastrophic. The world is in a massive debt bubble and the Central banks are now officially losing control. The stage is now set for a collapse that could make 2008 look like a joke.

See the original article >>

China Stock Market Crashes, SPX Gaps Down

By: Anthony_Cherniawski

China Crashing: Shanghai Composite Tumbles Most Since 2009

Those who have been holding their breath until China joins the overnight market fireworks can finally exhale.

Following yesterday's unprecedented formal announcement of epic capital misallocation, the PBOC tried to continue the damage control when a few hours ago it announced that Chinese banking system liquidity "is at a reasonable level", but that banks must control liquidity risks from fast capital expansion, especially credit expansion, according to a statement on management of banks’ liquidity on website. The implication: no easing any time soon, and sure enough no repo or reverse repo activity was logged in the overnight session meaning Chinese banks, for the time being, continue to be on their own, without any hope of the central bank stepping in to bail them out.

US Traders Walk In To Another Bloodbath

Lots of sellside squeals this morning following the epic bloodbath in China, where in addition to what we already covered hours ago, has seen at least five companies (China Development Bank, Shanghai ShenTong Metro, China Three Gorges Corp., Doosan Infracore China Co. and Chongqing Shipping Construction Development) delay or cancel bond offerings as the PBOC's admission of capital "misallocation" is slowly but surely freezing both bond and stock markets. And while the plunge was contained first to China, then to Asia, then to Europe (where the Spanish 10 Year once again surpassed 5% as expected following the carry trade unwind), with the arrival of bleary-eyed US traders the contagion is finally coming home.

It gets worse…

From Caijing, google translated. We hope the gist of the narrative in Mandarin is far less scary, because if the translation is even remotely accurate, then all hell may be about to break loose in China.

From Caijing: Bank of China, Bank of suspension of transfers morning counters were unable to apply for online banking

Update: Customer service said, now silver futures transfer service has been fully suspended, online banking, the counter can not be handled, and now has the background system response, recovery time is not yet known

…and the SPX gaps down.

See the original article >>

Stunning Chart Shows Gold and Silver Defy Bulls' Optimism

By: EWI

Gold and silver have been all over the financial news.

On Thursday, June 20, silver fell below $20 (-60% from 2011 high), and gold fell below $1300 (-30% from 2011 high).

We first published the chart below after metals plunged in mid-April. It shows EWI's forecasts not only leading up to those big moves ... but during the past three years of opportunity.

Three years of volatile price action in these two markets is plain to see. And the forecasts speak for themselves.

Overwhelmingly, most metals experts favored the other side of the gold and silver trend for the past three years - and they still do today. Meanwhile, EWI subscribers were prepared ahead of time for nearly every important turn.

Now, some periods are more vexing than others. But currently we are in a period where the wave patterns are particularly clear.

Metals prices may bounce higher near-term - like we warned they would do after the April 16-18 lows - but the quotes on the chart clearly show how countertrends are the source of opportunity. And that is the great strength of pattern analysis via the Elliott wave method, along with tools like sentiment, momentum and price.

See the original article >>

Is Gold Price Trying to Tell Us Another 2008 Crisis is Lurking in the Shadows?

By: Michael_J_Kosares

This monthly gold chart is drawn on the logarithmic scale in order to remove some of the melodrama to the latest correction. Linear charts emphasize nominal price movement while a log chart emphasizes the percentage movement. By reviewing gold’s latest correction on a percentage basis, we can put things into a little bit better perspective. The 2008 correction was 26%; the current correct thus far has been 30%. In short, we’ve been here before though you wouldn’t know it from all the catterwauling at our favorite financial cable network and other media outlets (not to mention Wall Street itself). Granted we might not, as yet, have reached bottom, but then again, we could be close.

In preparing this chart, I couldn’t help but look for similarities between 2008 and the present. Although nothing has surfaced that should make us think another Lehman Brothers event might be in progress, it is difficult not to wonder if Marc Faber might be on to something

Why, for instance, has the Fed stepped up its asset purchase program since the beginning of the year while simultaneously talking asset purchases down? We see the numbers but we don’t know exactly what is prompting the strange behavior.

This from Chris Martenson (Peak Prosperity) might end up being viewed months from now as early warning to a pending crisis:

“The early stage of any liquidity crisis is a mad dash for cash, especially by all of the leveraged speculators. Anything that can be sold is sold. As I scan the various markets, all I can find is selling. Stocks, commodities, and equities are all being shed at a rapid pace, and that’s the first clue that we are not experiencing sector rotation or other artful portfolio-dodging designed to move out of one asset class into another (say, from equities into bonds). . .

“[W]e look at the increasing number of flashing indicators warning that a 2008-style - but worse - sell-off is arriving. We say ‘worse’ because this time it looks like it will be accompanied by a vicious cycle of rising interest rates. Plus, governments and central banks have used up all of their major options already. There are no more white knights to hope for.”

Marc Faber: Gold a possible canary in the deflation coal mine

“’Maybe gold is signaling a deflationary collapse of all asset prices. If this were indeed the case I suppose I would rather own gold than government bonds, high yield bonds and equities. If this scenario were to pass it would lead to even more money printing around the world,’ says Faber, who was talking about asset price deflation and gold back in March.”

Also:

“Credit Suisse, meanwhile, said gold investors maybe should be ratcheting down their expectations, or at least taking a harder look at them. Gold could get back to levels seen before the crisis, around $1,100 or $1,500 an ounce, Tom Kendall, head of precious markets research told CNBC. That’s because many of the so-called fear factors driving gold higher - such as inflation - have been removed from markets.”

MK note: For a good many years now, I have shied away from getting trapped in the debate about extreme economic outcomes, i.e., hyperinflation and hyperdeflation - though Faber is talking about asset deflation, a far different animal than monetary deflation. The problem with Kendall’s analysis is that it is built on a false premise. Gold was never driven higher by inflationary fears during the course of this bull market. From 2002 on, the real main driver has been the safety of the banks and financial markets along with a possible collapse of the international monetary order. People like Kendall are usually surprised by the huge surges in demand as the gold price falls simply because they fail to understand the real reason for the demand in the first place.

Along these lines, we have experienced another demand surge at our offices since mid-last week. Many clients have cited concerns about the stock and bond markets as the reason for their renewed interest in gold, a crossover sentiment that bolsters Faber’s argument. Press reports out of Asia tell a similar story. Faber is much closer to the truth than Kendall because he understands why people buy gold in the first place. Gold as “the last man standing” remains one of the strongest arguments in its favor - the asset of last resort and for the final reckoning.

See the original article >>

"Time Is Running Out Fast" For Italy

by Tyler Durden

Everyone knows Europe is insolvent; the only question is "when" will Europe be forced to finally admit this truism. The long overdue house of cards may start toppling in as little as 6 months, as The Telegraph reports, Mediobanca's 'index of solvency risk' suggests "time is running out fast" for Italy. With the breakdown in Eurozone talks on a banking union and the Fed's shift in policy, Europe "has become a dangerous place," warns RBS. Unless Italy can count on low borrowing costs and a broad recovery, it will "inevitably end up in an EU bailout." The current situation is as bad as when the country was blown out of the ERM in 1992 as "the Italian macro situation has not improved...rather the contrary; with 160 large corporates in Italy now in special crisis administration." If the ECB doesn’t act, one analyst warns (pleads) it could see all the gains of the past nine months vanish in two weeks. Mediobanca said the trigger for a blow-up in Italy could be a bail-out crisis for Slovenia or an ugly turn of events in Argentina, which has close links to Italian business. "Argentina in particular worries us, as a new default seems likely."

Via The Telegraph,

“Time is running out fast,” said Mediobanca’s top analyst, Antonio Guglielmi, in a confidential client note. “The Italian macro situation has not improved over the last quarter, rather the contrary. Some 160 large corporates in Italy are now in special crisis administration.”

The report warned that Italy will “inevitably end up in an EU bail-out request” over the next six months, unless it can count on low borrowing costs and a broader recovery.

Emphasising the gravity of the situation, it compared the crisis with when the country was blown out of the Exchange Rate Mechanism in 1992 despite drastic austerity measures.

...

“The European Central Bank needs to take very aggressive steps to offset this,” said Marchel Alexandrovich from Jefferies Fixed Income. “We have a sell-off across the board. If the ECB doesn’t act, it could see all the gains of the past nine months vanish in two weeks, taking the eurozone back to square one.”

...

“We have clear signs in global finance of a generalised meltdown in assets right now.”

...

Mediobanca said the trigger for a blow-up in Italy could be a bail-out crisis for Slovenia or an ugly turn of events in Argentina, which has close links to Italian business. “Argentina in particular worries us, as a new default seems likely.”

Mr Guglielmi said Italy’s industrial output has slumped 25pc from its peak in the past decade, while disposable income has dropped 9pc and house sales have dropped to 1985 levels.

The 1992 crisis was defused by a large devaluation, allowing Italy to restore trade competitiveness at a stroke. Mediobanca said: “The euro straitjacket is clearly not providing a similar currency flexibility today. With the lira devaluation Italy managed to inflate debt away, which it cannot do today. It could take more than 10 years to revert to pre-crisis output levels.

See the original article >>

S&P 500 Sell-off Could Turn Ugly

By Sasha Cekerevac

While Fed Chairman Ben Bernanke’s announcement that a reduction in the asset purchase program will begin later this year was not a surprise to me, stocks felt the impact as selling ensued across the board.

However, though the S&P 500 did pull back, it is still near its all-time highs. Over the past few weeks, I have been recommending that readers reduce their overall exposure to the S&P 500, and any other assets that have benefited from the stimulus program for that very reason.

In addition to beginning the reduction of asset purchases, the Federal Reserve chairman stated that he expects to end any asset purchases by next year, and to begin raising the Fed funds rate in early 2015, as opposed to previous Federal Reserve statements that indicated that the Fed funds rate would begin to rise in late 2015.

While Bernanke was careful to note that this did not mean that monetary policy would begin tightening immediately, it is clear that the next move will be toward a reduction in monetary stimulus.

This will certainly impact the stock market and any other asset class that has benefited from easy monetary policy. Many investors in the S&P 500 have been blindly buying, not basing their buys on fundamentals, but rather, assuming the Federal Reserve will continue monetary stimulus indefinitely.

As I stated many times before, the current monetary policy program by the Federal Reserve is only temporary.

The chart for the S&P 500 Index is featured below:

S&P 500 Large Cap Chart

Chart courtesy of www.StockCharts.com

As I previously mentioned, the sell-off in the S&P 500 is only minor in relation to the magnitude of the movement that’s been going on since November. Having said that, when the Federal Reserve begins reducing its asset purchase program later this year—I suspect it will be either in September or October—this will coincide, in my opinion, with a much larger sell-off for the S&P 500.

History is also on the side of caution for the S&P 500 during the months of September and October. Those two months are notorious for having poor performance records, including several famous crashes.

For the S&P 500, the Fibonacci retracement levels show approximate regions that investors can use as a roadmap for possible areas to target.

Naturally, we will have to digest much more economic data before the Federal Reserve makes any such move. Because the S&P 500 has discounted much of the revenue growth over the next year, at current levels, I think it’s priced close to perfection, leaving significant downside risk.

With the summer upon us and the Federal Reserve close to making a significant shift in monetary policy this fall, I would look to raise cash that one can deploy to buy stocks once the S&P 500 drops to levels that are attractive once again.

For long-term investors, the time to accumulate the S&P 500 is when the market sells off significantly—not when it’s at all-time highs.

See the original article >>

Orange juice lower as better weather seen in Florida

By Jack Scoville

General Comments:  Futures closed lower to start the week.  Better weather in Florida seems to be the big problem for the bulls at this time.  Futures have been working generally lower as showers have been seen and conditions are said to have improved in almost the entire state.  Ideas are that the better precipitation will help trees fight the greening disease.  No tropical storms are in view to cause any potential damage.  Greening disease and what it might mean to production prospects continues to be a primary support item and will be for several years.  Temperatures are warm in the state, but there are showers reported somewhere in the state every day now.  The Valencia harvest is continuing but is almost over.  Brazil is seeing near to above normal temperatures and mostly dry weather, but showers are possible next week.

Overnight News:  Florida weather forecasts call for showers.  Temperatures will average near to above normal.  Nielsen said that domestic retail sales of orange juice were 39.89 million gallons, down 4.2% from the previous four week period.  

Chart Trends:  Trends in FCOJ are down with objectives of 137.00, 133.00, and 130.00 July.  Support is at 139.00, 137.50, and 136.00 July, with resistance at 145.00, 146.50, and 150.00 July.

COTTON

General Comments:  Futures were lower again on what appeared to be long liquidation from speculators and perhaps some farm selling.  Ideas of better production conditions in the US and disappointing economic news from China late last week caused the selling interest to develop once again.  Ideas of better weather in US production.  After the close, USDA showed that conditions in some areas got better while conditions in other areas got worse.  The reports last night could help support prices today.  Texas is reporting dry weather again.  Dry weather is being reported in the Delta and southeast as well.  The weather should help support crop development in the Delta and Southeast, and could help in Texas as some areas of the state saw good rains last week.  Weather for Cotton appears good in India, Pakistan, and China.

Overnight News:  The Delta and Southeast will see some light showers this week.  Temperatures will average above normal.  Texas will get dry weather.  Temperatures will average above normal.  The USDA spot price is now 79.48 ct/lb.  ICE said that certified Cotton stocks are now 0.576 million bales, from 0.574 million yesterday.  ICE said that 1,030 notices were posted today and that total deliveries are now 1,146 contracts.

Chart Trends:  Trends in Cotton are down with no objectives.  Support is at 82.80, 81.80, and 81.20 October, with resistance of 84.60, 85.20, and 86.00 October.

COFFEE

General Comments: Futures were higher again in recovery trading.  Trends in all three markets are down after the price action late last week.  However, futures also got to or close to the final down side objectives for the down trend, so it is possible that the market can rally this week.  Arabica cash markets remain quiet right now and Robusta selling interest has become less, as well.  Most sellers, including Brazil, are quiet and are waiting for futures to move higher.  Buyers are interested on cheap differentials, and might start to force the issue if prices hold and start to move higher in the short term.  Brazil weather is forecast to show dry conditions, but no cold weather.  There are some forecasts for cold weather to develop in Brazil early next week, but so far the market is not concerned.  Current crop development is still good this year in Brazil.  Central America crops are seeing good rains now.  Colombia is reported to have good conditions.

Overnight News:  Certified stocks are lower today and are about 2.748 million bags.  The ICO composite price is now 114.84 ct/lb.  Brazil should get dry weather except for some showers in the southwest.  All areas could get showers early next week.  Temperatures will average near to above normal.  Colombia should get scattered showers, and Central America and Mexico should get showers, with some big rains possible in central and southern Mexico and northern Central America.  Temperatures should average near to above normal.  ICE said that 36 delivery notices was posted against July today and that total deliveries for the month are now 723 contracts.

Chart Trends:  Trends in New York are down with no objectives.  Support is at 116.00, 113.00, and 110.00 September, and resistance is at 122.00, 123.50, and 125.00 September.  Trends in London are mixed to down with objectives of 1670 and 1580 September.  Support is at 1720, 1705, and 1680 September, and resistance is at 1765, 1775, and 1800 September.  Trends in Sao Paulo are down with no objectives.  Support is at 140.00, 137.00, and 134.00 September, and resistance is at 148.00, 151.00, and 155.00 September.

SUGAR         

General Comments:  Futures closed higher on follow through buying.  Some in the Sugar market are talking more and more about a low forming in this area.  Ideas are that Sugar prices are cheap enough that many refiners are now making ethanol and not Sugar.  The Indian monsoon is off to a good start and this should help with Sugarcane production in the country.  But, everyone is more interested in Brazil and what the Sugar market is doing there.  Traders remain bearish on ideas of big supplies, especially from Brazil.  Traders in Brazil expect big production as the weather is good.  Demand is said to be strong from North Africa and the Middle East.  Sugar refiners in Brazil are concentrating on producing Ethanol and not Sugar, so down side overall might not be that extreme and any moves lower this week might be chances to buy for at least a short term move. 

Overnight News: Showers are expected in Brazil, mostly in the south and southwest.  Temperatures should average near to above normal.

Chart Trends: Trends in New York are mixed.  Support is at 1700, 1665, and 1650 October, and resistance is at 1720, 1730, and 1740 October.  Trends in London are mixed.  Support is at 478.00, 470.00, and 466.00 October, and resistance is at 491.00, 494.00, and 499.00 October.

COCOA        

General Comments:  Futures closed slightly lower in consolidation trading.  There was not a lot of news for the market, and price action reflected this.  Ideas of weak demand after the recent big rally kept some selling interest around.  The weather is good in West Africa, with more moderate temperatures and some rains.  It is hotter and drier again in Ivory Coast this week, but the rest of the region is in good condition.  The mid-crop harvest is about over, and less than expected production along with smaller beans is reported.  Malaysia and Indonesia crops appear to be in good condition and weather is called favorable.

Overnight News:  Scattered showers are expected in West Africa.  Temperatures will average near to above normal.  Malaysia and Indonesia should see episodes of isolated showers.  Temperatures should average near normal.  Brazil will get mostly dry conditions and warm temperatures.  ICE certified stocks are higher today at 5.052 million bags.  ICE said that 8 delivery notices were posted today and that total deliveries for the month are 128 contracts.

Chart Trends:  Trends in New York are down with no objectives.  Support is at 2140, 2105, and 2080 September, with resistance at 2200, 2230, and 2250 September.  Trends in London are down with objectives of 1380 and 1270 September.  Support is at 1420, 1360, and 1320 September, with resistance at 1450, 1470, and 1490 September.

See the original article >>

Global central bankers say tighter policy is a long way off

See the original article >>

Global central bankers led by Federal Reserve officials said they are still a long way off from tightening monetary policy, seeking to calm investors unnerved by the Fed’s push toward curtailing bond-buying.

The comments, along with efforts by the People’s Bank of China to allay concern over a cash crunch, helped halt a slide in stocks after the Fed’s June 19 decision to outline a timetable for tapering quantitative easing. Bank of England Governor Mervyn King and European Central Bank Executive Board member Benoit Coeure today echoed Fed counterparts in saying policy will stay loose to safeguard economic expansion.

“Clearly the level of interest rates and the scale of asset purchases will have to be unwound and we must return to more normal conditions at some point,” King told lawmakers in London. “That point is not today.”

Also speaking in London, Coeure said euro-region economic growth will probably remain “weak” this year and there should be “no doubts that our ‘exit’ is distant.” In a speech in Berlin, ECB President Mario Draghi said the euro-area economy’s condition “still warrants an accommodative stance.”

The Europeans’ comments come a day after two regional Fed presidents emphasized that U.S. policy remains accommodative. Chairman Ben S. Bernanke last week said the Fed may start slowing the pace of bond buying later this year and end it entirely around mid-2014 if the economy gets on a path of sustainable growth. The Standard & Poor’s 500 Index fell 1.2% yesterday.

“The bottom line is that they’re driving home the point that there’s no exit yet,” said Marc Chandler, chief currency strategist at Brown Brothers Harriman & Co. in New York. “Many economies can ill-afford higher interest rates.”

China Crunch

China’s central bank said today it will keep money-market rates at a “reasonable” level amid a cash squeeze which last week sent the nation’s overnight repurchase rate to a record.

The People’s Bank of China has provided liquidity to some financial institutions to stabilize money market rates and will use short-term liquidity operations and standing lending facility tools to ensure steady markets, according to a statement today. It also called on commercial banks to improve their liquidity management.

U.S. stocks rose, with the S&P 500 advancing 0.6%. In Europe, the Stoxx Europe 600 Index increased 1.4%. Stocks were also boosted by U.S. consumer confidence and new- home sales data that exceeded economists’ forecasts.

King Defense

Richard Fisher, president of the Federal Reserve Bank of Dallas and a critic of the Fed’s easing policies, said yesterday that officials are talking about a “dialing back,” not an exit. Minneapolis Fed President Narayana Kocherlakota, who has called for easier policy, said the Fed must emphasize in its statement that policy will remain accommodative “for a considerable time” after the end of quantitative easing.

Their comments highlight the challenges the Fed confronts while seeking to lay out a strategy for curtailing the asset purchases that have pushed its balance sheet to a record $3.47 trillion. Neither Fisher nor Kocherlakota votes on policy this year, though they will vote in 2014.

Bernanke last week emphasized that decisions to alter the pace of asset purchases depend on the economy’s performance, and that the Fed has “no deterministic or fixed plan” to end them.

Bernanke Defended

Fisher yesterday backed Bernanke’s message, saying he favors tapering the purchases if the economy makes the kind of progress officials forecast. King also defended the Fed chief, saying markets overreacted to his comments.

“Even in the U.S., what you’ve seen there is that they’re still providing more stimulus,” King said. “The rate at which they’re providing more stimulus may be about to suddenly taper, but they’re still providing more stimulus.”

King, who has been defeated in a push for more QE since February, also said that while recent data show that a U.K. recovery “is in sight,” it’s “too weak to be satisfactory.”

“We saw the developments in the last week or so in China,” King said. “These are really quite significant developments. The euro area still remains a tremendous problem. Until we know how these problems will work out, it seems impossible for us to judge the speed and the timing by which we may eventually get back to a more normal state.”

BOE policy maker Martin Weale agreed with King on the outlook for policy, saying the “process of unwinding quantitative easing is some way in the future.”

King’s cautious outlook came as he made his last appearance at the U.K. Parliament’s Treasury Select Committee before he retires at the end of the month. He will be replaced by Mark Carney on July 1.

Negative Rates

Separately, the TSC published a paper by the BOE on negative interest rates, which it requested after the Monetary Policy Committee discussed the possibility of further rate cuts earlier this year.

In the paper, the BOE said while a negative rate remains an option, QE and credit-boosting programs are “more reliable tools for stimulating aggregate demand.” The benchmark interest rate has been at a record-low 0.5% since March 2009, while the BOE has bought 375 billion pounds ($579 billion) of government bonds since then.

It added that a cut in its benchmark rate remains an option that the MPC “will keep under review lest circumstances change in the future.”

See the original article >>

What’s an investor to do in markets like these?

By Frank Holmes

Legendary businessman Steve Forbes once said, “Everyone is a disciplined, long-term investor until the market goes down.” It’s challenging to have the fortitude to hold on to investments during a one-day carnage event like last Thursday. Everywhere you looked there was red on the screen, as U.S. stocks lost 2.5%, commodity equities lost 3% and gold declined 5%. Gold stocks took one of the biggest blows, falling about 7.5%.

So what should an investor do after a day like Thursday? Stay calm and invest on, as I believe there is opportunity in picking up what the bears left behind. Here are a few ideas to ponder.

Gold

Gold fell below $1,300 on Thursday, and based on our oscillator data, the yellow metal is now in extremely oversold territory. On an annual basis, bullion is down 2.6 standard deviations, which is the worst reading over the past 10 years.

This is the opposite reading that gold buyers had in the summer of 2011, when it was up two standard deviations, or at the $1,900 level.

Last week, before this market event occurred, I said that gold could fall another 10%, but that there could be a 30% upside over the next 18 months. You can see the upside potential in the chart, as gold appears due for a reversal toward the mean.

However, short-term financial gold traders may be discouraged from acting on this bullish sign, as the yellow metal is now even more expensive to trade. After last Thursday’s huge sell-off, the CME Group, the largest operator of futures exchanges in the U.S., decided to raise margin requirements on gold. As of the close of trading on June 21, the minimum cash deposit for gold futures will increase 25% to $8,800 per 100-ounce contract.

This is the second increase in only three months. In April, the CME raised the initial gold margin requirement, which is what triggered the short-term liquidation out of financial gold ETFs and futures.

This isn’t a typical move for the CME. Usually, the firm raises margins when prices are rising rapidly to cool down speculation or lowers margin requirements in an attempt to boost liquidity.

In contrast, cash buying of gold is increasing, and this is good news for two reasons: 1) Retail gold investors are not leveraged like futures gold trader, and 2) their buying tends to be stickier.

As we have always suggested, it is prudent to have a 5% to 10% exposure and to view gold as a long-term investment. It’s important to rebalance annually or when the oscillator shows that gold has moved two standard deviations.

Weakness in ETFs Highlights Strength in Mutual Funds

Buyers of ETFs beware, as last Thursday’s selling exposed a fundamental weakness in the structure of the exchange traded fund. Unlike a mutual fund, which allows the investor to buy or sell at the daily net asset value, ETFs can trade at a premium or discount to their net asset value (NAV). At any point in time, an investor can overpay for an asset (i.e. premium) or receive less than the asset is worth (i.e. discount).

These premiums and discounts can be tremendous on days with big NAV changes, as investors realized Thursday. The chart below shows the NAV trading premiums and discounts for the MSCI Emerging Markets Index ETF (EEM) over the past year. As you can see, the ETF often experienced significant premiums and discounts in this time frame; however, the discount was never as severe as it was last Thursday. As panic selling set in last week, the discount grew to be as much as 2.56%. Simply stated, “at the very moment of maximum selling, the ETF exacts the maximum trading cost from the seller (and rewards the buyer similarly, with a discount),” says Brendan Conway from Barron’s.

He explained the difference in the pricing of the MSCI Emerging Markets Index compared to the underlying ETF. Using data from Morningstar, he writes:

“iShares fund enters Friday’s trading session with a closing Thursday market price of $36.88. But the NAV is $37.85. It’s about a full dollar higher. View it in total-return percentage terms: EEM’s market price was down by 16.4% as of Thursday’s close. But the NAV had only lost 13.2%.”

Conway’s contrarian lesson for ETF investors: “Don’t sell into a panic. ETFs are built to penalize lemmings and reward contrarians.”

When it comes to investing, I believe there is no such thing as a free lunch. ETFs have relatively low expense ratios compared with actively managed funds in the same sectors, but that doesn’t mean that in the end an ETF costs less to own or that an ETF generates better returns. On volatile days such as last week on Thursday, ETFs can be expensive to trade.

Case Study on a Chemicals Company

Instead of seeking the short-term trade, we prefer to actively look for solid companies that we believe will outperform over a longer period of time. One such promising opportunity currently held in the All American Equity (GBTFX) and Global Resources Funds (PSPFX) is materials company, LyondellBasell (LYB).

Lyondell is one of the world’s largest plastics, chemicals and fuels companies, pays a dividend and just announced that it intends to repurchase up to 10% of its outstanding shares over a 12-month period. A “combination of organic cash generation and financial flexibility” could be potentially profitable for its shareholders, as over the next two years, returning “cash to holders of more than 30% of Lyondell’s equity market capitalization,” says Bank of America Merrill Lynch (BofA-ML).

The company is poised to benefit from a recent trend that’s been developing in the chemicals sector. In a recent report, BofA-ML reported that ethane will likely be oversupplied for the next three years. This is causing ethane to “trade near ‘floor’ prices as determined by the value of natural gas over this period.” With natural gas currently sitting below $4 per million British Thermal unit (MMBtu), ethane will likely average less than $0.30 per gallon.

Ethane is the raw material that’s used in the petrochemical industry, and cheap ethane translates to significantly increased profit margins for U.S. chemical companies, including LyondellBasell.

You can see in the chart below that U.S. chemical companies have much higher profit margins compared to their global peers, with profit margins around $0.50 per pound. This compares favorably to the chemical companies in Europe and Northeast Asia, which have current margins at $0.20 and $0.05 per pound, respectively. These companies use what’s called polyethylene naphtha, which is polyethylene made from the raw material, naphtha. Naphtha is oil-based, and because oil is much more expensive to natural gas, ethane is a cheaper feedstock.

This is just one example of opportunities you can find in today’s market if you keep calm and carry on.

See the original article >>

Revisiting the Muni Market

by Greg Harmon

Back in late March I thought the Muni market was setting up for a pullback in Muni’s Have Had It….This Time For Real. It took its time to correct but did touch the 104.30 target, on the way to Monday’s low at 100.28. Quite a bit further than the expectation. With a more than parabolic fall, a Baumgartner fall, it is looking like the time to buy the bloody crash. Here are 6 reasons why in the daily chart. The Relative Strength Index (RSI) is under 13. It has been this low only 1 time before, just before the start of the run higher in December 2010. The Moving Average Convergence Divergence indicator (MACD) is at

mub

historic lows. Both of these may go lower but I have an idea for that. Next The price is more than 10% from its 50 day Simple Moving Average (SMA). It is also far outside of the lower Bollinger band. The volume is also spiking. Finally the Spinning Top candle shows indecision, often a reversal signal. If you need more convincing the RSI on the weekly chart is also in the teens and at all time lows as the price sits on the 200 week SMA with the MACD at extremes as well. You may notice that the previous low in the RSI did not mark the bottom but was very close. If this is a concern then you can start your position by selling the July 99 Puts for the first 1/3 of your position. These were offered at about $2.05 when I traded them at 2:00pm Monday.

mub w

See the original article >>

Shape of the yield curve adjustment impacted by bond buying pattern

by SoberLook

Here is how the treasury curve shifted over the past two months (through today).

The obvious question is why has the sell-off been most acute in the 7-10yr range (the 7-year yield has increased by 90bp)? And why have the bonds in the 20-year range been a bit more stable. The answer has to do with the Fed's buying patterns.

Source: NY Fed

Maturities where the Fed has been most active are the ones which are more vulnerable to this correction. Those are the bonds whose prices the Fed has been supporting (aside from treasury bills that are now used as safe-haven). As the support diminishes, the bond pricing adjusts to post-QE levels. (Note that the bucketing used by the Fed doesn't match the bond maturities in the first chart precisely and the pattern is obviously not exact - yet the relationship is still visible). This tells us that a great deal of the fixed income pricing to date has been determined by the monetary expansion rather than the fundamentals of the markets.

See the original article >>

Financialization = Inequality

by Charles Hugh Smith

Financialization is the disease eating away the heart of the economy and what's left of democracy.


There are a number of factors behind the widening canyon of economic inequality, but the primary driver is financialization. Financialization has given those with capital and access to financier expertise ways to skim great wealth from the system without creating any value whatsoever.

Those with a home that is owned free and clear and $500,000+ in a 401K or retirement account have more capital than the vast majority of Americans, but members of the upper-middle class have no access to the leverage and tools of financialization.

In other words, financialization isn't a consequence of having capital: it's the consequence of having access to unlimited credit, leverage and low-risk, low-tax skimming operations (for example, tax codes enable hedge funds to declare income as low-tax long-term capital gains).

From the financier point of view, the upper-middle class tax donkeys who keep all their investment capital in mutual funds are the marks who supply liquidity to the system. The wealthy who park money in hedge funds are marks of a higher order, as their cash enables fund managers to gamble with other people's money and then return a thin slice of the gains (if any, after fees) back to the investors.

A carry trade is a classic skimming operation. The term is based on the difference between the costs of holding (carrying) one position and the gains earned by investing the proceeds elsewhere.

A typical example has been borrowing money for near-zero interest in Japan (yen) and using the proceeds to buy higher yielding Treasury bonds in the U.S. Here is Dan Norcini's description:

To define this term, "carry trade", for those who are a bit newer to the markets, it consists of borrowing large amounts of Yen for extremely low costs due to the miniscule short term interest rate in that nation, and taking those proceeds, exchanging it into different currencies and then using that money to make investments elsewhere where higher yields may be obtained. If that is not risky enough, most of these hedge funds then leverage their speculative bets in the hopes of compounding their gains.

There is a risk to currency carry trades: if the currency you borrow appreciates, then the trade blows up as the exchange rate loss exceeds your interest rate gain. The yen carry trade expanded to an estimated $1 trillion because the dollar/yen exchange rates were relatively stable.

The sweetest carry trades occur when two currencies are officially pegged but there is a big difference in interest rates between the two currencies. The lack of volatility in the exchange rate lowers the risk of this trade to near-zero--until the peg blows up.

You Don’t Really Understand the Carry Trade, Do You? (Yahoo Finance)

Would you like to leverage a carry trade 10 to 1? Hmm, who will loan you $1,000,000 based on $100,000 collateral? That's a key feature of financialization: the real power--leverage and access to global markets--is not available to you. The skimming operations are only open to the financier class.

Leveraging phantom collateral is another feature of financialization. Commoners were allowed a taste of this when subprime lenders were offering no-document, no-down payment mortgages back in 2004-2007. Phantom income was posted as collateral for the nothing-but-leverage loan.

The same sort of trade appears to be occurring in China, where a warehouse of copper is pledged as collateral for a legitimate bank loan at a rate of 4.5%. The proceeds are then loaned out at 10% (or higher) in the shadow banking sector of informal, unregulated credit.

What's to keep several people from pledging the same warehouse of copper? Nothing.

The carry trade blows up when the shadow-banking borrower defaults. Globally, the shadow banking system has ballooned to almost unimaginable proportions as financiers have sought out skimming operations:


Leverage and high-finance skim operations do not require much capital. It takes essentially no capital to originate a derivative; just craft the thing to protect your interests and sell it to some money manager as a valuable hedge.

If you have the right position and tools, it doesn't even require collateral to access gargantuan trading lines of credit.

The point is financialization is about leverage and skimming the existing system for immense profits. It's not about hedging legitimate industries' risks or investing in productive enterprises; it's all about skimming wealth while providing no value to the real economy or society.

The hidden toxin in financialization is the resulting concentration of wealth can buy concentrations of political power. Financialization is thus self-perpetuating: once the skimming operations generate billions of dollars in profit, it only takes a relatively small piece of these profits to buy/influence the political class. Once the politicos are in your pocket, the regulators and judiciary fall into line or are marginalized by new statutes or gutted budgets.

When Congress dared to question hedge funds' primary tax break (declaring income as long-term capital gains), the industry went apoplectic and declared capitalism, Mom and apple pie were all at grave risk if their skimming operations were taxed at the same rate you and I pay on our income.

Financialization is the disease eating away the heart of the economy and what's left of democracy.

See the original article >>

Good explanation for tight interbank liquidity conditions in China - finally

by SoberLook

Someone sent us a quote from JPMorgan that finally explains the origins of the tight interbank liquidity conditions in China. It's roughly what analysts have been suggesting.

JPMorgan: - ... there is an additional reason for the tight liquidity, in the form of a crackdown on illegal bond trading by regulators. In recent years, wealth management products (WMP) have become an important channel for Chinese banks to attract deposits. Most wealth management products are short-maturity (65% are below 3 months, and 20% range from 3-6 months). The maturity dates of such products are usually at the quarter-end, to meet regulatory requirements on loan-to-deposit ratios. Due to competition in providing high returns for WMP, banks were forced to buy high-yielding bonds with 1-5-year maturities to serve as underlying of the WMP. Examples of such bonds are lowly rated credit papers with poor liquidity, or non-standard securities such as discounted bills and bank loans. This resulted in a term mismatch between the maturity of WMP and their underlying asset. To avoid any squeeze from this mismatch upon maturity of the WMP, small banks started to engage in a kind of sale-and-buyback operation of the underlying bonds, consisting of two steps. In step 1, bonds were sold before quarter-end in a “fake” sale to a friendly counterparty, with the aim to obtain cash to pay back the maturing WMP. In a second phase of the trade, the bond was then bought back using cash from new WMP issues. But in May the regulator banned this practice, as part of a general clampdown of the abuses in the WPM market. Part of the interest rate squeeze we are observing today is due to the difficulty in liquidating the (illiquid) underlying bonds before the maturity date of WMP at June-end. The demand for cash has therefore risen significantly, at least from the small banks. Note that China’s larger banks do not have problems accessing liquidity, but that primarily the small banks are suffering.

As discussed earlier, it is clear that the PBoC does not have a good handle on banks' risk-based capital and the smaller banks in China have been playing the game of regulatory capital arbitrage. This is similar to US banks using off-balance-sheet vehicles funded with commercial paper to "convert" long-dated illiquid assets into short term (less than 365 days) exposure.

See the original article >>

Calmer Markets, but Precariously So

Marc to Market

A number of factors have helped stabilize the capital markets today. A partial recovery of US equities helped, though it took a nearly full recovery of the Shanghai Composite from an initial 5.5%+ decline to help lift the European markets. The recovery of US Treasuries yesterday and follow through today have help global bond markets recouped some of their recent losses. The US dollar for its part is steady to softer against the major currencies, while most of the free traded emerging market currencies are broadly higher.

The main impetus for the calmer markets is two-fold. First is simply technical. The sharp downside momentum in bonds and stocks seen from the second half of last week had appeared to exhaust itself. This forced short-term participants, especially momentum players, to pullback and even take some profits. Second, comments by officials, first in the US and then in China, also helped ease investor anxiety.

In the US, comments by Fed's Fisher and Kocherlakota (both non-voting members of the FOMC) reiterated that US monetary policy will remain easy even if there are long-term asset purchases. The useful reminder was not lost on the investors: the Fed is not close to tightening. What will be under consideration in a couple of months is whether the Fed should reduce the pace of easing.

Again, we are struck by the divergence of Fed and market views on the issue of the transmission mechanism of QE. Many in the market continue to see the purchases themselves as the key to the easing of monetary conditions. The Fed takes in Treasuries and MBS and credits dealers with reserves. Yet these reserves sit largely idle. The Fed has consistently argued that the real transmission lies with holding the "risk-free" assets off the market. 

There are at least nine Fed officials who are speaking between now and the end of the week.  Although the speeches do not seem particularly coordinated, we expect the underlying message to be largely the same:  the Fed may slow its easing efforts, as the downside risks have eased, but there is no intention to tighten policy any time soon.  

US economic data slated for release today will likely provide more points for the Fed's assessment that downside risks have eased..  Durable goods orders are likely to post back-to-back monthly increases for the first time since last Sept-Oct.   CaseShiller house price index is expected to have risen 1.2% in April, which is slightly above 3, 6, and 12 month pace.  Rising house prices have lifted some 1.7 mln households (according to CoreLogic) out of the negative equity position, they were in a year ago.  New home sales also are expected to have ticked up.    Meanwhile, keep in mind that core PCE deflator, due out tomorrow, is expected to show this important (for the Fed) measure of price pressures remain near record lows. 

In China, the cash crunch appeared to ease.  The overnight repo rate slipped almost 50 bp to 6% today (at the fix), which is half the rate seen at last week's peak, but it is still twice the average for the year.    The Deputy Director of the PBOC's Shanghai branch had some reassuring words for the market, suggesting that the central bank has the resources and will to keep money market rates at "reasonable" levels and suggested that the seasonal forces (apparently a reference to the quarter end settlement of various wealth management products that have been used to enhance returns available on deposits that involve in some ways a carry trade of sorts). 

In the foreign exchange market, the  euro briefly traded through yesterday's highs in late Asia, but European dealers initially sold into the up ticks that extended to $1.3150.   Short-term technical factors suggest the North American session will try it again.  Sterling has been in less than half a cent range today around yesterday's highs scored late in the day.  Support is seen near $1.5400-20 and provided it holds, a new marginal high seems likely..  Perhaps it the Scandis that best illustrate the corrective forces at work today.   They were among the hardest hit yesterday and are leading the recovery today with the Swedish krona up 1% and the Norwegian krone up 0.7% (near midday in London). 

Yesterday, we noted how the dollar was stopped against the yen at the 50% retracement of the losses it had suffered from May 22 through June 13.  The pullback began yesterday carried it to JPY97 in the European session before finding a bid.   Near-term consolidation that could extent back toward JPY97.70 today seems likely. 

See the original article >>

Follow Us