By tothetick
Stock-market crashes saw the light of day more and more as the world became industrialized. The 19th century saw a rapid increase in their numbers.
There’s money to be had at any time, whether the market is going up or down. But, it’s avoiding the downs and pulling out before the things start to go haywire that is important. Or, at least, investing in what’s good and what’s going to take a hike. But, how can you believe what people have to say? The only ones who are any good at selling a rise when in actually fact it’s a fall coming are the marketing gurus themselves. They are more common than we might think. It’s no modern invention either. We are past masters of selling what doesn’t exist. Selling make-believe is what makes people happy, until it takes a turn for the worse.
Some might say that predicting the downturn in the market can be done. You can develop algorithms and have sophisticated math, analyzing stock movements in multiple countries at the same time with split-second data churning out. You can use whacky ways to predict what’s happening if you can’t tot up the equations and come to a decision, like seeing how many toothbrushes are sold in the economy (as people tend to stop going to the dentist when there is a crisis). Although they are more likely to reveal what’s actually taking place, than what is going to happen just round the next corner.
Use as much economic forecasting as you like but the market won’t react always how you expect it to. We all know that. If it were an exact science, nobody would be poor. If it were a science at all, we would all be damn wealthy, wouldn’t we?
But, looking at what happened in the past sometimes helps us see what we are still doing today. We didn’t invent everything and we might think that we are high-flyers. But, somebody’s been there, done it and seen it all before. The 19th century was the industrialized world at its first beginnings. Trade, transport, better communication and money-making were high up on the agenda.
Here are the best (or the worst, depending on which side of the fence you are sitting) examples of stock-market crashes of the 19th century from the mammoth list that could be mentioned. The majority took place in the USA, which was at the heart of industrialized prowess at the time; a place where money could be made hand over fist, but where it could be lost twice as quickly. The John-Dos-Pasos world of disillusion and hope of classes in the race to become rich and somebody, a household name:
Panic of 1819
If you were told that the Panic of 1819 was due to the issuing of paper money and over-speculation of land, then you might have the impression that we are back in 2008-2012 and the financial crisis and the quantitative easing methods of today. But, no! The Panic of 1819 was due to the fact that Britain and France had been at war for decades, even centuries. They both had a need for US-produced goods and in particular agricultural products were very much in demand. Thanks to the warring between these two countries, the United States was able to become a major supplier and it prospered. However, when war ended things took a dive for the US. Europe was no longer in need and there was a bumper crop in 1817 in Europe leaving the USA in the lurch.
- Americans had been buying up land at rates that had never been seen so as to produce in what looked like a booming industry.
- In 1815, 1 million acres of land were sold off to the people.
- By 1819 that had increased to 3.5 million acres.
- All of it, of course, was purchased via loans. As things took a nose-dive, the people were unable to pay back their loans. Sounds like the credit crunch and the sub-prime crisis.
You would have thought that we would have learnt our lesson back then, wouldn’t you? But, no, we did the same thing: lending to people in times of economic boom, even to those that are going to be unable to pay it all back. The banks ended up demanding immediate repayment so they didn’t end up losing out. Sound familiar?
- Prices of agricultural products were plummeting while the plantation owners were over-producing due to having bought up too much land.
- Land prices fell and brought the economy down as the banks called in those loans.
- Bank credit was restricted, loans were cancelled and the Bank of the United States started printing money to deal with the lack of funds.
The printing presses went into action and the rest is history. Almost exactly what has happened today, isn’t it? Didn’t the people who decide study the Panic of 1819?
It was all down to a chain of events, the war between two countries, the reliance on another and suddenly when they are no longer at war they do a runner leaving the country that helped them out to do their own thing. But, isn’t all fair in love and war?
Perhaps the only good thing that came out of the panic was the understanding that there had to be some sort of poor relief for the people that were left destitute and the US education system was also created.
Panic of 1837
It was the USA’s trading relations with Great Britain that caused the panic of 1837 to take place in the US once again. Those Brits have a lot to answer for, I hear you say. They were economic leaders in the world (back then) and what they did had a great effect on what the rest of the world either did or what happened to others. Secondly, there were few trade barriers and that meant that the effects of liberal economics with little restraint based purely on supply and demand meant that changes were made almost immediately and put into effect.
The story goes like this.
- Britain was suffering from a slump in its agricultural production and ended up relying heavily on the USA, especially in terms of cotton and crops.
- The US agricultural industry was booming and so British investors placed their money where they were going to get the best returns.
- However, they didn’t bank on the fact that the Bank of England would increase interest rates (from 3% to 5%), in an attempt to replenish their diminishing reserves.
- The money that had been invested in the US by the British investors suddenly flowed back into the coffers of the Bank of England.
- The US was left only with the choice to do exactly the self-same thing in a copy-cat scenario.
A bit like bailing out the banks in the financial crisis. You start one and then everybody has to do it, don’t they? Or if you start baling out one country suffering from financial instability and the consequences of rising debt, then you can never let up and you can’t say no to the others. Then you are really done. Isn’t that where we are at now?

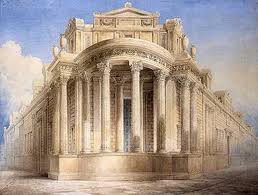
Bank of England
The US raised interest rates and there were restrictive credit policies. Money was in short supply and printing presses started up again to inject money into the economy. Politicians and Bank of the United States’ officials refused to make public addresses and people buried their heads in the sand thinking it would blow over.
Cotton prices shot through the roof and so did land prices. The effect was almost the same as in the 1819 panic: land prices and inflation in general. The result was catastrophic for the USA and ended up going well into the mid-1840s.
Panic of 1857
The 1857 panic is commonly known as the world’s first global financial crisis. By the 1850s, travel had gone through great changes. Railroads were already at their height of use and transport in trade was faster and better than it had ever been before.
Once again, it started in Britain at the time. Looks like Britain was the USA of yesterday, the financial-crisis instigator of the world at the time. Tough to carry that burden on your shoulders, but one saving grace is that people forget who, why and when very quickly just as soon as the next crisis comes along. Otherwise we wouldn’t be repeating history over and over, would we?
- The British government in 1857 did (and succeeded) everything in their power to get around the Peel Banking Act of 1844, requiring that gold and silver back up the money that was in circulation.
- The panic that ensued in Great Britain spread rapidly to the US and it was the Ohio Life Insurance and Trust Company that caused the triggering of the panic in 1857 in the US.
- It was all down to fraudulent activities of the bank’s executives that there was a bank-run in 1857.
- The bank suspended activities after incurring losses of $7 million.
- They had lent too much money to railroads in the conquest of the west.
- However, it was in 1857 that the flow of people to the west had considerably slowed down.
- They had over-lent to railroad companies and they didn’t have enough gold or silver to back it up, just like in Britain.
- The value of land fell, the railroad securities disappeared.
- The banks went into meltdown.
Once again, the banking system had lent too much in times of economic prosperity, and they didn’t have enough to back it up. The railroads also went into meltdown and so did the farmers. Land prices depreciated and crops became almost worthless (grain hit the floor at $0.80 a bushel, spiraling from the dizzy heights of $2.19).
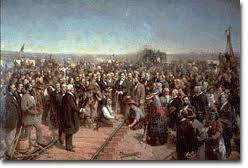
Railroads in the USA
It was the Panic of 1857 that partly resulted in the American Civil War a few years later. The north had suffered immensely from the drop in prices. The south had not suffered quite so much. The south became stronger in the relationship between the two parts of the USA, but tensions grew to the widening disparity between the wealth and the problem of slavery that was central to their dispute.
Panic of 1873
This time it was another world recession that became the first one that was known as the ‘Great Depression’ until an even greater one came along in the 1929 and then it was relegated to the back-burner, forgotten. It was a depression that was triggered by Germany this time and their decision to get rid of the silver standard. It put an end to Great Britain’s hegemony in the world.
- Bank reserves had been put under a great deal of strain from money that had been lost in the construction of railways as well as due to speculative investments and property-sector losses that hit hard. The railways were the dot com bubbles of the 1990s and 2000s. Massive investment, euphoria, then a pin prick, and it all deflated.
- The German decision to stop using silver to mint coins resulted in a fall in prices in the USA, where most of the silver was exported from at the time. Due to the fall in demand, the Coinage Act was passed and meant that the US used the gold standard. Silver lost even more in price.
The Germans instigated the move away from liberal free-market policies towards ones that were more conservative.
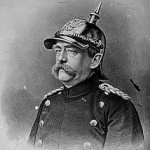
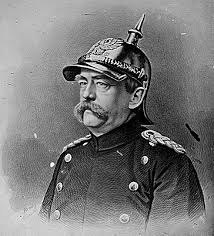
Otto Von Bismarck
Bismarck as Chancellor nationalized industries and even created the social security system to provide workers with pensions so that they state wouldn’t have to pay for them at retirement age (which was later exported all around the world, until it became too much for us to finance).
Conclusions
The panics happened every twenty years and then towards the end of the 19th century they accelerated closing the gap between each panic as we became more industrialized, more dependent on travel, transport and communication became faster and faster. There were other panics that occurred in 1884, then again in 1893 and 1896. Panic was synonymous with the world that the 19th century had wafted in on the railroads that they were building. But, it wasn’t a patch on what the 20th century had in store as the panics and crashes became more and more recurrent.
So, are there reasons why the stock markets created so many bubbles that bust in the faces of our 19th-century ancestors? That was probably because there was a major rise of the middle-class in the 19th century. It wasn’t just the select very few that were from the higher echelons of society that were going into business. Making money, rather than inheriting it was the order of the day for the first time in the 19th century. The Industrial Revolution had brought entrepreneurship into the living rooms of the middle classes on a steam train. It had opened doors in communication, transport and energy. There were opportunities to be had in every sector and there were at last more than just that select few who were ready to make a buck. There was also reduced interference by the state and the beginnings of the forging of the system in which we live today. Risks were taken. Whether they were calculated risks or not is entirely another matter? But, it was the 19th century when industrialization meant opportunity and yet still at the same time a working class that was not adequately organized to defend itself or demand more than the entrepreneurs allowed them to.

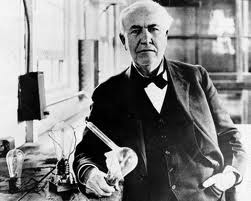
Thomas Edison
The list of entrepreneurs that stands witness to the 19th century’s success is endless. The Edisons and the Carnegies, the Rockefellers and the Vanderbilts are still today almost as strong as household names, aren’t they?
See the original article >>