Wednesday, June 5, 2013

China’s Stealth Wars

by Brahma Chellaney

NEW DELHI – China is subverting the status quo in the South and East China Seas, on its border with India, and even concerning international riparian flows – all without firing a single shot. Just as it grabbed land across the Himalayas in the 1950’s by launching furtive encroachments, China is waging stealth wars against its Asian neighbors that threaten to destabilize the entire region. The more economic power China has amassed, the greater its ambition to alter the territorial status quo has become.

This illustration is by Paul Lachine and comes from <a href="http://www.newsart.com">NewsArt.com</a>, and is the property of the NewsArt organization and of its artist. Reproducing this image is a violation of copyright law.

Illustration by Paul Lachine

Throughout China’s recent rise from poverty to relative prosperity and global economic power, the fundamentals of its statecraft and strategic doctrine have remained largely unchanged. Since the era of Mao Zedong, China has adhered to the Zhou Dynasty military strategist Sun Tzu’s counsel: “subdue the enemy without any battle” by exploiting its weaknesses and camouflaging offense as defense. “All warfare,” Sun famously said, “is based on deception.”

For more than two decades after Deng Xiaoping consolidated power over the Chinese Communist Party, China pursued a “good neighbor” policy in its relations with other Asian countries, enabling it to concentrate on economic development. As China accumulated economic and strategic clout, its neighbors benefited from its rapid GDP growth, which spurred their own economies. But, at some point in the last decade, China’s leaders evidently decided that their country’s moment had finally arrived; its “peaceful rise” has since given way to a more assertive approach.

One of the first signs of this shift was China’s revival in 2006 of its long-dormant claim to Indian territory in Arunachal Pradesh. In a bid to broaden its “core interests,” China soon began to provoke territorial disputes with several of its neighbors. Last year, China formally staked a claim under the United Nations Convention on the Law of the Sea to more than 80% of the South China Sea.

From employing its strong trade position to exploiting its near-monopoly on the global production of vital resources like rare-earth minerals, China has staked out a more domineering role in Asia. In fact, the more openly China has embraced market capitalism, the more nationalist it has become, encouraged by its leaders’ need for an alternative to Marxist dogma as a source of political legitimacy. Thus, territorial assertiveness has become intertwined with national renewal.

China’s resource-driven stealth wars are becoming a leading cause of geopolitical instability in Asia. The instruments that China uses are diverse, including a new class of stealth warriors reared by paramilitary maritime agencies. And it has already had some victories.

Last year, China effectively took control of the Scarborough Shoal, an area of the South China Sea that is also claimed by the Philippines and Taiwan, by deploying ships and erecting entry barriers that prohibit Filipino fishermen from accessing their traditional fishing preserve. China and the Philippines have been locked in a standoff ever since. Now the Philippines is faced with a strategic Hobson’s choice: accept the new Chinese-dictated reality or risk an open war.

China has also launched a stealth war in the East China Sea to assert territorial claims over the resource-rich Senkaku Islands (called the Diaoyu Islands in China), which Japan has controlled since 1895 (aside from a period of administration by the United States from 1945 to1972). China’s opening gambit – to compel the international community to recognize the existence of a dispute – has been successful, and portends further disturbance of the status quo.

Likewise, China has been posing new challenges to India, ratcheting up strategic pressure on multiple flanks, including by reviving old territorial claims. Given that the countries share the world’s longest disputed land border, India is particularly vulnerable to direct military pressure from China.

The largest territory that China seeks, Arunachal Pradesh, which it claims is part of Tibet, is almost three times the size of Taiwan. In recent years, China has repeatedly attempted to breach the Himalayan frontier stretching from resource-rich Arunachal Pradesh to the Ladakh region of Jammu and Kashmir – often successfully, given that the border is vast, inhospitable, and difficult to patrol. China’s aim is to needle India – and possibly to push the Line of Actual Control southward.

Indeed, on April 15, a platoon of Chinese troops stealthily crossed the LAC at night in the Ladakh region, establishing a camp 19 kilometers (12 miles) inside Indian-held territory. China then embarked on coercive diplomacy, withdrawing its troops only after India destroyed a defensive line of fortifications. It also handed a lopsided draft agreement that seeks to freeze the belated, bumbling Indian build-up of border defenses while preserving China’s capability to strike without warning.

India has countered with its own draft accord designed specifically to prevent border flare-ups. But territory is not the only objective of China’s stealth wars; China is also seeking to disturb the status quo when it comes to riparian relations. Indeed, it has almost furtively initiated dam projects to reengineer cross-border river flows and increase its leverage over its neighbors.

Asian countries – together with the US – should be working to address Asia’s security deficit and establish regional norms. But China’s approach to statecraft, in which dominance and manipulation trump cooperation, is impeding such efforts. This presents the US, the region’s other leading actor, with a dilemma: watch as China gradually disrupts the status quo and weakens America’s allies and strategic partners, or respond and risk upsetting its relationship with China, the Asian country most integral to its interests. Either choice would have far-reaching consequences.

Against this background, the only way to ensure peace and stability in Asia is to pursue a third option: inducing China to accept the status quo. That will require a new brand of statecraft based on mutually beneficial cooperation – not brinkmanship and deception.

See the original article >>

Two More Weekly LCD Sell Signals

by Tom Aspray

The US stock market failed to continue higher after Monday’s rebound, and once again, the overseas markets are putting pressure on US stocks in early trading Wednesday. The Nikkei 225 was hit hard again as it lost 3.26% overnight, and there were greater than 1% losses in several of the Euro markets.

For the past week, the market internals like the NYSE Advance/Decline have been acting weaker than prices so a further decline would not be surprising. Some of the key averages like the NYSE Composite are already reaching the support from the April highs as it is down 2% from its recent highs.

It appears that traders are quickly moving from one sector to another, which has made the ranges even wider. Since May 2012, two of my favorite sector plays have been the Select Sector SPDR Health Care (XLV) and biotechnology. XLV is up 35.9% from last June’s lows while the DJ Biotechnology Index is up 63.4%. They have both clearly outperformed the 28.6% gain in the Spyder Trust (SPY).

On a seasonal basis, health care typically tops out in late May so this, combined with last week’s LCD sell signal, suggests that this market-leading sector may be ready for a rest. Health care broke out of a 12-year trading range last March so the longer-term outlook is still clearly positive. The charts can help us determine likely downside targets for health care, as well as two leading biotech ETFs.

chart
Click to Enlarge

Chart Analysis: The Select Sector SPDR Health Care (XLV) hit a high on May 22 like many of the market averages and is down 4.6% from its high of $50.40.

  • The weekly starc- band is now at $46 with the 20-week EMA at $45.76.
  • The longer-term uptrend from the 2011 lows is at $45.70, which corresponds nicely with the major 38.2% Fibonacci retracement support.
  • The 50% support level is at $40.
  • The weekly relative performance did not confirm the recent highs, line b.
  • The RS line is still well above its WMA and the uptrend line c.
  • The OBV did confirm the highs with initial support at its WMA and then further at line d.

The daily chart of the DJ Biotechnology Index closed last week below the prior week’s lows after making a high in May at 1183.

  • The daily starc- bands are now being tested suggesting that prices should stabilize or rebound in the near future.
  • There is first resistance in the 1225-1265 area.
  • The daily relative performance peaked in April and has formed lower highs, line e.
  • The RS line broke its support, line f, on May 31 just before highs.
  • The daily OBV also did not confirm the recent highs (line g) and then dropped below the support, line h, that goes back to the middle of March.
  • A rebound back to the OBV’s declining WMA should be a good short-term selling opportunity.
  • The major 38.2% retracement support is at 1022, which is 5.7% below current levels.

chart
Click to Enlarge

The SPDR S&P Biotech ETF (XBI) has assets of $758 million and its largest holding makes up less than 3% of the ETF. It has an expense ratio of 0.35%.

  • It triggered a LCD sell signal with last week’s close at $107.52.
  • There is next minor support at $104.50 with the weekly uptrend, line b, at $101.93.
  • The April highs at $97 are the next major support with the 38.2% Fibonacci retracement support at $91.
  • The weekly studies have turned lower but are both positive as the RS line did confirm the highs and is above its WMA.
  • The OBV broke through resistance, line d, in the middle of April confirming the price action.
  • There is good support for the OBV at its WMA and then the uptrend, line e.
  • The key resistance is at the doji high of $113.53.

The iShares Nasdaq Bitoechnology Index (IBB) has assets of $2.58 billion but is less diversified that XBI as its top ten holdings make up 57% of the fund. Gilead Sciences GILD -4.07% (GILD) and Regeneron Pharmaceuticals REGN -1.31% (REGN) both make up over 8% of the fund. It has an expense ratio of 0.48%.

  • IBB closed above its starc+ band on May 13, which was one day before its high at $186.34.
  • Prices are now close to the daily starc- band with further support in the $170 area.
  • The 38.2% support from the November lows (not shown) is at $164.
  • The daily uptrend, line e, is a bit lower at $161.70.
  • The daily relative performance appears to have completed a short-term top as it has broken through support at line f.
  • The daily OBV did confirm its highs but volume was heavy in the past two days.
  • This has dropped the OBV below its WMA and is testing its uptrend, line g.
  • There is a band of resistance now in the $178.50-$180.70 area.

What it Means: Those who are heavily long health care or biotech sectors should have a plan in place as a further correction is likely this month. I would expect them to rebound in the next week, at which time I will look to take further profits on XLV.

How to Profit: Biotechnology is one sector I will be watching closely as the market corrects as some of the key stocks are already well below their highs and a further correction should provide good buying opportunities.

Portfolio Update: Still long the Select Sector SPDR Health Care (XLV) from $38.50 but have taken some profits as it has moved higher. We are using a fairly wide stop for now at $45.72.

See the original article >>

The Dow's Ten Most Overbought Stocks

by Tom Aspray

As I pointed out in my Week Ahead column, the weekly close in the NYSE Composite below the prior three-week lows suggests that June may be a difficult month for stocks. Since the weekly and daily A/D lines have confirmed the recent highs, any correction should be a pause in the major trend.

This month’s starc band scan of the stocks in the Dow Industrials can be helpful in identifying those stocks that should be considered for profit taking, as well as identifying those stocks that should be monitored for buying opportunities on a further correction.

For those who are not familiar with these monthly scans, it identifies the stocks that are closest to either the upper (starc+) or lower (starc-) bands. When a stock is near the starc+ band, it is a high-risk buy but that does not mean the stock cannot still go higher. If a stock closes above the monthly starc+ band for several consecutive periods, then it becomes increasingly more vulnerable.

chart
Click to Enlarge

At the top of the list this month, is the Boeing Co. (BA), which closed at $99.02, 1% above the monthly starc+ band at $98.07. BA was up 8.3% in May and is up 31.4% so far in 2013.

Of course, the rest of the top ten stocks are also some of the year’s best performers, but on a 5-10% correction in the stock market, they still will be vulnerable. The completion of the reverse H&S formation in T-bond yields may also put some short-term pressure on the higher yielding large-cap stocks. Therefore, I have included the yields on the table and will focus on the four most interesting overbought Dow stocks.

chart
Click to Enlarge

Chart Analysis: As the long-term chart reveals, it is quite unusual for Boeing Co. (BA) to close above its monthly starc+ band. The last time it occurred was in April of 2006.

  • The following month in 2006, BA made new highs and exceeded the starc+ but did not close above it. It lost 19.4% over the next four months.
  • The blue circles show that the monthly starc+ band was also approached in June 2007 and March 2010.
  • The May high at $101.47 was still well below the all-time highs at $107.83 from July 2007.
  • The relative performance broke its long-term downtrend, line b, in March when BA closed at $85.85.
  • The OBV also broke out in March as it surpassed the resistance at line c.
  • It was a positive sign that the OBV was able to hold its multi-year uptrend, line d.
  • There is initial support at $97.07 and the monthly pivot. There is additional support at $92.67.
  • The major 38.2% Fibonacci retracement support from the 2012 low is at $88.24.

American Express Co. (AXP) closed above the 2007 high, line e, at the end of March. Therefore the $65.90-$66.20 area is now a major level of support.

  • The last time AXP closed near its monthly starc+ band was at the end of 2006.
  • The weekly chart of AXP (see insert) shows that it formed a doji last week and an LCD will be triggered on a weekly close below $75.39.
  • The monthly pivot is at $73.75 with the S1 at $70.13, which is also close to the minor 50% Fibonacci support level.
  • The relative performance has moved through its resistance at line g and is well above its flat WMA.
  • The monthly OBV just broke out at the end of April (line h) and has support going back to 2010, line i. It is below the 2006 high.
  • The weekly studies are all positive and have confirmed the recent highs. This is consistent with a correction that will be well supported.

chart
Click to Enlarge

Johnson and Johnson (JNJ) is a stock that I have been trying to buy since February, and it appears to have formed a near-term top at $89.99 on May 22.

  • JNJ has corrected 6.4% from the highs but is still up over 20% for the year.
  • The monthly chart shows what is called a gravestone doji as the open, low, and close are near the same levels.
  • The monthly pivot support is at $82.04 with the major 38.2% Fibonacci support from the 2012 lows now at $78.96.
  • The former breakout level, line a, is at $74.50.
  • The relative performance broke its downtrend, line b, in February but is still well below the 2011 highs.
  • The monthly on-balance volume (OBV) looks much stronger as it broke out in late 2011 and has made a series of higher highs as it is leading prices higher.
  • There is initial resistance now at $86.56 to $88.29.

The monthly chart of the Walt Disney Co. (DIS) also shows a gravestone doji, and as is the case with JNJ, a monthly LCD could be triggered in June.

  • DIS is down almost 7% from the early May high of $67.89.
  • The insert of the weekly chart shows that DIS closed above its weekly starc+ band for two weeks in early May before triggering a LCD (see arrow).
  • There is next support in the $60.50-$61.20 area with the 38.2% support from the May lows at $59.80.
  • The monthly relative performance overcame strong resistance, line f, in early 2012.
  • The RS line has confirmed the new highs and is well above its rising WMA.
  • The OBV broke through its resistance, line h, at the end of November and has been acting very strong.
  • The OBV is well above its rising WMA.
  • There is first resistance in the $65.60 to 67.15 areas.

What it Means: Both Boeing Co. (BA) and American Express Co. (AXP) still look quite positive from the monthly charts, but I would not be surprised to have them see a one-two month correction as the overall market is looking more vulnerable They could easily drop 5-10% from their May highs.

Since both Johnson and Johnson (JNJ) and Disney Co. (DIS) have already corrected significantly from the recent highs, their correction may be already half over. Since both show strong weekly and monthly OBV patterns, a further correction should be a buying opportunity.

How to Profit: No new recommendations for now.

See the original article >>

The Most Important Economic Number

by Lance Roberts

Over this past weekend Russ Koesterich, CFA, who is the iShares Global Chief Investment Strategist, penned an article entitled "The Most Important (And Widely Ignored) Economic Number" wherein he states:

"While economic numbers like GDP or the monthly non-farm payroll report typically garner the headlines, the most useful statistic in my opinion– the Chicago Fed National Activity Index (CFNAI) – often goes ignored by investors and the press."

Russ is correct.  The Chicago Fed National Activity Index is a composite index made up of 85 subcomponents which gives a broad overview of overall economic activity in the U.S.  As Russ states ignoring the CFNAI could be a mistake:

Markets have run up sharply in recent months partly on the assumption that US economic growth is going to accelerate later this year and translate into faster earnings. But if recent CFNAI readings are any indication, investors may want to alter their growth assumptions for the third and fourth quarters.

Unlike backward-looking statistics like GDP, the CFNAI is a forward looking metric that gives some indication of how the economy is likely to look in the coming months.

The overall index is broken down into four major sub-categories which cover:

  • Production & Income
  • Employment, Unemployment & Hours
  • Personal Consumption & Housing
  • Sales, Orders & Inventories

To get a better grasp of these four major sub-components I have constructed a 4-panel chart showing each.

CFNAI-4panel-chart-060313

There are a couple of important points to be made in reference to the chart above.

  1. The production, employment and sales components all appear to have peaked for the current economic cycle despite ongoing estimations of stronger economic growth in the last half of 2013. 
  2. The consumption and housing component, while it has gotten stronger, remains well below its 2000 levels.

Russ stated that:

"And of all the indicators I've tested, the CFNAI has the best track record of forecasting future GDP. Since 1980 the CFNAI has explained roughly 40% of the variation in the following quarter's GDP, an extremely high proportion for a single indicator."

In order to assess that predictive capability I have created a second 4-panel chart with the four CFNAI subcomponents compared to the four most common economic reports of Industrial Production, Employment, Housing Starts and Personal Consumption Expenditures.  In order to get a comparative base to the construction of the CFNAI I used an annual percentage change for these four components.

CFNAI-4panel-chart-060313-2

The correlation between the CFNAI subcomponents and the underlying major economic reports do show some very high correlations.  This is why, even though this indicator gets very little attention, it is very representative of the broader economy.

Currently, the CFNAI is not confirming the mainstream view of an "economic softpatch" that will give way to a stronger recovery by year end.  The latest CFNAI report plunged to -0.52 for April and the index has been negative for the past few months.  This is shown in the chart below which shows the CFNAI index as compared to its 3-month average.

CFNAI-Index-vs-3mo-060313

Russ goes on to state that:

"While the CFNAI's current level is still consistent with economic growth, it does suggest that growth will sharply decelerate in the second and third quarters of this year, falling to about 1.8%."

This last statement is key to our ongoing premise of weaker than anticipated economic growth despite the Federal Reserve's ongoing liquidity operations.  The current trend of the various economic data points on a broad scale are not showing indications of stronger economic growth but rather a continuation of a sub-par "muddle through" scenario of the last three years.

While this is not the end of the world, economically speaking, such weak levels of economic growth do not support stronger employment, higher wages or justify the markets rapidly rising valuations.  The weaker level of economic growth will continue to weigh on corporate earnings which, like the economic data, appear to have reached their peak for this current recovery cycle.

The CFNAI, if it is indeed predicting weaker economic growth over the next couple of quarters, also doesn't support the recent rotation out of defensive positions into cyclical stocks that are more closely tied to the economic cycle.  The current rotation is based on the premise that economic recovery is here, however, the data hasn't confirmed it as of yet.

The reality is that either the economic data is about to take a sharp turn for the positive or the market is set up for a rather large disappointment when the expected earnings growth in the coming quarters doesn't appear.   From all of the research that I have done as of late, it is the latter that seems the most likely of outcomes as there does not seem to be a driver, currently, for the former.  Maybe the real question is why we aren't paying closer attention to what this indicator has to tell us?

See the original article >>

Dangerous Divergences Between Bonds and Stocks

By: Gary_Dorsch

It all seems so surreal. After being mesmerized by the Fed’s hallucinogenic “Quantitative Easing,” (QE) drug, and seduced by the Fed’s Zero Interest Rate Policy (ZIRP), and rescued by the Fed’s clandestine intervention in the stock index futures market, for the past 4-½-years, it’s easy to forget that there was once a time when the Fed’s main policy tool was simply adjusting the federal funds rate. It’s even harder to recall that two decades ago, the Fed’s raison d’ĂȘtre was combating inflation, whereas today, the Fed’s main mission is rigging the stock market, and inflating the fortunes of the wealthiest 10% of Americans.

“The central bank’s purpose is to get ahead of the inflation curve,” declared Wayne Angell, one of the seven governors of the Federal Reserve on June 1st, 1993. Angell had a reputation as a Fed hawk, and he was pushing for a tighter monetary policy, even before an uptick in the inflation rate showed-up in the government’s statistics. “If we’re ahead of the curve, our credibility and the value of our money is maintained. Some of my economist friends tell me, ‘We don’t feel much inflation out there, but we feel better knowing that you’re worried about it.” Thus, there was a time when savers received a positive rate of return on their money.

Two decades ago, the Greenspan Fed was stacked with hawkish money men. And because their tenures lasted for 14-years, they felt immune to the winds of politics. Thus, if the Fed governors were to make unpopular decisions to hike interest rates, in order to bring inflation under control, or burst asset bubbles, so be it. Of course, it’s much different today - the Fed is stacked with addicted money printers that are beholden to the demands of their political masters at the Treasury and the White House. How did Fed policy swing so radically from Angell’s day – when Fed tightening meant lifting the federal funds rate and draining excess liquidity, to today’s markets, - where a small reduction in the size of the Fed’s massive QE injections is considered to be a tighter money policy?

The Treasury Bond Vigilantes, - is a nickname that was used to refer to a legendary band of renegade bond traders, who used to fire-off warning shots to Washington, by aggressively selling T-bonds in order to protest any monetary or fiscal policies they considered inflationary. The jargon refers to the bond market’s ability to serve as a brake on reckless government spending and borrowing. The last major sighting of the bond vigilantes was in Europe, as they wrecked havoc upon the debt markets of Greece, Ireland, Italy, Portugal, and Spain.

James Carville, a former political adviser to President Clinton famously remarked at the time that “I used to think that if there was reincarnation, I wanted to come back as the president or the pope or as a .400 baseball hitter. But now I would like to come back as the bond market. You can intimidate everybody,” he remarked. However, the so-called T-bond vigilantes appeared to be dead and buried over the past few years, as the US-Treasury was able to borrow trillions of dollars, largely financed by the Fed at the lowest interest rates in history. Keeping the T-bond vigilantes on ice, is a key linchpin of the Fed’s Ponzi scheme, that’s used to inflate the value of the US-stock market and keep it perched in the stratosphere.

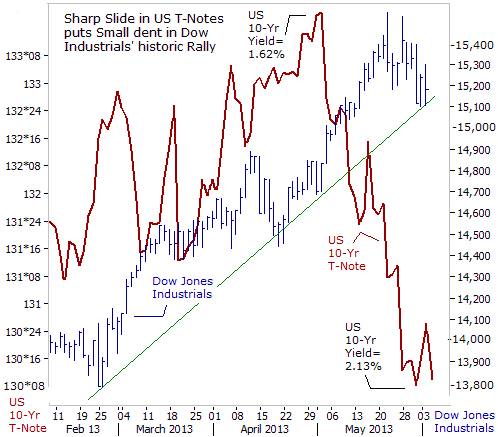
However, last month, (May ’13), something very strange began to happen. It looked as though the long dormant T-bond vigilantes were suddenly beginning to awaken from their slumber. Indeed, - the long-end of the US Treasury bond market suffered its worst monthly decline in 2-½-years, as yields jumped to their highest levels in 13-months. Ticker symbol TLT.N, - the iShares Barclays 20+ Year Treasury Bond fund lost -7% of its market value. It looked as though Wall Street’s bond dealers were whittling down their holdings of T-bonds, - acting upon insider information from the New York Fed, - that the biggest buyer in the T-bond market could soon reduce the size of its monthly purchases and thereby cause T-bond prices to fall. Interestingly enough, T-bond yields jumped �bps higher even though US-government apparatchiks said inflation was only +1% higher than a year ago.

During Greenspan’s tenure, the Fed would try to push T-bond yields higher, by lifting the overnight federal funds rate. But in today’s hallucinogenic world of QE, - near zero-percent short-term T-bill rates, and historically low bond yields, - if the Fed begins to reduce the monthly size of its T-bond purchases in the months ahead, - it could have the same effect as a quasi tightening. That’s because the Fed has so badly distorted and inflated market prices over the last few years. If the heavy hand of the Fed is gradually withdrawn from the marketplace, the big question is: what would it mean for the $21-trillion US-equity market?

The Bernanke Fed is coming under increasing criticism. On May 29th, the 85-year old icon of central banking, - the greatest warrior against inflation in US-history, - former Fed chief Paul Volcker waded into the debate over when the Fed should start unwinding its radical QE operation, arguing that the “benefits of bond-buying are limited and is like pushing on a string.” Volcker launched a scathing critique of the Bernanke Fed, inferring the central bank had become a serial bubble blower. “The Fed is effectively acting as the world’s largest financial inter-mediator. The risks of encouraging speculative distortions and the inflationary potential of the current approach plainly deserve attention,” he warned.

Volcker reminded the new breed of Fed lackeys that the central bank’s basic responsibility is to maintain a “stable currency,” and that it should unwind its reckless scheme of massively increasing the US-money supply and blowing bubbles in the stock market. “Credibility is an enormous asset. Once earned, it must not be frittered away by yielding to the notion that a little inflation right now is a good a thing, a good thing to release animal spirits and to pep up investment. The implicit assumption behind that siren call must be that the inflation rate can be manipulated to reach economic objectives. Up today, maybe a little more tomorrow and then pulled back on command. Good luck in that. All experience demonstrates that inflation, when fairly and deliberately started, is hard to control and reverse,” Volcker warned.

Last week, the Treasury’s 10-year yield climbed above the 2%-level, following Volcker’s remarks. The 85-year old Fed hawk still commands a lot of respect on Wall Street and his voice is not easy for the Fed’s rookies to tune out. The recent plunge in T-bond prices did trigger a knee-jerk sell-off in the stock market, that briefly knocked the Dow Industrials lower to the 15,100-level. But in a June 3rd note, Goldman Sachs (GS) released a message to the financial media, telling investors to remain calm amid the bond market sell-off. GS reiterated its Bullish stance on the US-stock market, - saying further gains lie ahead, and that S&P-500 companies have plenty of cash on hand, that can be deployed to offset the negative effect of higher interest rates, - by increase their dividends +11% this year and +10% in 2014. If correct, that would lift the S&P-500’s dividend yield to a meager 2.3-percent.

Still, yields on 10-year T-Notes increased by a half-percent in the month of May, including a jump of �bps on May 28th, - seen as a signal that the Fed’s would scale back its QE-injections. “A slowing in the pace of purchases could be viewed as applying less pressure to the gas pedal, rather than stepping on the brake,” said Kansas City Fed chief Esther George on June 4th. “It would importantly begin to lay the groundwork for a period when markets can prepare to function in a way that is far less dependent on central bank actions and allow them to resume their most essential roles of price discovery and resource allocation. I support slowing the pace of asset purchases as an appropriate next step for monetary policy. Waiting too long to prepare markets for more-normal policy settings carries no less risk than tightening too soon,” Ms George added. The Kansas City Fed chief cited signs of overheating markets, including margin loans at broker-dealers at a record $384-billion in April.

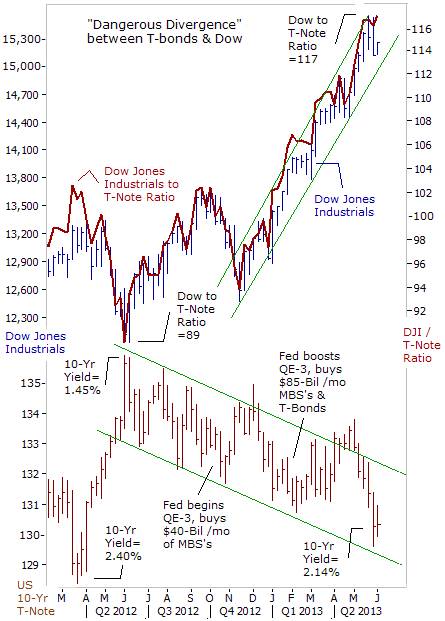
“We cannot live in fear that gee whiz the stock market is going to be unhappy that we are not giving them more monetary cocaine,” added Dallas Fed chief, Richard Fisher on June 4th. Still, many traders don’t believe that the Bernanke Fed could ever kick the QE-habit and act to tighten the money spigots. Since May ’12, traders have played the “Great Rotation” – shifting out of bonds and moving into stocks, seen as the best way to profit from the Fed’s radical schemes. However, there’s a good chance that going forward - the “Great Rotation” could morph into the “Dangerous Divergence.” If left unchecked, an extended slide in the T-bond market could trigger an upward spiral in the 10-year yield towards 3-percent, which in turn, would threaten to blow up the Fed’s Ponzi scheme.

Already, the ratio between the value of the Dow Industrials and 10-year T-note futures has reached the 116-level, - doubling from the 58-level – where it bottomed out in March ’09, and is within striking distance of its 2007 high. A last gasp rally in the US-stock market could be the catalyst that triggers a sharp sell-off in T-notes. At that point, the “Dangerous Divergence” could reach the breaking point, leaving the bond vigilantes to do their dirty work.

Minor Earthquake in Tokyo Bond market, - The recent sharp slide in US T-Notes was preceded by a tremor in the world’s second largest bond market in Tokyo. On April 4th, the Bank of Japan’s (BoJ) new governor, Haruhiko Kuroda, unveiled the most radical scheme ever, - designed to “shock and awe” Japanese bond traders into complete submission. The BoJ said it would double the amount of yen in circulation over the next two years, in order to whip-up inflation in the world’s third largest economy. The BoJ said it would trump the Fed, by printing ¥7-trillion each month, to be used to buy Japanese government bonds (JGB’s).

The BoJ was certain that it could continue to arm-wrestle Japanese banks and persuade its loyal citizens into buying 10-year JGB’s at yields of less than 1%, even as the BoJ says its aim is weaken the value of the Japanese yen, increase the costs of imports, and increase the consumer inflation rate to +2%. In other words, the BoJ expects investors to lock in negative yields for the next ten years. However, the gambit began to backfire, when yields on 10-year JGB’s rebounded from a historic low of 0.315% and surged to as high as 1% on May 23rd, - triggering a -7.3% crash in the Nikkei stock index. It was the Nikkei’s biggest one-day fall in 2-years, and kicked off an extended -17.5% slide to 13,050 by June 3rd.

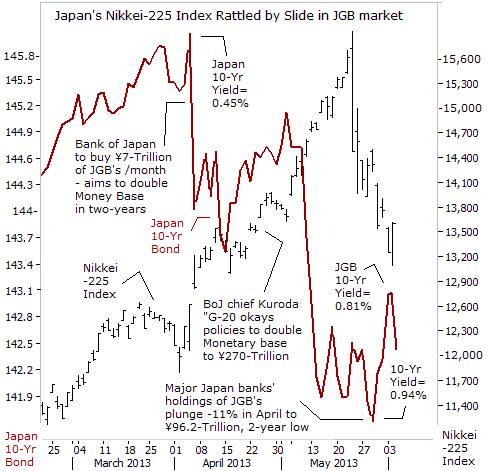
It was later revealed on May 30th, that Japan’s biggest banks decided to slash their holdings of JGB’s to ¥96.3-Trillion, in the month of April, - a sign that their selling played a major role in pushing up yields to 1%. Japanese banks were unusually rebellious, and dumped 11% of their JGB’s holding onto the BoJ’s balance sheet, fearing a major rout in the future. For the BoJ, trying to force JGB yields lower, when its trying to weaken the value of the yen and whip-up inflation, - is like trying to submerge a helium balloon under water.

If this exodus from the JGB market continues, it could blow apart the BoJ’s Ponzi scheme. Japan’s outstanding debt is equivalent to 245% of its annual economic output, and 92% of the debt has been financed by domestic savings. But this may not continue. A government panel’s draft report has reportedly warned that there is “absolutely no guarantee” that domestic investors will keep financing government debt. The BoJ has calculated that a rise in JGB yields of just 1% would lead to market losses equivalent to 10% of the core capital for the top Japanese banks, and 20% losses for the smaller regional banks.

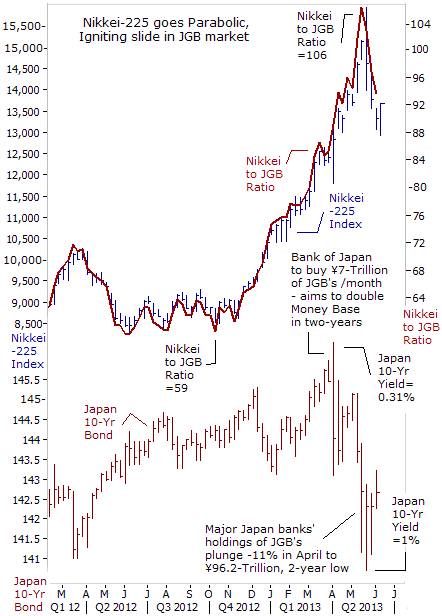
So far, the immediate impact of the BoJ’s Big-bang QE scheme has been a rapid and parabolic rise in Tokyo stock prices. These increases were fuelled by a frenzy of speculation by foreign traders. But rather than reflecting an economic recovery, the booming share markets are indicative of what the former-CEO of Citigroup, Chuck Prince, famously noted in July 2007, “As long as the music is playing, - you’ve got to get up and dance.” Nikkei Bulls are hopeful that the BoJ can keep the music playing, by boosting the size of its monthly JGB purchases if necessary. However, Tokyo cannot act in a vacuum - it would have to receive permission for an expanded QE scheme from its “Group-of-Seven” co-conspirators. And that’s unlikely.

“Stock markets are under the spell of QE,” In fact, both the BoJ and the Fed are in the crosshairs of the Bank for International Settlements (BIS), which warned on June 2nd, about the dangers of their ultra-cheap money policies that are driving up stock prices, despite worsening economic news. “Investors have ignored poor economic news as stocks have risen, leaving markets vulnerable to unsettling volatility and potential losses. Excessive monetary easing helped market participants to tune out signs of a global growth slowdown. But the rapid gains left equity valuations vulnerable to changes in sentiment, as witnessed in the recent bout of volatility in Japan,” the BIS warned.

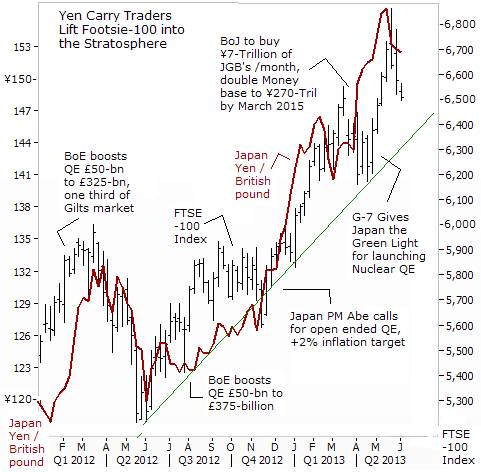
“Yen Carry” Trade lifts London Stock Exchange, “With yields in core bond markets at record lows, investors turned to lower-rated European bonds, emerging market paper and corporate debt to obtain yield. Abundant liquidity and low volatility fostered an environment favoring risk-taking and yen carry trade activity,” the BIS noted. Whether by extraordinary good luck, or by clever design, the FTSE-100 index didn’t need the help of the Bank of England’s (BoE) money printing machine, in order to climb sharply higher to the 6,800-level this year. Instead, the Footsie hitched a ride to the rising tide of liquidity flowing from Tokyo, - via the “yen carry” trade. It was a smart move by the BoE to kick the QE-habit back in November. The maneuver provided a solid foundation for the British pound to rally strongly against the Japanese yen, thereby encouraging carry traders to borrow cheaply in yen, and plow the cash in high yielding Footsie blue chips.

In its report, the BIS went on to say that stock markets “are under the spell of monetary easing to the point where negative news such as downbeat economic data doesn’t stop stocks from going up. Every time an economic indicator disappointed, traders simply took that as confirmation that central banks would continue to provide stimulus,” such as near zero percent interest rates or QE schemes that increase the supply of money in the economy.

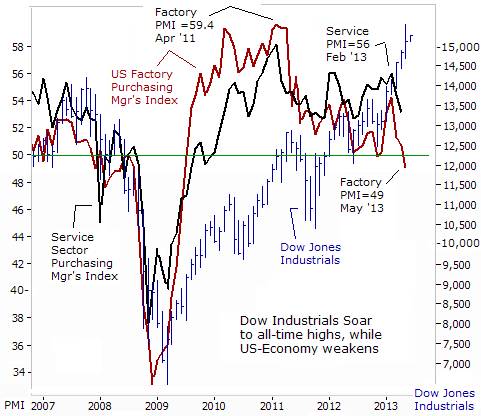
Such was the case on June 3rd - when the ISM’s index of US-factory activity fell to a reading of 49 in the month of May, down from 50.7 in April. That’s the lowest level in nearly four years and the reading under 50 indicates contraction. The unexpected drop in the headline figure reflected contractions in both the new orders index which fell to 48.8 in May from 52.3 in April, while the production index plunged to 48.6 from 53.5. Europe remains mired in recession and is buying fewer US-goods. In the first three months of this year, US- exports to Europe fell -8% compared with the same period a year ago. Despite the negative news, the Dow Jones Industrials soared to the 15,300-level, as traders reckoned the Fed would utilize it as an excuse to continue to print $85-billion per month of high octane liquidity.

BIS warns Bondholdersprepare for further losses, - However, Stephen Cecchetti, head of the BIS monetary and economic department, issued a warning to bankers and wealthy investors to prepare for an eventual normalization of interest rates that would cause additional losses for bond holders. “The losses, when they do occur, will be spread across banks, households and industrial firms.” He stressed it’s important that banks make sure their finances are strong enough before central banks end their QE programs and start raising interest rates. “Robust balance sheets with high capital buffers are the best ways to guard against the possible disruptions that this can bring,” he said.

On May 22nd, Bank of Korea Governor Kim Choong Soo also warned that when the Fed pullbacks from QE, it would spur risks worldwide from rising bond yields. “If the Fed begins to exit from quantitative easing policies, the world will be facing interest-rate risks, in terms of how much would bond yields rise,” he said. Also, IMF economists warned in May that a “potential sharp rise in long-term interest rates could prove difficult to control.”

Thus, while Goldman Sachs might be proven correct, and that another upward leg for the 51-month old Bull market still lies ahead, in the humble opinion of the Global Money Trends newsletter, it’s best to heed the advice of the legendary trader, Bernard Baruch, I'll give you the bottom 10% and the top 10% of any move, if I get to keep the middle 80%.” In other words, for “Buy-and-Hold” investors, it’s a better strategy is to take advantage of any possible rally in the US-stock market to lighten up on long positions, rather than to add any new long positions at the tail end of a bubble.

See the original article >>

A Summer Stock Market Crash Scenario

By: Clif_Droke

Despite the recent weakness, the broad market has displayed a fair amount of resilience in the face of rising interest rates and falling commodity prices. The charts even leave us with some hope that there will be one more rally to new highs in the coming weeks. But a growing list of problems also suggests the market could be setting up for a repeat of the 1998 mini-crash later this summer.


There are several parallels between now and the spring and summer of 1998 which led to the July-October decline. The year 1998 was an exceptionally strong one for U.S. equities for the first half of the year; that year also witnessed a strengthening domestic economy. Like this year, however, 1998 saw trouble begin overseas with global weakness reflected by falling commodity prices.

Another point of concern for the market this summer is the global financial sector. While U.S. banks are doing well due to improving balance sheets, foreign banks are lagging. The comparison between the SPDR International Financial Sector ETF (IPF, black line) and the Philly Bank Index (BKX, yellow line) illustrates this point.

As go the banks, so goes the broad market is the old saying. This applies to foreign banks as well, for as we’ve experienced many times in the past, weakness in foreign markets sooner or later always spills over into U.S. equities, a’ la 1998.


The U.S. stock market sell-off of ’98 was also preceded by late spring weakness in the Chinese stock market. In June the Shanghai Composite Index topped out several weeks ahead of the Dow Jones Industrial Average and began a decline which continued until August. China’s stock market bottomed several weeks before the U.S. indices, once again affirming the leading indicator relationship that has typically existed between U.S. and Chinese equities.

This time around the China ETF (FXI) is showing exceptional weakness versus the Dow and S&P 500 indices. FXI has established a series of lower highs against the higher highs in the Dow and S&P. This could be warning of another coming period of weakness ahead later this summer.


Commodity price weakness was another thing that led to the late summer sell-off in 1998. Several major commodities, including oil and gold, were in declining heading into the summer of ’98 and the decline in commodities can’t be overestimated. Falling commodities prices are a sign of deflationary pressures, which in this case are being brought on by the 120-year cycle being in its final descending stage into 2014.


Low gold prices in particular are a sign that the market doesn’t have any inflation expectations for the economy in the foreseeable future. Moreover, with a highly touted housing market recovery underway it’s unusual to see lumber prices showing this much weakness (see chart below).

Copper prices are another important barometer of global economic health and right now copper is hovering near a two-year low.

In the 2013 forecast edition of the report published in early January we examined the Kress cycle “echoes” for this year. We specifically looked at the 6-year, 10-year, 30-year and 60-year patterns for stock prices for clues as to what the coming year might unfold. In each of the aforementioned “echo” years – 2007, 2003, 1983 and 1953 – stocks experienced a rocky period in the June-August period, with July and August being especially rough. This suggests that the coming July-August period could also be a rough one.

See the original article >>

Follow Us