by Greg Harmon
Last week’s review of the macro market indicators suggested, as December began that the markets were still strong but getting a bit extended on longer timeframes. It looked for Gold ($GLD) to consolidate or continue lower in the downtrend while Crude Oil ($USO) was biased lower but also might consolidate. The US Dollar Index ($UUP) seemed content to move lower in the short term in the uptrend while US Treasuries ($TLT) were biased lower but nearing support. The Shanghai Composite ($SSEC) and Emerging Markets ($EEM) were biased to the upside with a chance of Emerging Markets running in place. Volatility ($VIX) looked to remain low and might drift higher keeping the bias higher for the equity index ETF’s $SPY, $IWM and $QQQ, but not as strong a breeze as has been blowing. Their charts showed the IWM the strongest and the QQQ not far behind but a bit extended while the SPY showed the most signs of a stall or pullback.
The week played out with Gold bouncing a lot but ending lower while Crude Oil not only found support but bounced higher hard. The US Dollar continued lower as did US Treasuries, now on support. The Shanghai Composite moved to the upside and Emerging Markets sank hard before a strong bounce to tend the week. Volatility pushed higher but then reversed to end the week near unchanged. The Equity Index ETF’s started the week lower before moving back higher with the SPY and IWM reclaiming most of the down move and the QQQ finishing at new 13 year highs. What does this mean for the coming week? Lets look at some charts.
As always you can see details of individual charts and more on my StockTwits feed and on chartly.)
SPY Daily, $SPY 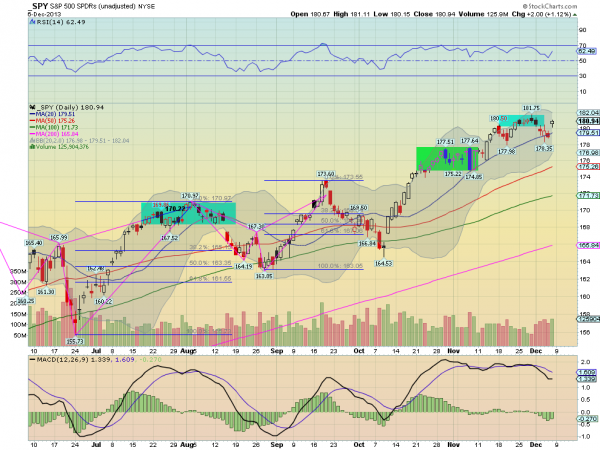
SPY Weekly, $SPY 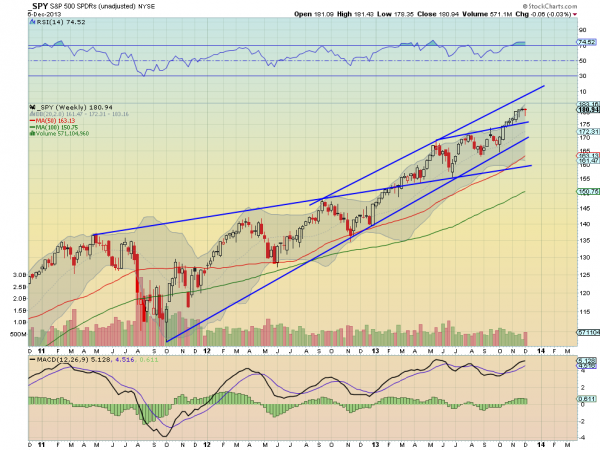
The SPY pulled back as the charts last week suggested it could, finding support at the 20 day SMA. After the non-farm payroll report Friday it gapped higher and held, closing near the top of the day’s range and back in the previous consolidation range. On the pullback, the RSI held above 50 and to the close observer, made a lower low without the price making a lower low. This sets up a RSI Positive Reversal with a target of 182.12. The MACD stopped falling as well and is moving sideways. These support more upside and would be stronger if the MACD started to rise. The weekly chart shows another narrow body topping candle, a Hanging Man. It needs confirmation for a reversal lower. Technically it confirms last week’s Doji lower, but I am not going to call it short for a week 6 cents lower. The RSI on this timeframe remains technically overbought, but with it moving sideways not showing any real strain. The MACD is still rising, supporting the upside. There is resistance at 181.75 and that RSI Positive Reversal target at 182.12 before 187.50. Support lower may be found at 180.40 and 178.5 before 177.50 and 175. Continued Cautious Upward Bias.
Heading into the next week the equity markets look positive but extended on the longer timeframes. Look for Gold to continue lower or consolidate while Crude Oil remains biased higher. The US Dollar Index looks to resume the downward path along with US Treasuries, especially if they break support are biased lower. The Shanghai Composite looks strong while Emerging Markets carry a neutral bias for the week. Volatility looks to remain subdued keeping the bias higher for the equity index ETF’s SPY, IWM and QQQ, with a move lower looking for new all-time highs in the indexes again. The index ETF’s remain biased higher but with caution. The QQQ is the most extended on the weekly time frame with the SPY next and the IWM the least worrisome. Use this information as you prepare for the coming week and trad’em well.
No comments:
Post a Comment