By: Frank_Holmes
I often talk about how the gold trade is really two separate trades. There’s the Fear Trade that buys gold out of fear of war or poor government policies. This crowd sees the precious metal as a safe haven during times of crisis, such as when gold rose over the fear of a war in Syria, but eased when a much more limited military action became likely.
However, there were other factors beyond Syria driving gold. That’s the Love Trade. This group gives gold as gifts for loved ones during important holidays and festivals.
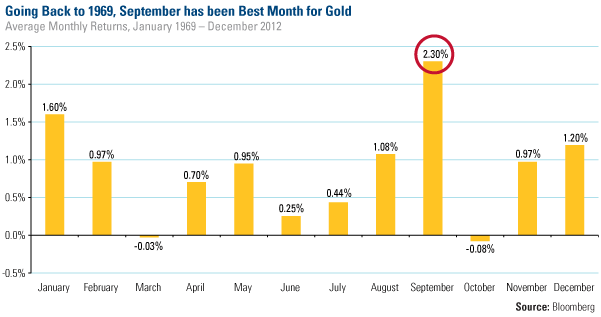
This is the time of the year that we are in the midst of right now. Historically, September has been gold’s best month of the year. Looking at more than four decades of monthly returns, the precious metal has seen its biggest increase this month, averaging 2.3 percent.

Indians will be getting ready for their wedding season that begins in October followed by the five-day Hindu festival of lights, Diwali, which is India’s biggest and most important holiday of the year. In December, millions of people will be gathering with loved ones to exchange gifts as they observe Christmas. And finally, millions will celebrate Chinese New Year at the end of January 2014.
In India, there’s also the harvest season to consider, as its crop production relies on rainfall for water.
One positive driver for gold this year is the fact that the country has had a heavy monsoon. The rains that started in June covered most of India at the fastest pace in more than 50 years. About 70 percent of the annual rainfall in India happens from June to September, and a strong monsoon season usually means a bumper crop, which boosts farmers’ incomes.
That could increase gold buying as well, negating the government’s efforts to quell India’s gold-buying habit. Historically, good monsoon seasons have been associated with strong gold demand. “In 2010, the last year that rains were heavily above average, demand soared 37 percent in the fourth quarter after harvests,” says Reuters.
In the rural areas of India, there is little access to banking networks, so gold is used as a store of wealth, says Reuters. And with half the population in India employed in agriculture, it’s no surprise that 60 percent of all the gold demand in the country comes from these rural areas.
India’s rural community has seen a “hefty rise” in income this year, reports Mineweb. But instead of buying gold, Mineweb says Indian farmers may purchase land due to gold in local currency reaching “dizzying heights.”
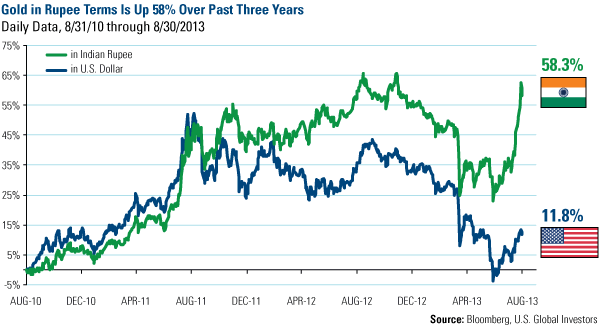
Particularly over the past few weeks, as the currency faced increasing weakness, gold in rupee spiked. Over the past three years, gold is now up 58 percent compared to gold in the U.S. dollar, which rose nearly 12 percent. 
Despite this possible short-term threat to gold demand, keep in mind the East’s long-term sentiment toward the metal, as this area of the world has a different relationship related to both the Love Trade and the Fear Trade. And it’s not easily broken.
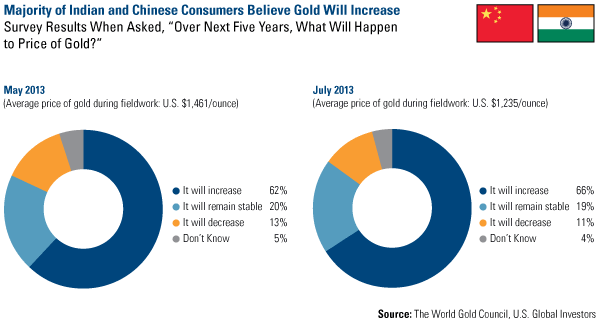
You can see this encouraging sentiment in the chart below, as people in China and India have a “particular positivity around longer-term expectations for the gold price,” according to the World Gold Council (WGC).
In May and July, the WGC asked 1,000 Indian and 1,000 Chinese consumers where they think the price of gold will be in five years. The two charts show the respondents’ answers in May, when the average price of gold was about $1,400, and again in July, when the average price of gold was $1,200 an ounce. 
Overwhelmingly, consumers in India and China believe the price of gold will increase over the long-term.
What’s interesting is when you compare the responses between May to July, there’s an “extremely resilient sentiment around the future trajectory of gold,” says the WGC. In May, 62 percent assumed gold would increase; in July, the number increased to 66 percent.  The survey also shows that there are not too many gold bears in the East. Only 11 percent of those who responded in July think the price will decrease.
Are you a gold bull or bear?
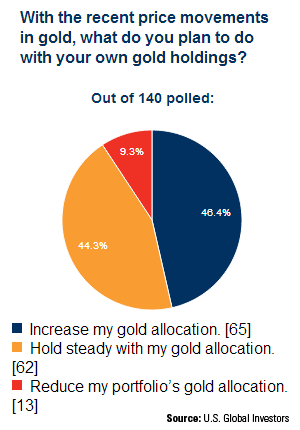
Where do you think gold is headed? We asked people what they planned to do with their own gold holdings because of the recent price moves in gold over the past several weeks. Take a look at the results.
The decision to hold tight compared to those who wanted to increase their allocation to gold was nearly the same.
What’s amazing is that only 9 percent felt the need to decrease their allocation.
What’s your take? Take part in our Gold Portfolio Poll and weigh in.
Want to see more on commodities or emerging markets? Provide us with your email address and you’ll receive a note every time Frank Holmes updates his blog. You can also follow U.S. Global on Twitter or Facebook.
By Frank Holmes
CEO and Chief Investment Officer
U.S. Global Investors
U.S. Global Investors, Inc. is an investment management firm specializing in gold, natural resources, emerging markets and global infrastructure opportunities around the world. The company, headquartered in San Antonio, Texas, manages 13 no-load mutual funds in the U.S. Global Investors fund family, as well as funds for international clients.
All opinions expressed and data provided are subject to change without notice. Some of these opinions may not be appropriate to every investor.Standard deviation is a measure of the dispersion of a set of data from its mean. The more spread apart the data, the higher the deviation. Standard deviation is also known as historical volatility. All opinions expressed and data provided are subject to change without notice. Some of these opinions may not be appropriate to every investor. The S&P 500 Stock Index is a widely recognized capitalization-weighted index of 500 common stock prices in U.S. companies. The NYSE Arca Gold BUGS (Basket of Unhedged Gold Stocks) Index (HUI) is a modified equal dollar weighted index of companies involved in gold mining. The HUI Index was designed to provide significant exposure to near term movements in gold prices by including companies that do not hedge their gold production beyond 1.5 years. The MSCI Emerging Markets Index is a free float-adjusted market capitalization index that is designed to measure equity market performance in the global emerging markets. The U.S. Trade Weighted Dollar Index provides a general indication of the international value of the U.S. dollar.
No comments:
Post a Comment