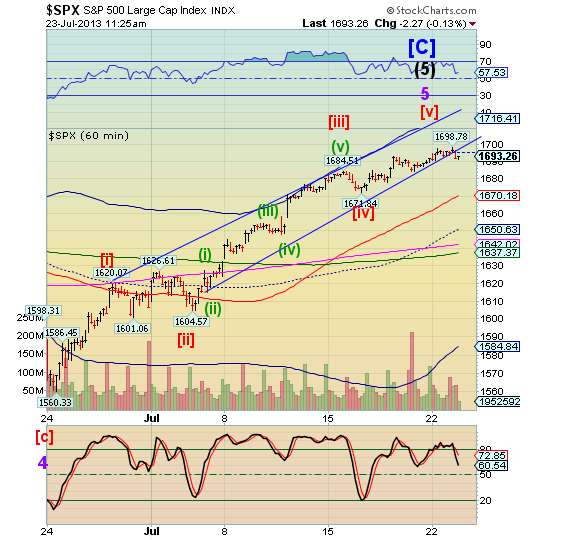
The hourly SPX chart now shows the lower trendline of the Ending Diagonal is broken. This is the earliest and best warning. We may see the SPX drop to or below the hourly Cycle Bottom at 1584.84 before a bounce occurs. The decline may take a couple days, but it should wipe out the entire month-long rally.
From ZeroHedge, Thanks to a total and utter collapse in new order volume (from +9 to -15 - worst in 2 years) and order backlog (-1 to -24), the Richmond Fed manufacturing survey just printed at -11 (against expectations of an exuberant +8). This is the biggest miss since May 2006. Wages plunged; the average work-week plunged; capacity utlization plunged; but on the bright-side, the number of employees was flat (at 0). Perhaps more concerning is the outlook that sees prices paid rising notably more than prices received and capacity ultization dropping notably.
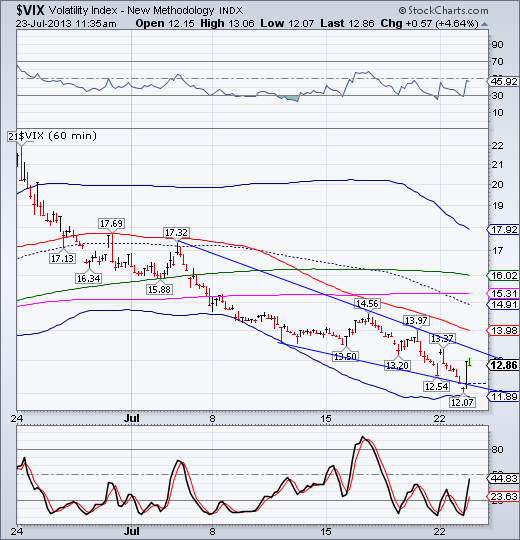
VIX made a very slight throw-under beneath its lower trendline and made an unmistakable reversal. The upper trendline is at 13.50, which will confirm the change in trend. VIX just completed a 243-day Master Cycle B. However, it went 130 days in Master Cycle A, just beyond the half-cycle turn which usually falls between days 120 and 129. The VIX cycles, which had been out-of-sync with one another, are getting back in sync. By the looks of things, we may expect to see VIX peak out by mid-November.
No comments:
Post a Comment