By: P_Radomski_CFA
The most important Wednesday’s event was Ben Bernanke‘s testimony. The Fed Chairman said the U.S. central bank still expects to start scaling back bond purchases later in the year, but left open the option of changing that plan if needed.
We all know that every action has a reaction. Yesterday gold rallied and climbed to a three-week high at $1,300 per ounce after Bernanke's remarks. This optimism didn’t last long. The yellow metal gave up the gains as the dollar remained strong and dropped slightly above $1,270 later in the day.
"Yesterday, gold was unable to convincingly break above $1,300 and some took this as a sign of weakness," Commerzbank analyst Eugen Weinberg said. "We don't expect any strong increase in the short time," he added.
Does it mean that we see may further declines in the yellow metal? If gold moves lower, it may trigger a move down in mining stocks. How low can they go? Let’s examine the situation in the charts (charts courtesy by http://stockcharts.com.)
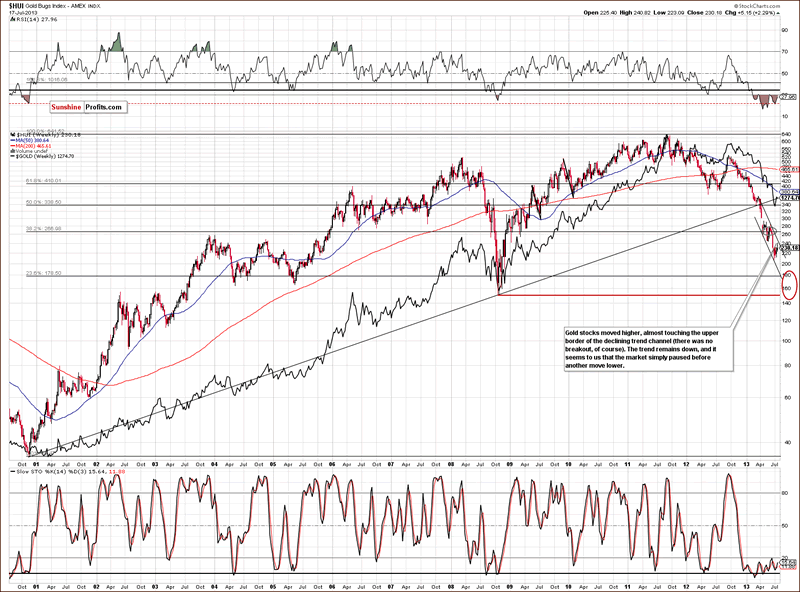
At the beginning let’s take a look at the gold stocks index – the HUI.

In this week’s very long-term HUI index chart (a proxy for the gold stocks) we see that miners finally moved close to the upper border of the declining trend channel. Soon after that, they declined once again (it happened yesterday) and could be that the correction to the upside is already behind us.
The trend remains down, and another decline is likely before the final bottom is formed.
Where will it form? In our opinion, close to or slightly above the 2008 low as indicated in the above chart by the red ellipse (which also includes the 61.8% Fibonacci retracement level).
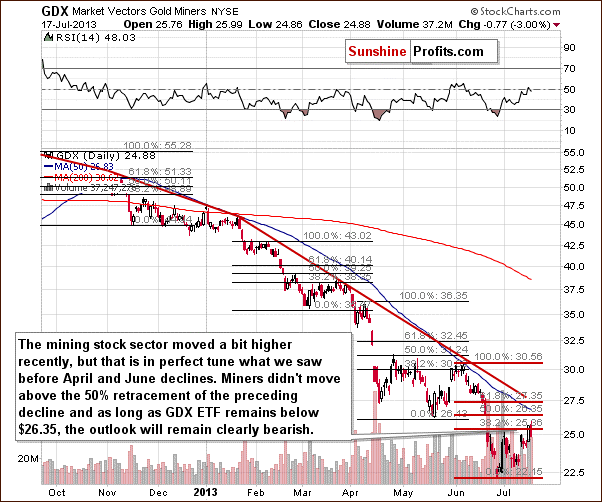
Once we know the current situation in the HUI index let’s take a look at the GDX ETF chart. Does it confirm the bearish outlook?

In this medium-term GDX ETF chart, we continue to see an analogy to the previous price patterns. The corrective ABC or zig-zag price pattern was previously followed by a period of declines. On each occasion, the GDX ETF did not move to the 50% Fibonacci retracement level. It declined after getting to or slightly above the 38.2% level. This same type of move was seen on Wednesday, and prices then declined. They seem ready to decline once again.
Furthermore, the volume levels on Wednesday being significant on a move to the downside suggest that it may be the start of bigger declines. The RSI level is close to 50, a level previously seen when the miners formed a local top.
In the past, sharp declines were not seen immediately after local tops. Moderate moves to the downside were seen initially and then – after a few days of moderate declines – we saw a period of accelerated declines.
Before we summarize, we would like to present you two interesting ratios: the gold-stocks-to-gold ratio and the ratio of the HUI Gold Bugs Index to the S&P 500.
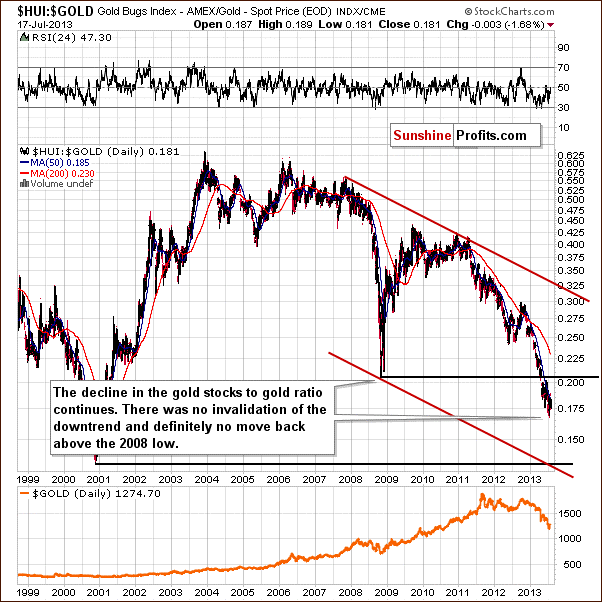
Let’s start with the HUI-to-gold ratio. After all, gold stocks used to lead gold both higher and lower for years.

In the gold-stocks-to-gold ratio chart, we didn’t see a real improvement in the situation this week. Although the HUI-to-gold ratio moved higher on Tuesday, this move was barely visible from the long-term perspective. That was just a blip on the radar screen, just like when miners rallied relative to gold in the previous months.
Besides, when we look at the above chart, we clearly see that the HUI:gold ratio remains below the 50-day moving average, a level which has served as approximate resistance for the past month.
Therefore, in our view the downtrend is still valid and the implications remain bearish.
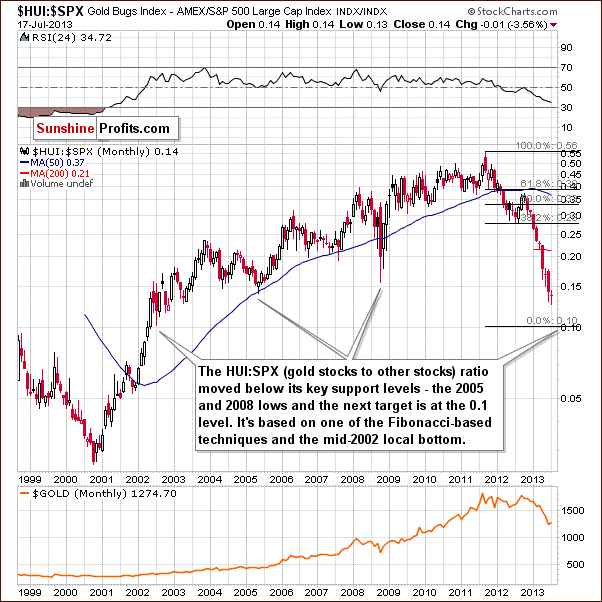
Now, let’s find out how the HUI is doing compared to the stock markets.

In this very long-term gold-stocks-to-other-stocks ratio we have seen a breakdown below the important support level created by the bottoms of 2005 and 2008. The ratio has been clearly below this level for several weeks now so the breakdown is confirmed.
The next support line is all the way down at the 0.1 level so it seems that further significant declines are likely before the final bottom is reached here. This target level is created by (applying Fibonacci techniques) extrapolating previous declines by the Fibonacci transformation of the Phi number (1.618) . It coincides with the local bottom seen in the middle of 2002.
This chart confirms what we’ve seen in other charts: the bottom is not in yet, another big drop is likely ahead, but the majority of the declines are probably behind us.
Summing up, the outlook for mining stocks remains bearish. Miners are still in a downtrend and it seems that the next move lower will probably be the one to take miners to their final bottom.
No comments:
Post a Comment