By: Tony_Caldaro
This past holiday shortened week can best be described as choppy until late friday. The SPX started the week at 1650, rallied to 1674, dropped to 1640, rallied to 1662, and ended at 1631. For the week the SPX/DOW were -1.15%, the NDX/NAZ were -0.20%, and the DJ World index was -1.20%. Economic reports remained positively biased with six rising, four declining, and two unchanged. On the uptick: Case-Shiller, pending home sales, consumer confidence/sentiment, the Chicago PMI, and the monetary base. On the downtick: Q1 GDP, personal spending, the WLEI and weekly jobless claims rose. Unchanged were personal income and the PCE. Next week, a busy one, we have the monthly Jobs report, ISM and the FED’s beige book.
LONG TERM: bull market
The Secular cycles, we track, in various asset classes continue to unfold as expected. Long term interest rates completed their 30+ year decline in 2012, and are now on the rise. Commodities completed their 10+ year rise in 2011, and have been declining. Foreign currencies completed their 20+ year rise in 2011, and are declining as well. The stock market, however, should remain in its deflationary Secular cycle until around 2016. After that a very explosive Secular growth cycle begins. As interest rates begin to normalize, commodities enter a decade long trading range, and the USD peaks soon after. Until then the stock market remains somewhat range bound, as it has since the year 2000.
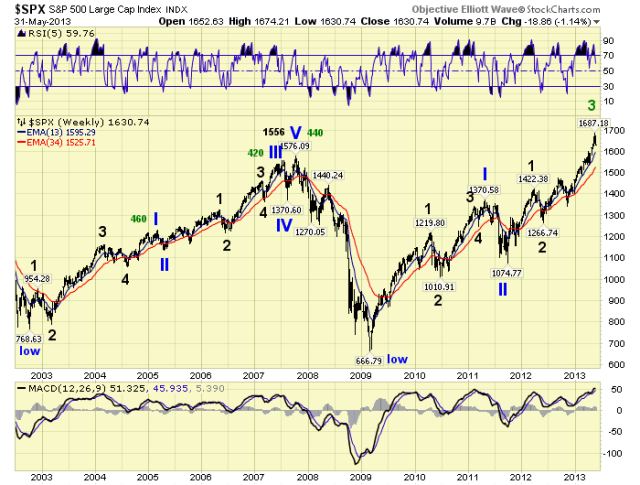
In this phase of the Secular cycle: the bull market from the March 2009 low continues to unfold. This Cycle wave [1] advance is comprised of five Primary waves. Primary waves I and II completed in 2011, and Primary III has been underway since then. Primary I divided into five Major waves, with a subdividing Major wave 1. Primary III is also dividing into five Major waves, but both Major 1 and 3 are subdividing. The above chart displays the Primary and Major waves, without the subdivisions. The below chart, with the subdivisions.
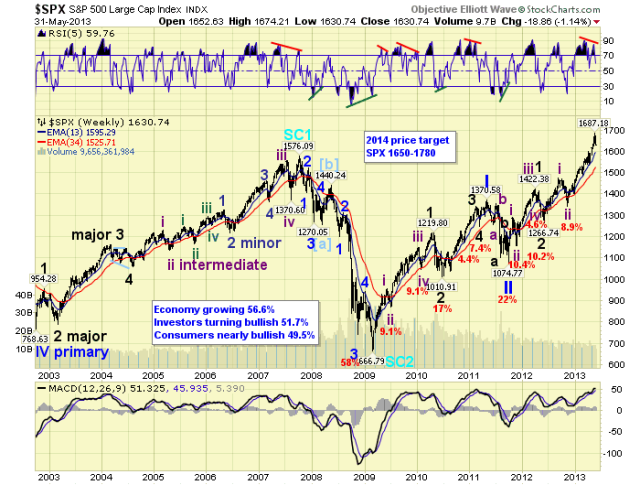
Major waves 1 and 2 of Primary III completed by mid-2012, Major wave 3 has been underway since then. Intermediate waves i and ii, the subdivisions, completed by late-2012, and Intermediate wave iii has been underway since then. This market still needs to complete Intermediate waves iii, iv and v to complete Major 3. Then after a Major 4 correction, Major 5 will complete Primary III. Finally, after a Primary IV correction, Primary V will complete the bull market. Our upside target for the bull market remains in the SPX 1650-1780 range, by late-winter to early-spring 2014. Since the SPX has already reached 1687, this range may need an upward adjustment in the coming months.
MEDIUM TERM: downtrend probable
The current/recent Intermediate wave iii uptrend began in mid-November at SPX 1343. A week ago it hit SPX 1687, making it one of the longest uptrends, in time, for this bull market. And, the strongest uptrend in points for the bull market.
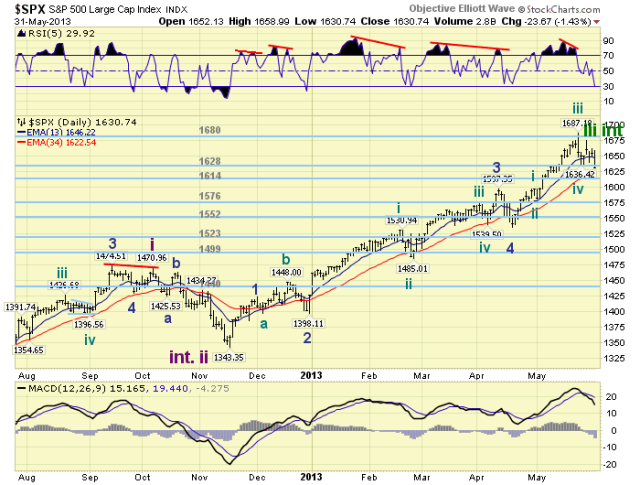
We have been counting this uptrend unfolding in five Minor waves: wave 1 SPX 1424, wave 2 SPX 1398, wave 3 SPX 1597, wave 4 SPX 1536, and wave 5 possibly ending at SPX 1687. Entering this past week, our OEW group had one count suggesting the uptrend ended at SPX 1687, and another suggesting one more rally to go. I went with the latter count using SPX 1636 as the deciding factor. The market did rally on Tuesday. The SPX fell 13 points shy of its high, but the DOW was only 22 points shy of its uptrend high. That was apparently the last rally for this uptrend, as the market started to breakdown Friday afternoon. Nearing the close the SPX dropped below 1636 and ended the week at 1631. We could count this last rally as a failed fifth wave, or just accept the actual high as the end of the uptrend. There are short term counts to fit both. Either way the SPX has now declined 56 points from the 1687 high, or 3.3%, and the expected correction is probably only in its early stages.
Looking ahead. We would expect an Intermediate wave iv correction to last about one month: until June. Since Minor wave 5 was stronger than Minor 1, support should arrive around Minor wave 4: SPX 1536. Right around this level is also Minute iv of Minor 3 at SPX 1540, and Micro 4 of Minute iii at SPX 1539. This level provided support for the uptrend for more than one month. This level also fits between the OEW 1523 pivot and the 1552 pivot. As a result we can broaden the support range for Int. iv to: the 1523 pivot, SPX 1536-1540, and the 1552 pivot. On average then, we are looking at about an 8% – 9% decline. The previous three strongest uptrends and two longest uptrends, of this bull market, corrected between 7.4% and 9.1%. Medium term support is currently at the 1628 and 1614 pivots, with resistance at the 1680 and 1699 pivots.
SHORT TERM
Short term support is at the 1628 and 1614 pivots, with resistance at SPX 1658-1667 and the 1680 pivot. Short term momentum ended the week extremely oversold. The short term OEW charts are negative with the reversal level now SPX 1653.
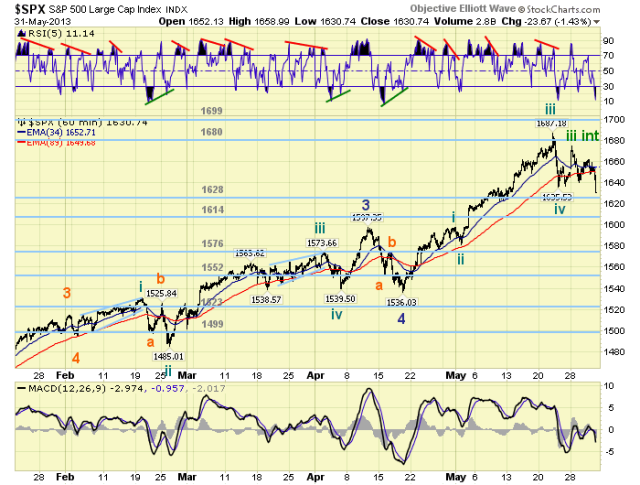
We have been counting this last rally, Minor 5, with five Minute waves: wave 1 SPX 1598, wave 2 SPX 1581, wave 3 SPX 1687, wave 4 SPX 1636, and wave 5 SPX 1674 (failure). Another count would suggest: wave 3 SPX 1673, wave 4 SPX 1663 and wave 5 SPX 1687. Wave 4 under this second count looked too short for a Minute iv wave. Either way, it does now appear an Intermediate wave iv correction is underway.
If it is indeed a fifth wave failure, we would expect the first decline to be quite substantial. Then after a small counter-rally, the next decline could form a flat to alternate with the Intermediate wave ii zigzag during Oct12-Nov12. Thus far the market has declined to 1640, rallied to 1662, and declined again: 1648-1659-1631. These last three waves all occurred on Friday. The OEW 1628 pivot range should provide the first support, then the 1614 pivot range. Once the latter one breaks there is little support until the 1576 pivot. Which is followed by the 1552 pivot. So the 1614 pivot could be key to the speed of the first decline. After this probable downtrend concludes, likely in June, the market should enter an Intermediate wave v uptrend to new all time highs. There is still three more uptrends in this bull market before it concludes. Best to your trading/investing!
FOREIGN MARKETS
The Asian markets were quite mixed losing 1.3% on the week. Australia, Hong Kong, Japan and Singapore are close to confirming a downtrend.
The European markets were also mixed losing 0.3% on the week. Spain and Switzerland are close to confirming a downtrend.
The Commodity equity group were all lower losing 3.3% on the week. Brazil and Russia are close to confirming a downtrend.
The DJ World index is close to confirming a downtrend and lost 1.2% on the week.
COMMODITIES
Bonds lost 0.7% on the week as their downtrend continues.
Crude lost 2.3% on the week. It appears to have been in an uptrend that can easily reverse back into a downtrend.
Gold gained 0.2% on the week, and also appears to be in an uptrend that can easily reverse.
The uptrending USD lost 0.5% on the week.
NEXT WEEK
A busy economic calendar ahead for next week. Monday: ISM manufacturing and Construction spending at 10:00, then monthly Auto sales. Tuesday: the Trade deficit. Wednesday: the ADP index, Factory orders, ISM services, and the FED’s beige book. Thursday: weekly Jobless claims. Friday: the monthly Payrolls report and Consumer credit. The FED is quite active too. On sunday speeches from FED chairman Bernanke in Princeton NJ, and vice chair Yellen in Shanghai, China. Thursday a speech from FED governor Raskin in Columbus, Ohio. It should be quite a week. Best to you and yours this weekend and the week ahead!
No comments:
Post a Comment