by Greg Harmon
Last week’s review of the macro market indicators suggested, heading into June that the markets looked ready to take a breather and perhaps pullback. Gold ($GLD) though was biased higher in the short term in its downtrend while Crude Oil ($USO) headed toward the bottom of its range. The US Dollar Index ($UUP) and US Treasuries ($TLT) both looked to continue lower. The Shanghai Composite ($SSEC) maintained an upward bias but might consolidate first while Emerging Markets ($EEM) continued biased to the downside. Volatility ($VIX) looked to remain low but drifting higher keeping the long term bias higher for the equity index ETF’s $SPY, $IWM and $QQQ, but maybe a drag on them in the short run. The index ETF’s themselves appeared to be weakening in their uptrends with the SPY the weakest followed by the IWM and the QQQ still showing some strength in longer charts.
The week played out with Gold running sideways mainly before a dip Friday while Crude Oil rose from the bottom of the range. The US Dollar continued lower while Treasuries consolidated at the lows. The Shanghai Composite broke lower while Emerging Markets showed signs it may be slowing its descent. Volatility continued higher before falling back to end the week. The Equity Index ETF’s started lower and continued downward moves, but all found support and reversed to end the week. What does this mean for the coming week? Lets look at some charts.
As always you can see details of individual charts and more on my StockTwits feed and on chartly.)
SPY Daily, $SPY 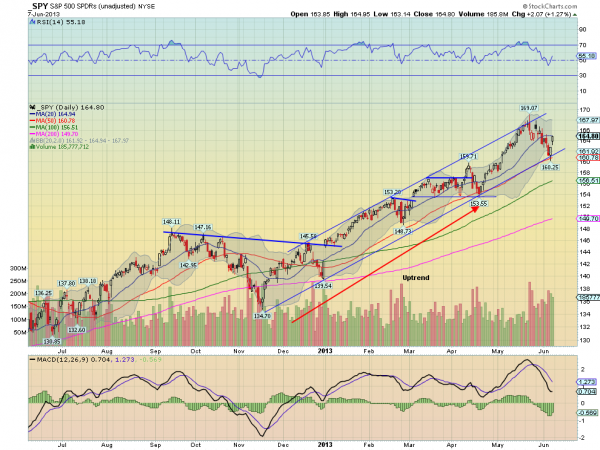
SPY Weekly, $SPY 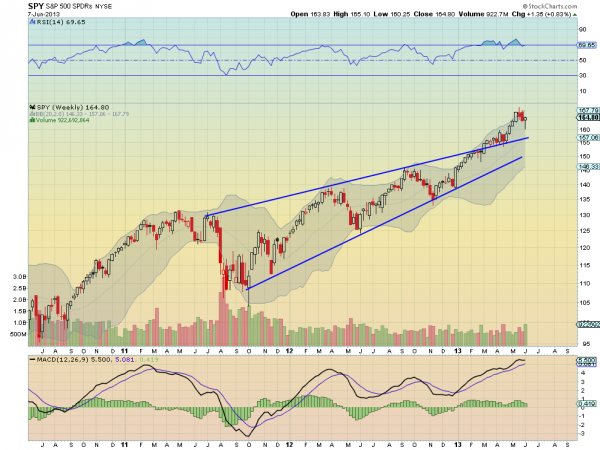
The SPY pulled back but found support at the rising trend from November and the 50 day Simple Moving Average (SMA). A bounce higher Friday confirmed the support and the Relative Strength Index (RSI) rebounded, never having turned bearish, while the Moving Average Co0nvergence Divergence indicator (MACD) is now improving on the histogram and flattening on the signal line. Things are looking brighter on the daily chart. A move over the 20 day SMA would seal the deal. Out on the weekly view there will likely be debate as to whether the candle is a Hanging Man, potentially signaling a top if confirmed lower, or a Hammer after a short pullback, if confirmed higher. It does not matter what you call it. The trend is higher until it is turns lower. The RSI is holding near the technically overbought level but running sideways while the MACD continues to climb. There is resistance at 166.50 and 167.50 followed by 169. There is also a Measured Move higher to 175.77, coinciding with the target of an elongated RSI Positive Reversal, and the possibility of a 3 Drives with a 138.2% extension to 182.69. This reversal is a big deal if it holds up. Support below comes at 163 and 161.40 followed by 159.70 and 157.10. Continued Uptrend.
Heading into next week the markets look to be in a better mood. Look for Gold to continue to consolidate or move lower while Crude Oil continues to rise. The US Dollar Index and US Treasuries are biased lower and looking ugly. The Shanghai Composite and Emerging Markets are biased to the downside as well. Volatility looks to remain subdued keeping the bias lower for the equity index ETF’s SPY, IWM and QQQ, and any move lower could trigger a strong equity buy signal. The Equity Index ETF’s themselves are poised to continue their trends higher with the QQQ the strongest followed by the IWM and then the SPY. Use this information as you prepare for the coming week and trad’em well.
No comments:
Post a Comment