by Greg Harmon
One measure of the direction of risk in the market place used by technicians is the ratio of high yield debt to Treasury debt ($JNK vs $TLT). The chart below shows how this dropped precipitously in 2011 and after a bounce through early 2012 has been moving steadily higher over the last year. And the Relative Strength Index (RSI) is rising in support of more upside. The ratio is approaching a triple whammy now though that could stop it in its tracks. First it is near the top
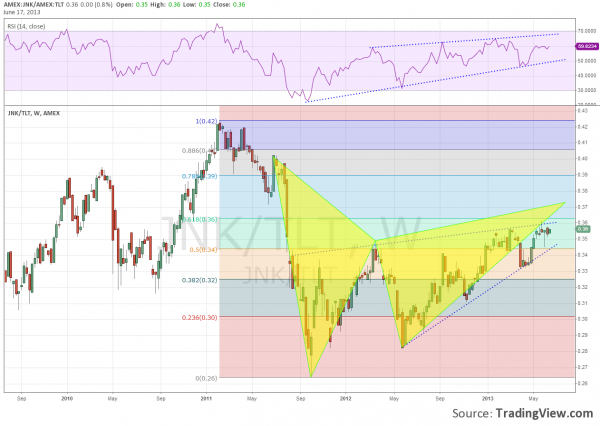
of the rising wedge at about 0.36. Second it is nearing the 61.8% Fibonacci retracement of the major move lower. Third it is near the Potential Reversal Zone (PRZ) of the bearish Gartley just over 0.37. How the ratio reacts here could set the course for the broad market. A break above all three converts the Gartley to a Crab with a PRZ all the way up at 0.49. That could be interpreted as very bullish. A failure though and move back below the wedge at about 0.345 establishes a target on the wedge breakdown to about 0.27, or all the way back to the lows of 2011. Like creeping to the entrance to the bear’s cave before turning and fleeing.
No comments:
Post a Comment