by Greg Harmon
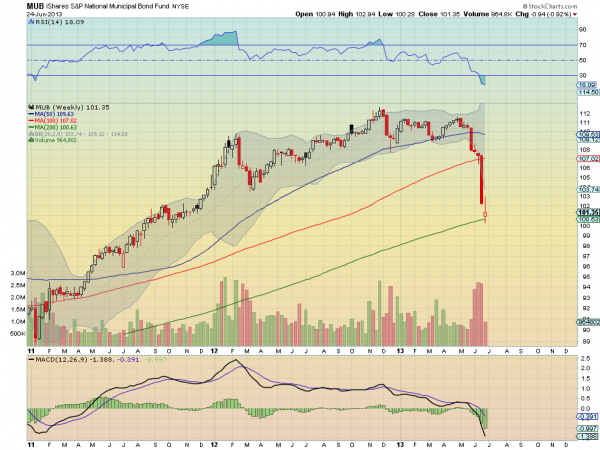
Back in late March I thought the Muni market was setting up for a pullback in Muni’s Have Had It….This Time For Real. It took its time to correct but did touch the 104.30 target, on the way to Monday’s low at 100.28. Quite a bit further than the expectation. With a more than parabolic fall, a Baumgartner fall, it is looking like the time to buy the bloody crash. Here are 6 reasons why in the daily chart. The Relative Strength Index (RSI) is under 13. It has been this low only 1 time before, just before the start of the run higher in December 2010. The Moving Average Convergence Divergence indicator (MACD) is at
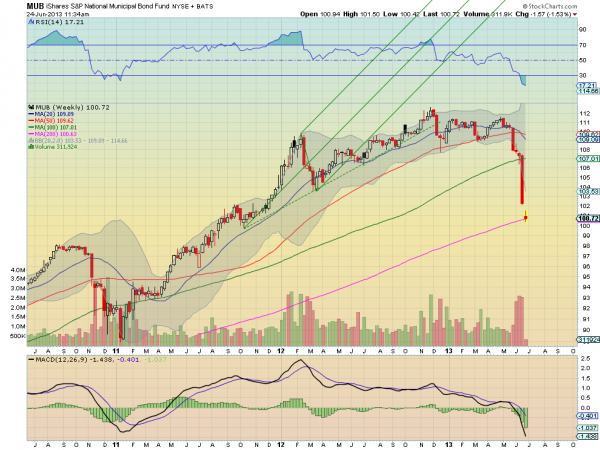
historic lows. Both of these may go lower but I have an idea for that. Next The price is more than 10% from its 50 day Simple Moving Average (SMA). It is also far outside of the lower Bollinger band. The volume is also spiking. Finally the Spinning Top candle shows indecision, often a reversal signal. If you need more convincing the RSI on the weekly chart is also in the teens and at all time lows as the price sits on the 200 week SMA with the MACD at extremes as well. You may notice that the previous low in the RSI did not mark the bottom but was very close. If this is a concern then you can start your position by selling the July 99 Puts for the first 1/3 of your position. These were offered at about $2.05 when I traded them at 2:00pm Monday.
No comments:
Post a Comment