Over the last several weeks I’ve received a lot of e-mails asking about gold. Half want to know if they can buy gold and/or gold stocks here, and the other half are demanding a pronouncement as to whether or not the bull market in gold is over. After all, if you hear it on Bloomberg from Betty Liu it must be true! Personally I don’t like it when the mainstream media tries to make the news instead of simply reporting the news. Unfortunately, we’ve been conditioned to let the media do our thinking for us and that includes everything from who should be President to which stock we should buy. Edward R. Murrow must be turning over in his grave as he stares down and listens to what passes for news today.
I want first to deal with the question as to whether or not the bull market in gold is alive and well. In order to answer that we need to look at an historical chart showing the entire move up:
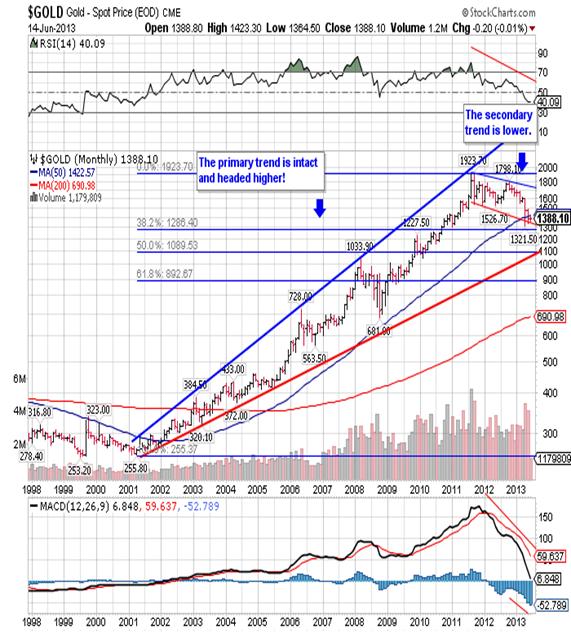
Here you can see that the primary trend remains intact in spite of the reaction (secondary trend) that has been going on since the September 6, 2011 all-time high of 1,923.70. Inversely that implies that the secondary trend has been declining for slightly more than twenty-one months, and that is the longest such decline since the bull market began way back in 1999. As it stands the reaction has retraced almost exactly 33.3% of the gains that go back to the aforementioned bottom.
The path and timing of the secondary trend is a bit more complicated. Here you have a closer look at the reaction:
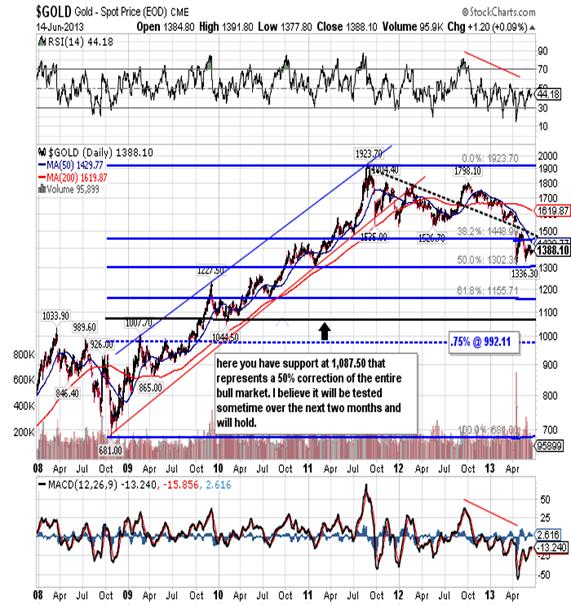
You can see the last leg up that ran from 681.00 to the 1,923.70 all-time high as well as the current reaction that has retraced close to 50% of that last leg. The questions that face us now are:
- Is the current reaction over and if not,
- At what price will the bottom occur, and
- When will the bottom occur?
I have been saying for more than two months that the 1,321.50 low posted on April 16th is not the low and we still have more downside to come. One very good reason is
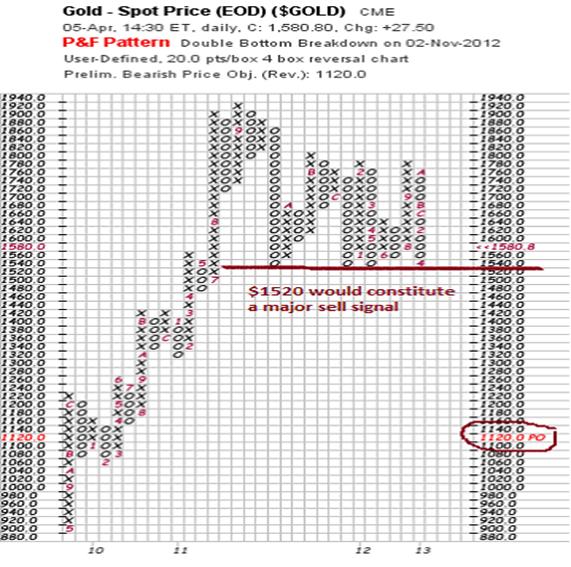
wrapped up in this chart. This is a Point & Figure chart of gold and it shows a huge vacuum between what was critical support at 1,520.10 and current support at 1,087.50. I honestly didn’t think the support at 1,520.10 could be broken, but once it fell I had to look at the vacuum and accept that gold could fall all the way down to the 1,087.50 support from a 50% retracement of the entire bull market.
Given all that I’ve said, I do recognize the possibility that gold could stop at the 1,302.30 support from a 50% retracement of the last leg down, but I doubt it. I think that void must be filled and I believe it will happen on or about the second anniversary of the September 6, 2011 all-time high. Significant tops and bottoms quite often occur on a 90-day increment and the two-year interval falls within that parameter. If in fact gold was going to a slightly lower low at 1,302.30 it would more than likely occur well before the September 6th date, so that’s another reason I see gold going down to 1,087.50, i.e. it fits the most likely time frame. Finally, if we assume that the reaction will end in September it also fits that we need to see significantly more than the current 33% retracement given all the time that’s passed. The 33% is just too shallow.
I want to close with a look at the anti-gold also known to most of you as the US dollar. The greenback has been grinding higher for almost two years and recently began a reaction as you can see below:
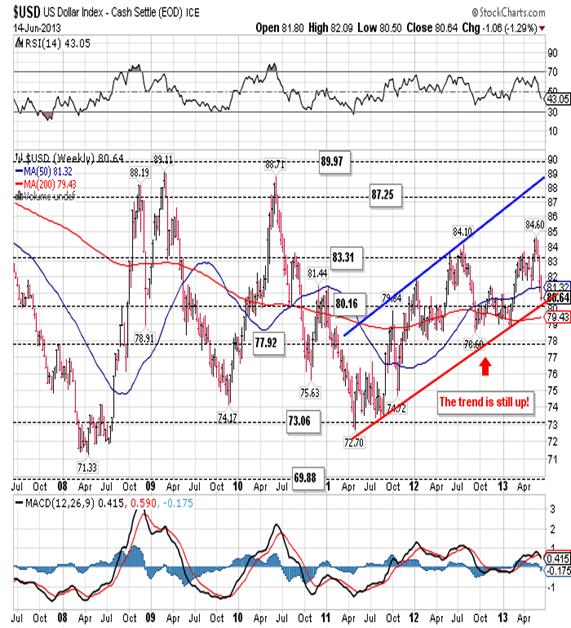
The reaction is now close to the support from the historical low at 80.16 and I am looking for a bounce and one last run higher before it fizzles for good. That top could come in anywhere from decent resistance at 85.17 (not shown) and strong resistance at 87.25. An early September bottom in gold gives all of that time to happen.
In conclusion, there is nothing wrong with gold. The bull market is intact and we are currently in the final phase of a reaction. Without a doubt the reaction has run longer and cut deeper than we would have liked and our patience has been exacerbated by greed and visions of golden trees growing to the sky! Another leg down to a lower low will only serve to squeeze out the last of the investors hanging on by their fingernails, and it will create a black as night atmosphere where absolutely no one wants to hear about gold. That of course is what a true bottom looks like and that’s when you should be buying. If you want to know when to buy simply watch for Bloomberg’s Betty Liu nailing the coffin shut on the last gold bull!
This Point & Figure chart is the work of Jon S. Strebler and was published in Richard Russell’s Dow Theory Letters on April 9th. In my opinion it was a brilliant insight that no one else saw coming.
No comments:
Post a Comment