by Greg Harmon
I have posted this chart of the S&P 500 before. The confluence of a 1.618*AB=CD pattern at 1678 and a 3 Drives pattern at 1654 gave a technical reason for a pullback. And we got it. Nearly a 61.8% retracement of the last leg higher to test and hold at the 50 day Simple Moving Average (SMA) not once but twice. Now adding a higher low. The 50, 100 and 200 day SMA are all moving higher still. The Relative Strength Index (RSI) pulled back slightly under the mid line, but has held its bullish territory. The Moving Average Convergence Divergence indicator (MACD) has moved much lower on the signal line
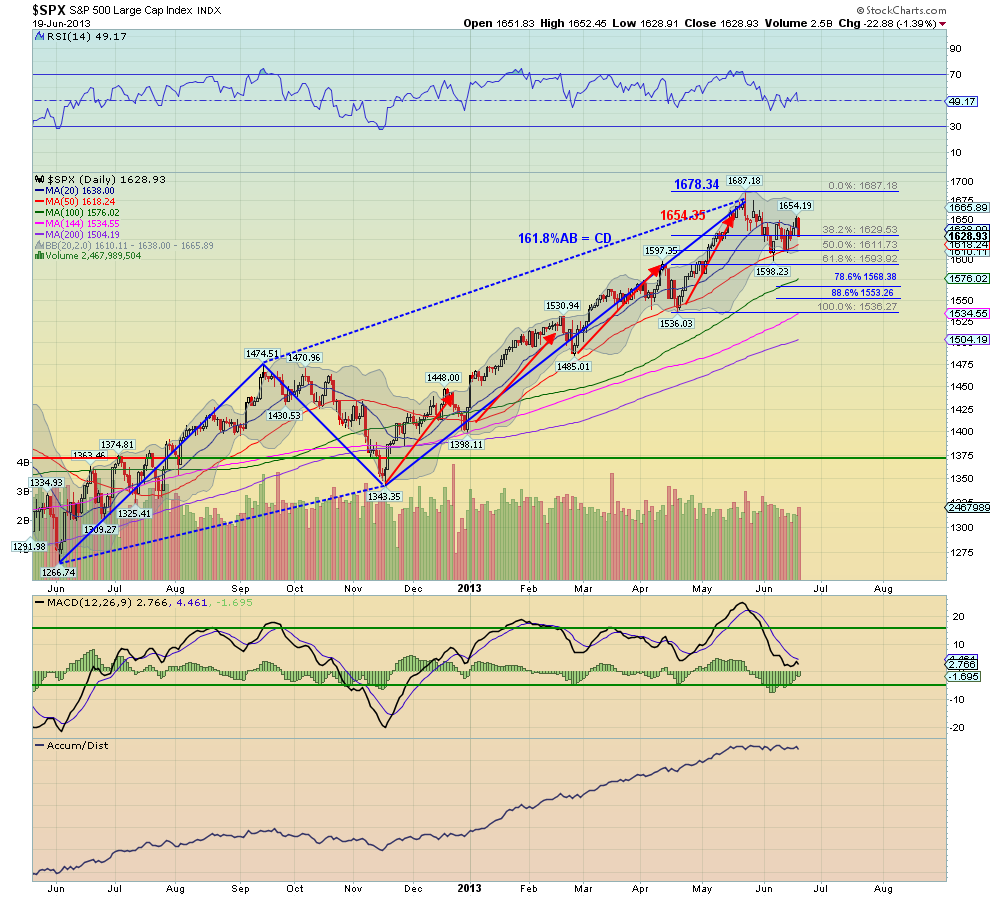
and is leveling with a histogram that is improving and nearly back to positive. These are signs of strength. That part of the set up has been there. What is new on this chart is the bottom panel, the accumulation/distribution. Through to the entire pullback there has been no distribution. No fall off in the statistic. Just sideways holding the level through out the entire pullback. If you want to short this market you may end up being right. But why not wait until all of these indicators are pointing the other way?
No comments:
Post a Comment