by Barry Ritholtz
Source: Moneybeat
I have been in the midst of a big research project that has led to me looking askance at the claims and long term returns of hedge funds.
It began with the research I did for Romancing Alpha, Forsaking Beta, and has led to other interesting places. But as we have learned, some things are not as they appear.
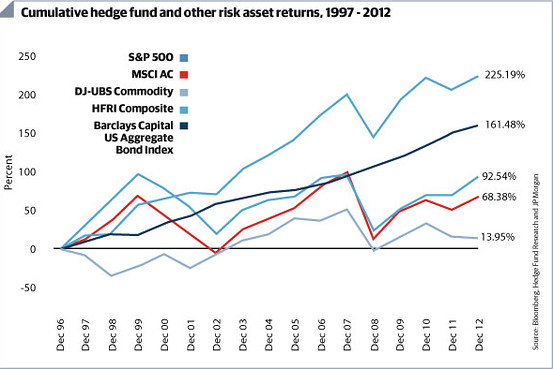
The chart above is a case in point
This is one of those return charts that looks impressive when you first see it, but once you delve deeper you learnt hat it is actively misleading.
It is a time weighted return series, and as such, shows the annual returns of managers regardless of assets under management (AUM).A more honest display would be an asset weighted return series.
Here is why: Imagine a manager who is up 10% every year for 9 years, then down 30% in year 10. You might think he is creating a lot of Alpha and net net has created a lot of wealth.
But having done some research, I now know quite a few things I did not last year:
1. The Hedge fund industry has swollen, from barely $100B to well over $2T from 1997 to 1012;
2. Hedge fund managers ability to create Alpha typically is inverse to their size;
3. The distribution of Alpha is nonGaussian (not a smooth bell curve)
4. In 2008, Hedge funds lost all of the profits they had previously made (and then some). Add in 2&20% and hedgies are a poor bet for most investors.
(Note: We haven’t even touched upon all of the errors that are on the Hedge fund index — survivorship bias, backfill problem, self reporting issues, etc.).
Which brings us back to our theoretical manager 10% for years with a 30% loss in year 10: Imagine he is a John Paulson like manager, who did really well until he hit the wall.
His best years were when the firm was small — up 10% when its a $50-$150 million fund. His gains are low millions, even 10s of millions. Then after a few big rounds of publicity, the funds he manages swell to several billion dollars. Down 30% wipes out all of the gains of the prior decade — and then some — in asset weighted series.
But in a time-wighted series, he looks pretty good. Its an epic fail, a colossally misleading returns .
Which is of course why so many managers love them!
No comments:
Post a Comment