by Greg Harmon
Last week’s review of the macro market indicators suggested, running into the Memorial Day Weekend that the equity markets continued to look strong but with the potential for rotation into the small caps noted the previous week still showing. It looked for Gold ($GLD) to continue the trend lower while Crude Oil ($USO) was biased higher in its neutral channel. The US Dollar Index ($UUP) was on the verge of a full blown bullish move higher while US Treasuries ($TLT) were biased lower. The Shanghai Composite ($SSEC) also looked to be ready to move back higher while Emerging Markets ($EEM) were biased to the downside as they consolidated. Volatility ($VIX) looked to remain a non factor and should be ignored until it breaks above 22 keeping the bias higher for the equity index ETF’s $SPY, $IWM and $QQQ, despite the moves to new highs. Their charts agreed although the SPY was showing the most signs of caution as the IWM and QQQ plow forward.
The week played out with Gold holding its ground while Crude Oil moved up early, only to pull back later in the week. The US Dollar consolidated higher while Treasuries did the same at their recent lows. The Shanghai Composite made a higher high before pulling back while Emerging Markets broke there consolidation lower. Volatility bounced off of the lows again but remained subdued. The Equity Index ETF’s made new all-time and closing highs on the SPY and IWM with multi-year highs on the QQQ before starting a pullback mid-week. What does this mean for the coming week? Lets look at some charts.
As always you can see details of individual charts and more on my StockTwits feed and on chartly.)
SPY Daily, $SPY 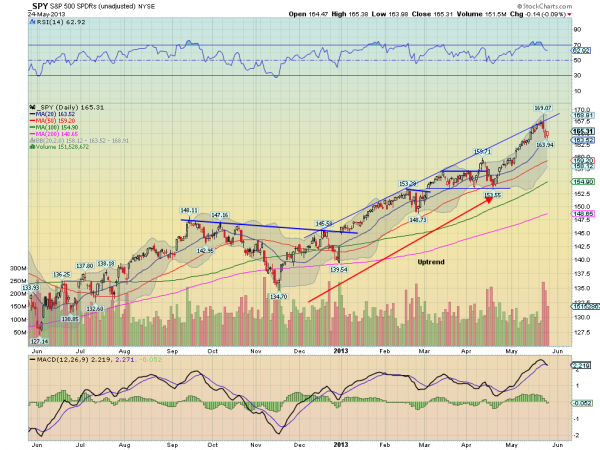
SPY Weekly, $SPY 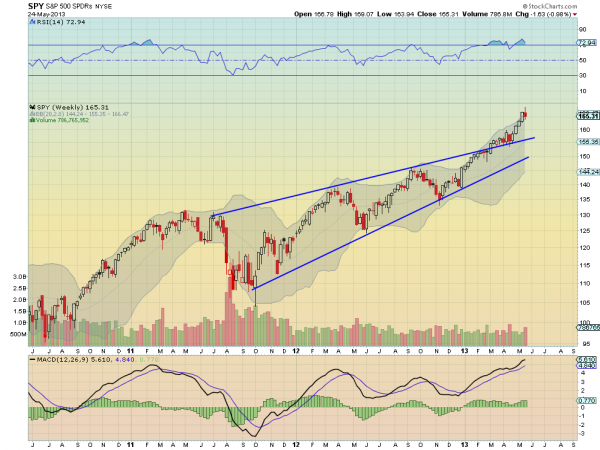
The SPY made new all-time highs Monday, Tuesday and Wednesday, before pulling back to end the week less than 1% lower. The pullback nearly made it to the 20 day SMA on the daily chart, and Thursday and Friday printed Hollow Red Candles. This two days of bullish intraday action (I posted on Hollow Red Candles Thursday night). The RSI on the daily chart is pulling back and the MACD is moving lower off a new high. These all bode for more downside price action. Notice that the volume is slowing again though. Out on the weekly chart the Evening Star is a potential reversal candle if confirmed lower next week. The RSI on this timeframe remains bullish and hovering around the technically overbought level. The MACD is continuing to rise. This timeframe looks higher still. There is support lower at 163 and 159.72 followed by 157 and 153.55. Under 153.55 and this turns bearish. Resistance is found at 166.50 and 167.50 followed by 169.07. Short Term Consolidation or Pullback in the Uptrend.
Heading into the shortened unofficial first week of Summer there is some nervous caution in the markets. Gold looks to consolidate with a downward bias while Crude Oil churns in the tightening range. The US Dollar Index seems ready for a pullback in the recent uptrend while US Treasuries are biased lower in their consolidation. The Shanghai Composite looks strong but Emerging Markets are biased to the downside. Volatility looks to remain benign keeping the bias higher for the equity index ETF’s SPY, IWM and QQQ, despite short term pullbacks and recent new highs. Their charts show more caution with a further pullback or consolidation likely. Use this information as you prepare for the coming week and trad’em well.
No comments:
Post a Comment