Sunday, August 7, 2011

ECB to buy Italian, Spanish bonds to stop contagion

By Sarah Marsh and Paul Taylor

The European Central Bank will intervene decisively on markets to protect Italy and Spain from an accelerating debt crisis, a monetary source said on Sunday, indicating it would buy government bonds of the euro zone's third and fourth biggest economies.

The agreement of the bank's policy-making Governing Council marked a watershed in the ECB's fire-fighting after modest bond buying efforts last week failed to stem contagion to the currency bloc's larger economies.

Officials on an ECB conference call carefully considered the situation in Italy and Spain, and took note of a statement by France and Germany on Sunday stressing their commitment to European financial reforms, the source said.

"The Euro system will intervene very significantly on markets and respond in a significant and cohesive way," the source said, adding the ECB would shortly issue a statement.

The move aims to help keep markets at bay after last Friday's U.S. debt downgrade added to the euro zone's sovereign debt crisis, until the bloc's own rescue fund can take over.

Germany and France earlier said in a statement that the EFSF bailout fund would soon be able to buy government bonds of debt strugglers Italy, Spain, Greece, Portugal and Ireland.

ECB President Jean-Claude Trichet had wanted the policy-setting Governing Council to take a final decision on buying Italian paper after Prime Minister Silvio Berlusconi announced new measures on Friday to speed up deficit reduction and hasten economic reforms, other euro zone sources said.

One said the council would also discuss possible emergency liquidity measures to prevent money markets freezing.

The Eurosystem comprises the ECB and national central banks of the 17 countries that share the euro single currency.

German Chancellor Angela Merkel and French President Nicolas Sarkozy said they were committed to getting approval from their parliaments for new powers for the European Financial Stability Facility rescue fund by the end of September.

That will allow the EFSF to buy government bonds in the secondary market if the ECB thinks it is warranted and if euro zone member states agree, potentially absolving the ECB of the need to do so, a policy that a powerful minority of its council members strongly oppose.

"France and Germany are confident that the ECB analysis will provide the appropriate basis for secondary market interventions as it will help determine the case when financial stability of the euro zone as a whole is at risk," the leaders said.

Their statement reiterated the agreement at last month's emergency euro zone summit which granted a second bailout to Greece, but the focus on the EFSF's ability to buy government bonds once the bloc's parliaments have ratified its new powers was meant to encourage the ECB to do the same in the interim.

Twin debt crises in Europe and the United States are causing global market turmoil and stoking fears of the rich world sliding back into recession.

Another source said the ECB meeting was put back into the evening to see what measures U.S. authorities were prepared to take to calm markets after credit ratings agency Standard & Poor's downgraded Washington's AAA rating to AA+ on Friday.

"The important part of the picture now is the U.S.," that source said.

G7 TO CONFER

Finance ministers of the Group of Seven major industrialized nations are to hold a teleconference late on Sunday (European time) to discuss a response to the crisis after senior officials conferred by telephone late on Saturday.

The ECB reactivated its controversial sovereign bond-buying programme last Thursday but only bought small quantities of Irish and Portuguese bonds, seeking more front-loaded austerity measures from Italy.
Italian and Spanish 10-year bond yields spiked to 14-year highs when investors saw the central bank was not buying their paper.

Under pressure from EU peers and the central bank, Berlusconi announced late on Friday plans to bring forward balancing the budget by one year to 2013, enshrine a balanced budget rule in the constitution and push through welfare and labor market reforms after talks with trade unions and employers.

Merkel and Sarkozy welcomed the new Italian plan.

"Especially the Italian authorities' goal to achieve a balanced budget a year earlier than previously envisaged is of fundamental importance," they said.

However, details of Italy's austerity drive are thin, leaving many analysts -- and maybe some in the ECB -- skeptical.

After a week that saw $2.5 trillion wiped off global stock markets, political leaders are under pressure to reassure investors that Western governments have both the will and ability to reduce their huge and growing public debt loads.

That had raised pressure on the ECB to act to calm bond markets until the euro zone's 440-billion-euro rescue fund is empowered to intervene on secondary bond markets and give countries in difficulty precautionary credit lines.

It has also prompted widespread calls from economists and market analysts for the euro zone to at least double the size of the European Financial Stability Facility -- a move that EU paymaster Germany and its close ally France has rejected as unnecessary.

The Second Great Contraction


Why is everyone still referring to the recent financial crisis as the “Great Recession”? The term, after all, is predicated on a dangerous misdiagnosis of the problems that confront the United States and other countries, leading to bad forecasts and bad policy.

The phrase “Great Recession” creates the impression that the economy is following the contours of a typical recession, only more severe – something like a really bad cold. That is why, throughout this downturn, forecasters and analysts who have tried to make analogies to past post-war US recessions have gotten it so wrong. Moreover, too many policymakers have relied on the belief that, at the end of the day, this is just a deep recession that can be subdued by a generous helping of conventional policy tools, whether fiscal policy or massive bailouts.

But the real problem is that the global economy is badly overleveraged, and there is no quick escape without a scheme to transfer wealth from creditors to debtors, either through defaults, financial repression, or inflation.
A more accurate, if less reassuring, term for the ongoing crisis is the “Second Great Contraction.” Carmen Reinhart and I proposed this moniker in our 2009 book This Time is Different, based on our diagnosis of the crisis as a typical deep financial crisis, not a typical deep recession. The first “Great Contraction” of course, was the Great Depression, as emphasized by Anna Schwarz and the late Milton Friedman. The contraction applies not only to output and employment, as in a normal recession, but to debt and credit, and the deleveraging that typically takes many years to complete.

Why argue about semantics? Well, imagine you have pneumonia, but you think it is only a bad cold. You could easily fail to take the right medicine, and you would certainly expect your life to return to normal much faster than is realistic.

In a conventional recession, the resumption of growth implies a reasonably brisk return to normalcy. The economy not only regains its lost ground, but, within a year, it typically catches up to its rising long-run trend.

The aftermath of a typical deep financial crisis is something completely different. As Reinhart and I demonstrated, it typically takes an economy more than four years just to reach the same per capita income level that it had attained at its pre-crisis peak. So far, across a broad range of macroeconomic variables, including output, employment, debt, housing prices, and even equity, our quantitative benchmarks based on previous deep post-war financial crises have proved far more accurate than conventional recession logic.

Many commentators have argued that fiscal stimulus has largely failed not because it was misguided, but because it was not large enough to fight a “Great Recession.” But, in a “Great Contraction,” problem number one is too much debt. If governments that retain strong credit ratings are to spend scarce resources effectively, the most effective approach is to catalyze debt workouts and reductions.

For example, governments could facilitate the write-down of mortgages in exchange for a share of any future home-price appreciation. An analogous approach can be done for countries. For example, rich countries’ voters in Europe could perhaps be persuaded to engage in a much larger bailout for Greece (one that is actually big enough to work), in exchange for higher payments in ten to fifteen years if Greek growth outperforms.

Is there any alternative to years of political gyrations and indecision?

In my December 2008 column, I argued that the only practical way to shorten the coming period of painful deleveraging and slow growth would be a sustained burst of moderate inflation, say, 4-6% for several years. Of course, inflation is an unfair and arbitrary transfer of income from savers to debtors. But, at the end of the day, such a transfer is the most direct approach to faster recovery. Eventually, it will take place one way or another, anyway, as Europe is painfully learning.

Some observers regard any suggestion of even modestly elevated inflation as a form of heresy. But Great Contractions, as opposed to recessions, are very infrequent events, occurring perhaps once every 70 or 80 years. These are times when central banks need to spend some of the credibility that they accumulate in normal times.

The big rush to jump on the “Great Recession” bandwagon happened because most analysts and policymakers simply had the wrong framework in mind. Unfortunately, by now it is far too clear how wrong they were.

Acknowledging that we have been using the wrong framework is the first step toward finding a solution. History suggests that recessions are often renamed when the smoke clears. Perhaps today the smoke will clear a bit faster if we dump the “Great Recession” label immediately and replace it with something more apt, like “Great Contraction.” It is too late to undo the bad forecasts and mistaken policies that have marked the aftermath of the financial crisis, but it is not too late to do better.

Kenneth Rogoff is Professor of Economics and Public Policy at Harvard University, and was formerly chief economist at the IMF.

Stock Market Downtrend Could Make a Double Bottom


In the US, the market recovered from its midday low on friday to close mixed but still posted the worse weekly decline since the early May 2010 flash crash. Europe, however, was not that fortunate and ended the week with their worse weekly decline since November 2008. The SPX/DOW lost 6.5%, and the NDX/NAZ were – 7.6%. Asian markets performed best losing 5.4%. While Europe lost 10.6%, the Commodity equity group lost 8.5%, and the DJ World index dropped 8.8%. We now have six of the fifteen international indices we track in confirmed bear markets, with the rest likely to follow.

On the economic front reports ended the week mixed. On the positive side: construction spending, personal income, auto sales, the payrolls report, consumer credit and the WLEI all improved. On the negative side: ISM manufacturing/services, personal spending, the ADP index, and factory orders all declined. The unemployment rate nudged lower, while weekly jobless claims nudged higher. Next week all eyes will be on tuesday’s FED FOMC meeting. The twin deficits and retail sales will also be reported.

LONG TERM: bear market highly probable

For quite a while now we have been reporting on the technical deterioration in the foreign markets, and the negative divergences in 75% of our long term indicators. These repeated warnings came to fruition this week as markets worldwide tumbled. We hope most heeded the call, beginning about three weeks ago, to take a defensive investment posture until the inflection point resolved itself. Fortunately, it resolved itself on monday with the market about 5.5% off its closing high. Unfortunately, it projected a new bear market and by friday the market ended 12.1% off the closing bull market high. So what’s next?


We’re expecting a long term downtrend to be confirmed by OEW analysis in the near future. Until then we have a wave structure, and now a drastic decline, that supports the new bear market scenario. The bull market of March 2009 advanced in five Primary waves to complete Cycle wave [1]. Primary wave I divided into five Major waves, and Primary waves III and V did not. They were simple structures. A Cycle wave [2] bear market should now be underway.

Initially we estimate this bear market could take between one and three years. If one year it should bottom in either Q3 or Q4 of 2012, along with the 2-year Tech cycle. If three years it should bottom in Q3 or Q4 of 2014, along with the next Tech cycle low and the 4-year Presidential cycle. In regard to price. Typically corrections to bull markets find support at the previous 4th wave of a lesser degree if the fifth wave was strong. This one was quite weak, so support notches down to the low of Primary II at SPX 1011. However, since this should be a Cycle wave bear market it could drop as low as the low of Major wave 2 of Primary I at SPX 869. We have a green line posted at that level on the above weekly chart. A decline of this nature would represent about a 70.7% retracement of the bull market, and a total loss of about 37% for the stock market. Project, monitor and adjust when necessary.

MEDIUM TERM: downtrend low SPX 1168

The bear market in the SPX/DOW started in early May. Kudos to several in our group who called it, we posted their counts. The bear market in the NDX/NAZ started in late July. During that month is when we publicly started to turn bearish. Since we mainly cover the SPX/DOW our report will continue based on that wave structure.


The first decline in the SPX from May-June was 113 points (1371-1258), we labeled it Major wave 1/a. Since this is the beginning of a bear market we can not determine, in advance, if the larger three wave structure will take the form of a 5-3-5, or an abA-B-abC complex three. Remember bull markets unfold in five waves, and bear markets in three waves. The counter-trend rally from June-July was 98 points (1258-1356), we labeled it Major wave 2/b. This uptrend retraced an unusually high 87% of the previous downtrend. The reason for this is the NDX/NAZ had to complete their bull markets by making new highs. When the current downtrend began, early July for the SPX and late July for the NDX, it started in a gradual manner like the first downtrend of the bear market. When it broke through the March (SPX 1249) and June (SPX 1258) lows on wednesday it accelerated to the downside on thursday/friday. At friday’s low this downtrend had already declined 188 points (SPX 1356-1168). Marking the total correction, thus far, from the SPX 1371 bull market high at 14.6%.


At friday’s low, SPX 1168, the market found support at the Major wave 4 low of Primary wave III (SPX 1173). This is very important support, in that, it represents a bit more than a 1.618 relationship to wave 1/a, hit the OEW 1168 pivot exactly, and the hourly chart displays the most oversold condition since November 2008. Should this level fail to hold, Fibonacci analysis suggests the next important levels of support for are at SPX 1130 (wave 3/c = 2.0 wave a) and SPX 1060 (wave 3/c = 2.618 wave a).

SHORT TERM

Current support for the SPX is at 1187 and then 1168, with resistance at 1222 and then 1240. Short term momentum displayed a positive divergence at friday’s low and the market responded with its best rally (46 points) since this current decline began from SPX 1347. We have been labeling this downtrend as a five wave sequence: Intermediate wave i SPX 1296, Int. wave ii SPX 1347 and Int. wave iii underway. We tentatively placed an Int. iii green label at the SPX 1168 low. The market would, currently, have to go sideways for several days or get above the OEW 1240 pivot to help confirm that count.


Should this occur the downtrend could make a double bottom around the OEW 1168 pivot and conclude. If not, we could hit the October 2008 extreme oversold condition of the last bear market. With the S&P downgrade of US debt to AA+ on friday night, the FED’s response: http://www.federalreserve.gov/newsevents/press/bcreg/20110805a.htm, and the FOMC meeting on tuesday. This event could possibly be used as an excuse for QE 3. Europe’s ECB just started another QE program by pledging to support the bond markets in Spain and Italy. The next few days should prove to be quite interesting.

FOREIGN MARKETS

The Asian markets were all lower on the week, are all downtrending, and lost 5.4%. Australia, China and Japan are in confirmed bear markets.

The European markets all dropped quite hard this week, all are downtrending, and lost 10.6%. Spain, Switzerland and the Stox are in confirmed bear markets.

The Commodity equity group were also hit quite hard, all downtrending, and lost 8.5% on the week. Brazil remains in a confirmed bear market.

COMMODITIES

Bonds are uptrending and benefitted from the stock market turmoil +1.6% on the week. 10-Year yields dropped to a yearly low of 2.43%. The 1-Year hit a record low of 0.11% yield.

Crude was hammered this week losing 9.7% and remains in a downtrend. May need QE 3 to resume its bull market.

Gold is uptrending and also benefitted from the turmoil, gaining 2.2% on the week. Silver, however, lost 3.9% on the week suggesting we may have seen the current uptrend highs for these metals. Either way this bull market continues.

The downtrending USD also benefitted from the turmoil and the BOJ currency intervention, gaining 1.0% on the week. The EUR/USD lost 0.8% and the JPY/USD lost 2.0%.

NEXT WEEK

Tuesday kicks off the economic week with the Q2 Productivity report and the FED’s FOMC statement that afternoon. There may be another press conference. Wednesday we have Wholesale inventories and the Budget deficit. Then on thursday the weekly Jobless claims and Trade deficit. On friday, Retail sales, Consumer sentiment and Business inventories. Nothing yet on the FED’s agenda except the meeting. Be careful with your investment dollars, markets drop a lot faster than they go up. Best to your weekend and week!

See the original article >>

Market Direction The Coming Week

by Macro Story

We are in for a wild ride for sure starting this evening when futures open followed by Asia. Europe will add to volatility come Monday and then with the pending FOMC meeting on Tuesday the party should really get started. We have leverage and emotion and as I have said countless times that is one dangerous combination.

Now is not the time to be greedy nor a hero and regardless if you are bear or bull please temper emotions. One thing I learned early in my trading career is when I did not temper emotions I missed out on some great opportunities. I stayed short when I thought markets would move lower or stayed long when I thought they would move higher only to watch profits turn into losses. Be open to volatility and remember markets right now are more about psychology and less about macro and or technicals.

Just because a market is due for a bounce doesn’t mean it must bounce. Just because you believe the bear is back doesn’t mean this market must continue the slide.

Looking at charts, reading trader comments over the weekend I suspect we open lower either testing or slightly taking out Friday’s low only to close higher on the day Monday. With an FOMC meeting on Tuesday the pressure on shorts to cover some very healthy profits ahead of any hints of QE will be very strong. Longs waiting for entry points will view the risk reward as favorable as well ahead of the meeting.

I imagine a lot of margin calls have worked through the system. The big question is mutual fund redemptions. How nervous are retail investors? How “convincing” were fund managers in telling people all is well and to stay fully invested (talk about a travesty but that’s a post for another day). At some point retail will want out as the pain of 2008 still fresh in their minds will be too strong.

One thing becoming clear is the timeline of a major market crash is accelerating. Problems in the banking system and government capital raises are growing while solutions are shrinking. The global economy is deteriorating faster than anticipated while investor fear is growing. The result is a negative feedback loop. A self fulfilling prophecy.

Below are the 2007 and 2011 comparisons. For now they still work and Friday’s candlestick pattern was too eerily similar to the 2007 pattern to not put credit on the next candle and that is why I am leaning towards such a move on Monday. The FOMC meeting further supports that belief in my mind.
Looking at the IV skew as shown below (short term and long term chart) implies more selling is at hand though. This is where I may soon venture away from the 2007 comp. In 2007 there was a deteriorating macro picture and the threat of Bear Stearns but the threat of Italy blocked from the capital markets or Bank Of America headed for a breakup or worse a downgrade of US debt was not in the picture. Today it is, along with a host of other issues.
I suspect the Fed on Tuesday announces little other than extending the words “extended period.” Any sense that the Fed is either powerless or unwilling at this point will rattle markets and cause reality back into investment planning.

I wish I was more definitive but remaining open, fluid and ready to act on multiple plans is important this coming week and months. As witnessed on Friday profits will turn into losses in nanoseconds so don’t be greedy. Don’t lose sight of long term plans but if trading intraday and you have a profit, take it!

Buckle up and be prepared.

Israel, Dubai, Saudi Arabia Shares Plunge in Wake of S&P Downgrade; Israel Drops 7%, Dubai 3.7%, Saudi 5.5%; Is S&P Downgrade to Blame?

by Mike Shedlock

The Mideast markets typically run Sunday to Thursday. However, the Saudi Arabia market is open on Saturday. The global selloff hit Saudi on Saturday and spread to Israel and Dubai on Sunday.

Israel Drops 7 Percent, 19.9% Since April 21

Israel’s benchmark stock index plunged the most in almost 11 years after Standard & Poor’s lowered the U.S. credit rating and amid concern the widening sovereign debt crisis in Europe will stall global growth.

Israel Discount Bank Ltd. (DSCT), the country’s third-largest lender, skidded 10 percent. Nice Systems Ltd. (NICE) slumped the most since November 2008. All 25 shares in the TA-25 Index tumbled, pushing the gauge down 7 percent, the biggest decline since October 2000, to 1,074.27 at the 4:30 p.m. close in Tel Aviv. The index is near the so-called bear-market territory after retreating 19.9 percent from a record high of 1,341.89 on April 21.
Dubai Shares Drop 3.7 Percent

Emaar Properties PJSC (EMAAR), developer of the world’s tallest tower, slumped 5.3 percent. Arabtec Holding Co. (ARTC) dropped the most since March after it said second-quarter profit fell 74 percent. The DFM General Index (DFMGI) lost 3.7 percent, the most since Feb. 28, to 1,484.31 at the 2 p.m. close in Dubai. The measure has plunged 12 percent from this year’s high in April, entering a so-called correction.
Saudi Shares Plunge 5.5%

Saudi Arabian shares tumbled for a third day, sending the benchmark index to its largest intraday drop since March, amid rising concerns about the global economy after Standard & Poor’s cut the U.S.’s credit rating for the first time.

Saudi Basic Industries Corp. (SABIC), or Sabic, the world’s biggest petrochemicals maker, fell the most in five months. Al Rajhi Bank (RJHI), the kingdom’s largest publicly traded lender by market value, reached its lowest price since March.

The 147-company Tadawul All Share Index (SASEIDX) slumped 5.5 percent to 6,073.44, the steepest decline since March 1, at the 3:30 p.m. close in Riyadh. All 15 industry groups fell. The gauge has fallen 10.5 percent from the year-high of 6,788.42 on Jan. 16.

“The Saudi market is reacting to the steep declines in global markets over the weekend,” said Asim Bukhtiar, an equity analyst at Riyad Capital. “Growing concerns of the U.S. relapsing into recession are driving sentiment.”
S&P Downgrade Did Not Cause This

Analysts worded all these reports as if the S&P downgrade was to blame or partially to blame. The facts of the matter are these.

  1. The global economy is slowing
  2. European debt crisis has escalated
  3. A global currency war is underway
  4. The US is headed for recession if not in recession now
  5. Europe is already in a recession in my estimation

The downgrade itself is not the problem. Rather the S&P downgrade (long overdue) is one of many symptom of a much larger global financial crisis. Nonetheless, expect many demagogues to make S&P the scapegoat if the decline escalates this week.

Potential for a Bear Market


I write a lot about key pivot points, which I have defined as the most important areas of buying (support) and selling (resistance). How I derived these unique points is proprietary, but if you have been following me enough, you should realize that they are an effective technical tool to understanding the price action. Last week’s price action in the SP500 was rather significant not only because of the losses but because prices closed below key pivot points. A close below support defines a down trend, and old support becomes new resistance. In addition and as the data will show, closes below key pivot points can lead to fairly significant losses.

Figure 1 is a weekly chart of the SP500 with key pivot points noted by the red dots. Last week’s price action saw a weekly closely below a prior key pivot point (see gray oval on chart). Since 1991, there have been 41 key pivot points in the SP500, and there have been 17 times when price closed below a prior key pivot point. Obviously, not all closes below a prior key pivot are ominous as can be seen by the price action from August, 2010. It was looking bad for equities, but then Helicopter Ben saved the day with QE2. Of course, this fake out led to a significant bull run.

Figure 1. SP500/ weekly
But back to my point and my concern. Of the 17 closes below prior key pivots, there have been 7 times when the market (i.e., SP500) kept going lower by 10% or more. 4 out of 7 lost more than 15% from the close below a prior key pivot point to the next bottom.

Of course, there have been 10 times when a close below a prior key pivot point was either a fake out (August, 2010) or led to only mild losses (before prices bottomed and reversed). So how will I know which scenario we are dealing with? If prices close back above resistance (old support) levels, then the trend will have gone from down to up and this whole past week was one gigantic fake out.

From this perspective, there is no reason to get long equities until this level (i.e., the new resistance or old support) is breached to the upside or sentiment turns more extreme. It is not worth the risk. This isn’t the time to hope. This is the time to take some action to protect yourself and your money.

SPY Trends and Influencers 8/7/2011


Last week’s review of the macro market indicators looked for Gold ($GLD) and US Treasuries ($TLT) to continue their moves higher in the coming week, with Crude Oil ($USO) and the US Dollar Index ($UUP) continuing lower. The Shanghai Composite ($SSEC) looked to consolidate further in the middle of its range while Emerging Markets ($EEM) did the same at the upper end of their range. Volatility ($VIX) looked biased to the upside contributing to the view that Equity Indexes, $SPY, $IWM and $QQQ will continue lower. All looked to remain within their ranges of the last 6 months with the QQQ remaining the strongest much higher in its range. News driven breaks to the upside should be contained in that range with the possible exception of the QQQ’s.

The week played out a lot like anticipated with Gold and Treasuries rising. Crude Oil fell out of bed but the US Dollar consolidated before moving higher late in the week. The Shanghai Composite did consolidate further but Emerging Markets took their cue from global markets and sold hard. Volatility moved higher as Equity Indexes fell throughout the week, ending with the SPY, IWM and QQQ all breaking their 6 month ranges lower. What does this mean for the coming week. Let’s look at some charts.

As always you can see details of individual charts and more on my StockTwits feed and on chartly.)

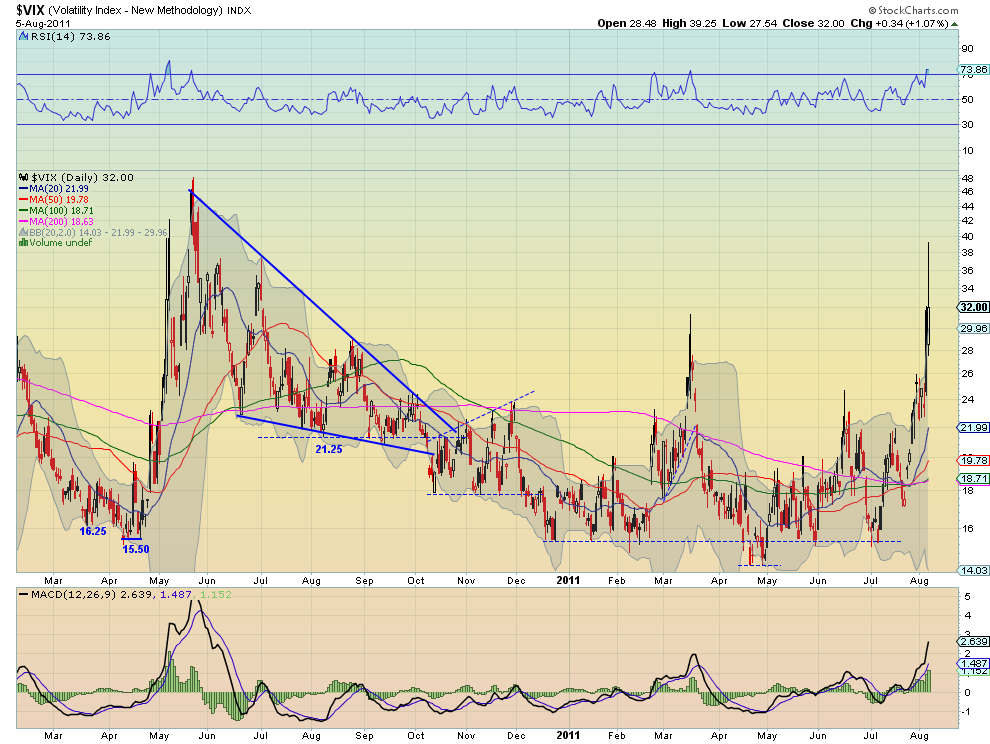
VIX Daily, $VIX

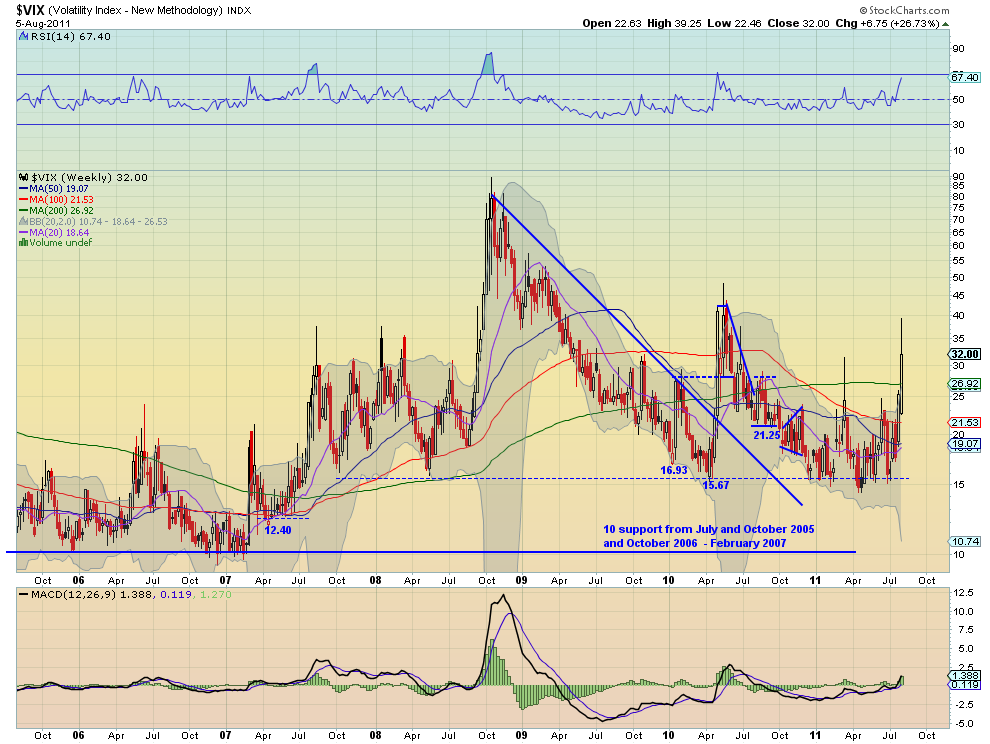
VIX Weekly, $VIX

After weeks of creeping slowly higher in a stable range, the Volatility Index broke higher this week, spiking near 40 on Friday. The RSI and MACD on the daily timeframe continue to support rising volatility going forward, although the RSI has historically pulled back at these levels. The weekly chart shows the break is currently lower than the last break up from April 2010, continuing the lower highs and creating a descending triangle. The RSI from the weekly chart is not over 790 yet but notice the reaction to that level the last two times it got there. Look for any further spike in Volatility to be contained at the previous weekly high at 48 and the long shadows suggesting a pullback in the coming week.

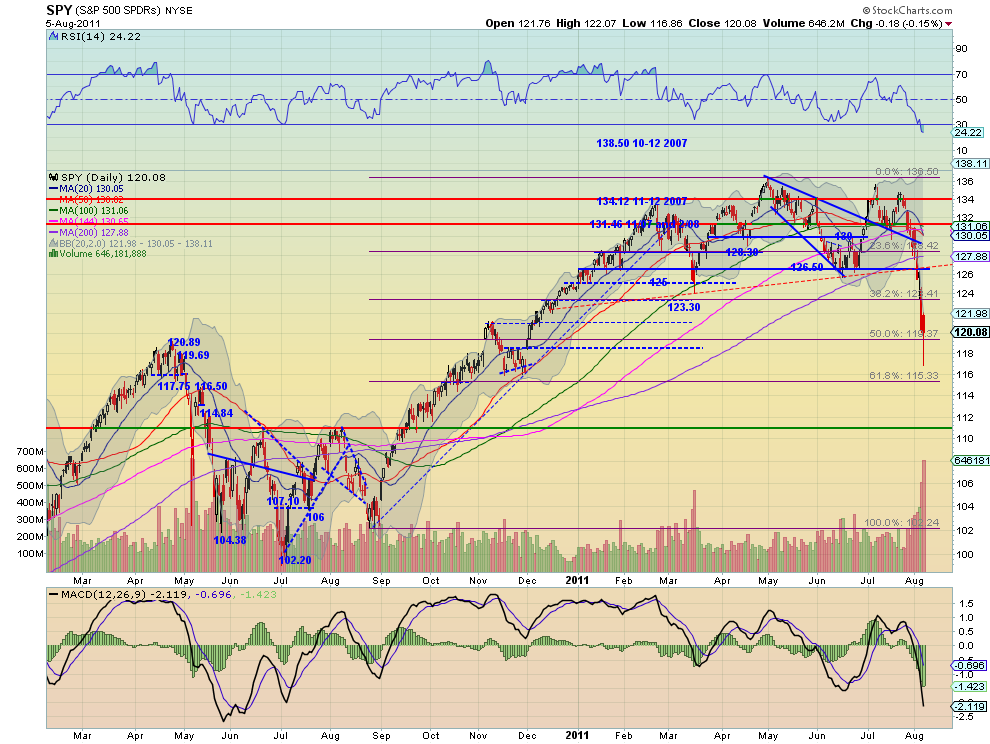
SPY Daily, $SPY

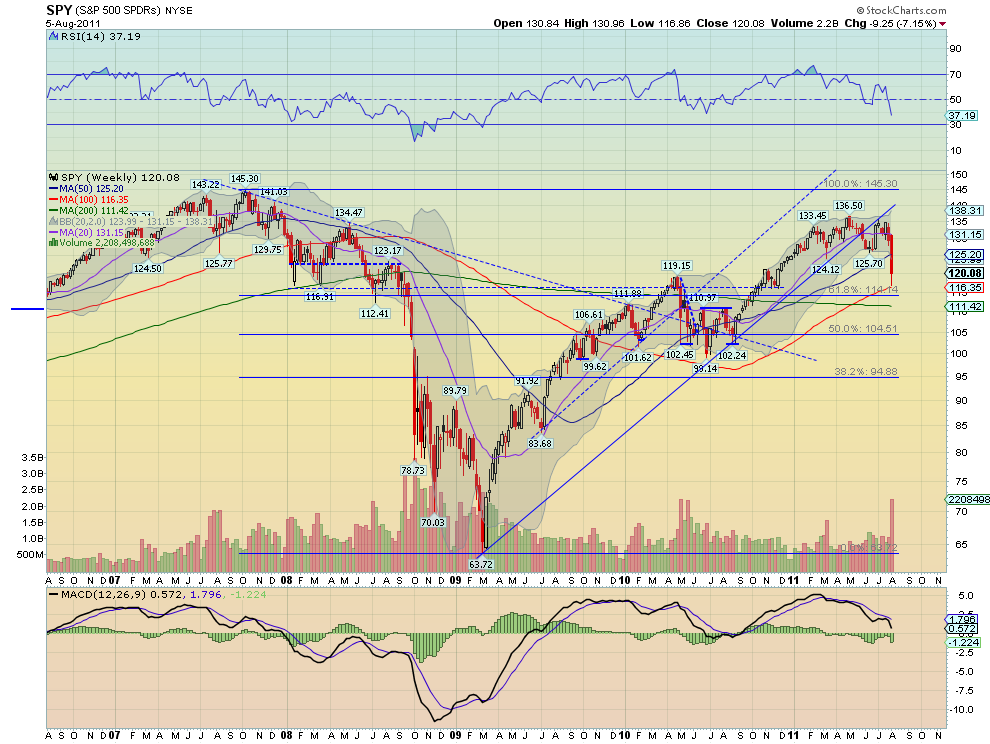
SPY Weekly, $SPY

The SPY took the elevator down as they say, dropping over 10% at its worst. The daily chart shows the move lower accelerating after it broke the neckline of the Head and Shoulders top where it intersected the bottom of the six month consolidation channel. The RSI on the daily chart is now under 25, getting oversold, and the MACD is very high. There was a large volume run up on the move lower and it is now out of the Bollinger bands for 3 days. Finally all of the SMA’s are sloping lower. The weekly chart shows a touch near the 100 week SMA with a RSI that is pointing lower and the MACD starting to grow more negative. The SPY looks to head lower but with the quick and steep decline out of the Bollinger bands there is a good chance of consolidation or a bit of a reversion higher before it continues down. Look for 124 or 126 to contain any up move and an eventual target of 114-116 at least, and below that 111.

Next week will be interesting on many levels. Gold appears ready to consolidate, if only for a couple days within the uptrend while Oil may consolidate before continuing the fall. The US Dollar Index ETF looks to drift higher in the 20.88 to 21.90 range while US Treasuries pullback. The Shanghai Composite appears headed lower toward support and Emerging Markets may consolidate or bounce a bit before doing the same. The spike in Volatility looks to have more room to the upside but shows signs of pulling back at least early in the week. The Equity Index ETF’s SPY, IWM and QQQ appear set to bounce early next week, but the SPY and IWM charts look broken on many timeframes and headed lower. The QQQ is a bit of an enigma as it has maintained a hold at support. The QQQ’s continuing to hold and move higher would be a signal that the broad downturn may be ending. On the other hand if the SPY and IWM continue lower as expected in the intermediate term the QQQ will likely join them lower. Use this information to understand the major trend and how it may be influenced as you prepare for the coming week ahead. Trade’m well.

See the original article >>

PortfolioMatters: When Politics and Economics Collide


Last week, I said that Wall Street’s focus will be on the economy in the weeks to come. On cue, the economic data stunk badly enough to draw everyone’s attention. Second-quarter GDP growth was modest, and estimated first-quarter growth was revised down to a fraction of a percentage point. The ISM chimed in with a manufacturing survey that suggested that the third quarter is not off to a good start and that the short-term future may not be any better.

Republicans and Democrats agreed to budget cuts and a promise to pursue more deficit reduction actions in exchange for raising the debt ceiling. As you know, the legislation is universally disliked. What it does do, however, is make it harder for Congress and the president to do something about the economy. Additional tax cuts or spending will need to be offset in some manner, especially with the credit rating agencies breathing down Uncle Sam’s neck.

Legislation often has unintended consequences. The debt ceiling law has the potential to throw a wrench in to the presidential cycle for stocks. The third year of a presidential term has historically been good for investors, with the Dow Jones industrial average appreciating every time since 1939. Jeff Hirsch, author of “The Stock Trader’s Almanac,” says that this is because presidents seek to make voters happy ahead of forthcoming elections.

Often, presidents have pushed for some type of economic stimulus. Jeff told me yesterday that the markets have also historically reacted to a cooperative environment in Washington that puts the U.S. in a good place. This has included actions involving both domestic and foreign issues.

Given the conflicting personalities and ideologies in Washington, cooperation among politicians remains in short supply. At the same time, President Obama now has to balance potential future economic initiatives with long-term debt reduction desires. Any proposal, whether it involves spending (e.g., job training, infrastructure, extended unemployment benefits) or tax cuts and expenditures (e.g., extending the 2% payroll tax cut, allowing corporations to repatriate foreign profits) will impact the trajectory of our government’s debt.

This is not to say that the 72-year streak of positive third-year presidential term gains for the Dow will be broken. The economy could recover from its recent slump and/or President Obama and congressional Republicans could find more middle ground. There is also the potential for positive developments in Europe, Japan and the Middle East. (I know some of these are long shots.) Plus, valuations for large-cap stocks are cheap relative to projected earnings.

If part of your investing strategy this year is based on the presidential cycle, you need to acknowledge that things are not going as planned. Streaks last until they don’t. Similarly, if your investing strategy is based on an economic recovery, you will need to acknowledge that growth has slowed. None of this is to say that you should get out of stocks, but rather that you should factor in higher downside risks. Pay attention to valuations and to business trends. Be wary of those companies that are losing market share, as opposed to simply experiencing slower growth because of the economy.

As far as the impact of the debt ceiling legislation on your portfolio, monitor companies that are dependent on government spending. (If you are unsure about the percentage of revenues that come from the federal and state governments, read through the company’s annual 10-K filing with the Securities and Exchange Commission.) Though the cuts will only have a small short-term impact, they could reduce earnings for 2012 and beyond. Be on the watch for downward revisions to earnings estimates.

AAII Sentiment and Asset Allocation Survey


The Week Ahead

Approximately 20 S&P 500 companies will report earnings next week as earnings season begins to wind down. Two Dow components are included in this group, Walt Disney (DIS) on Tuesday and Cisco Systems (CSCO) on Wednesday.

The week’s first economic report will be second-quarter productivity, which will be published on Tuesday. Wednesday will feature June wholesale trade data. June international trade numbers will be published on Thursday. Friday will feature July retail sales, the preliminary University of Michigan consumer confidence survey, and June business inventories.

The Federal Open Market Committee will hold a one-day meeting on Tuesday. No Federal Reserve officials are currently scheduled to make public appearances next week.

The Treasury Department will auction $32 billion of three-year notes on Tuesday, $24 billion of 10-year notes on Wednesday and $16 billion of 30-year bonds on Thursday. These will be the first Treasury auctions since the debt ceiling was raised.

The Italian Debt: Bonds With Benefits?


No sooner was a “deal” (of sorts) structured for Greece than the vultures turned their attention to Italy, and the familiar double negative feedback loop started.

First the cost of insuring Italy’s debt via CDS nearly doubled in a week, then the yields went up (of course), then the rating agencies started to fret about whether or not they might have missed something (again), so talk started about downgrades, so investors who are obliged to have a certain quality of debt in their portfolios started to sell, so yields went up, so CDS spreads went up…round and round. (See Chart added by EconMatters)

Italy's CDS Rose to A New Yearly High
Chart Source: DailyCapitalist.com (Added by EconMatters)

Good time to buy
  1. Total Italian debt burden (private plus public) is 250% of GDP (compared with over 350% in USA).
  2. Granted the public debt is 120% of GDP, but over 50% of that is owed to Italians living in Italy; hardly a flight-risk. (See Chart added by EconMatters)
  3. Net external liabilities are 15% of GDP compared with more than 100% for Portugal and Greece.
  4. The country makes things, it has tourism and it has opera, and food and football, and guys who live with their mom until they get married, and until recently its trade deficit was negligible (goods + services). Right now that’s about 2% of GDP mainly due to having to buy oil on the spot market to replace oil traditionally supplied by Libya. By comparison, USA’s trade deficit is about 3.5% of GDP (last four quarters). 
Chart Source: DailyCapitalist.com (added by EconMatters)
Let’s see, what’s going against Italy right now is simply that the “insurance” market for debt has put Italy in its cross-hairs. Which brings into question whether the world should be dictated to, by an elite that unilaterally decides the valuation of debt, and has the power to bring down whole countries, or whether those guys should be simply closed down.

Italy will be the “bridge too far” for those who seek to mess with the fundamentals, and it’s about time. Prediction: Italian 10-Year debt will sell for less than 4.0% in one year’s time.

Let’s see if that one is as accurate as the prediction of 2.89% for the US Ten-Year made last December, watch this space next August 1st.

The New World Order of Global Sovereigns: When Corporations Have Better Credit Ratings


Our interactive graphic shows how deeply in hock we all are
THE headlines are all about sovereign debt at the moment. But that is only part of the problem. Debt rose across the rich world during the boom, from consumers maxing out credit cards to financial firms taking on more leverage, and the process of reducing it is still at a very early stage.

The interactive graphic above shows the overall debt levels for a wide range of countries, based on data supplied by the McKinsey Global Institute. In theory there is no maximum level for debt relative to GDP, but Ireland and Iceland (not on this map) found the limit in practice when they hit eight-to-ten times GDP.

The debt is also broken down by sector. Note the huge size of Britain’s banks relative to its economy, and the high level of Spanish corporate debt. Note, too, Japan's vast amount of government debt, not yet a problem but an obvious reason for jitters over the longer term.

Japan has the dubious distinction of topping our sovereign-debt vulnerability ranking below, which orders countries based on their primary budget balance, their debt-to-GDP ratio and the relationship between the yield on their debt and economic growth (if the former is larger than the latter, the debt burden is getting steadily worse). Britain does badly, too, although a tough austerity programme and the long duration of its outstanding debt protect it from a loss of confidence. Here’s the table:

The U.S. debt ceiling political soap has finally come to an end. With the debt deal done, the U.S. has dodged a major bullet of a debt default, but may not be out of the woods yet for a sovereign credit downgrade. Nevertheless, regardless whether one or more of the Big 3 agencies (S&P, Moody's and Fitch) would really deal a downgrade to the U.S., it is the markets that holds the key to a sovereign's credit worthiness based on its ability to manage a balanced budget, implementing proper monetary and fiscal policies. From that perspective, the markets probably have already spoken.

A Reuters analysis discusses that typically the sovereign -- the government -- is seen as the most solvent entity in the country, but with a number of governments face bigger risks of downgrades or defaults, some multinational corporations are enjoying higher cash flows, and set to benefit from higher ratings than their sovereigns.

According to Reuters, in the United States, the cost of insuring the debt (i.e. CDS or credit default swap) of Automatic Data Processing (ADP), Exxon Mobile (XOM), Johnson & Johnson (JNJ) and Microsoft (MSFT) against default on a five-year horizon is at least 20 basis points lower than that of the U.S. government (See Chart) All four U.S. companies boast triple-A ratings, the same as the U.S. government, but S&P has said that a change in the U.S. sovereign credit rating or outlook will not affect these four corporations.


Moreover, a New World Order has emerged for the global sovereigns, as Reuters reports,
"Globally, 107 corporate and local governments have higher ratings than those of the sovereign in their country of domicile on a foreign currency basis, Standard & Poor's says. That means these entities are seen as likely to be able to cover their debt obligations even when the central government of the country they are based in cannot."
"Balance sheets of OECD countries will continue to deteriorate. You're looking at a medium to long-term credit downgrade cycle over the next five years," said [Ashok] Shah [chief investment officer of London & Capital.]
Indeed, with a whopping $76.2 billion in cash and marketable securities, Apple (AAPL) now has more cash than the U.S. government. Some jokingly said the U.S. government could ask Steve Jobs for a loan and that Uncle Sam should start selling iPads. These might seem like jokes for the time being, but they also might have foretold things to come in the relationship between corporations and their respective domiciles, and the changes in government entity structure where sovereign may operate more like a business.

Sector Earnings Season Performance

by Bespoke Investment Group

Below we highlight the average one-day change on their report days for companies that have reported earnings this season by sector. We also include the average one-day change on earnings by sector for all earnings seasons going back to 2001. As shown, the average Telecom stock has declined 7.54% on its report day this season, which is the worst performance of any sector. The Energy sector has been the second worst with an average one-day change of -4.30%, followed by Materials (-3.83%) and Consumer Staples (-3.41%). Surprisingly, Financial sector stocks are holding up the best in response to their earnings reports this season. The average one-day change for Financial stocks on their report days has been -1.12%. It's pretty sad when the BEST performing sector is averaging a one-day decline of more than 1%.


Are commodities a good place to hide right now?

by Kimble Charting Solutions


Dow long-term channel ...

by Kimble Charting Solutions


ChartMatters: Secular Bull vs. Secular Bear and The Coming QE3


Was the March 2009 low the end of a secular bear market and the beginning of a secular bull? Without crystal ball, we simply don't know.

One thing we can do is examine the past to broaden our understanding of the range of possibilities. An obvious feature of this inflation-adjusted is the pattern of long-term alternations between up-and down-trends. Market historians call these "secular" bull and bear markets from the Latin word saeculum "long period of time" (in contrast to aeternus "eternal" — the type of bull market we fantasize about).

If we study the data underlying the chart, we can extract a number of interesting facts about these secular patterns:


The annualized rate of growth from 1871 through the end of June is 2.00%. If that seems incredibly low, remember that the chart shows "real" price growth, excluding inflation and dividends. If we factor in the dividend yield, we get an annualized return of 6.66%. Yes, dividends make a difference. Unfortunately that has been less true during the past three decades than in earlier times. When we let Excel draw a regression through the data, the slope is an even lower annualized rate of 1.71% (see the regression section below for further explanation).

If we added in the value lost from inflation, the "nominal" annualized return comes to 8.90% — the number commonly reported in the popular press. But for an accurate view of the purchasing power of the dollar, we'll stick to "real" numbers.
Since that first trough in 1877 to the March 2009 low:
  • Secular bull gains totaled 2075% for an average of 415%.
  • Secular bear losses totaled -329% for an average of -65%.
  • Secular bull years total 80 versus 52 for the bears, a 60:40 ratio.
This last bullet probably comes as a surprise to many people. The finance industry and media have conditioned us to view every dip as a buying opportunity. If we realize that bear markets have accounted for about 40% of the past 122 years, we can better understand the two massive selloffs of the past decade.

Based on the real S&P Composite monthly averages of daily closes, the S&P is 65% above the 2009 low, which is still 32% below the 2000 high.

Add a Regression Trend Line

Let's review the same chart, this time with a regression trend line through the data.


This line essentially divides the monthly values so that the total distance of the data points above the line equals the total distance below. Remember that 2.00% annualized rate of growth since 1871? The slope of this line, an annualized rate of 1.71%, approximates that number. The difference is largely a result of the rally over the two years.

This chart below creates a channel for the S&P Composite. The two dotted lines have the same slope as the regression, as calculted in Excel, with the top of the channel based on the peak of the Tech Bubble and the low is based on the 1932 trough.


Historically, regression to trend often means overshooting to the other side. The latest monthly average of daily closes is 45% above trend after having fallen only 9% below trend in March of 2009. Previous bottoms were considerably further below trend.

Will the March 2009 bottom be different? Only time will tell. Meanwhile, market participation based on trend-following, such as monthly moving averages, has been an effective strategy.

And if a picture is worth a thousand words, this chart needs little additional explanation — except perhaps for those who are puzzled by the Jackson Hole callout. The reference is to Chairman Bernanke's speech at the Fed's 2010 annual symposium in Jackson Hole, Wyoming. Bernanke strongly hinted about the forthcoming Federal Reserve intervention that was subsequently initiated in November, namely, the second round of quantitative easing, aka QE2.


The NY Times captured the essence of the speech here. Will there be a round three? Do children like Disneyland?

This Pattern is Predicting a Crash… Are You Ready?

by Graham Summers

We are currently witnessing a pattern in the stock markets that has occurred multiple times in the last century. And everytime we did, things got UGLY.

That pattern is:

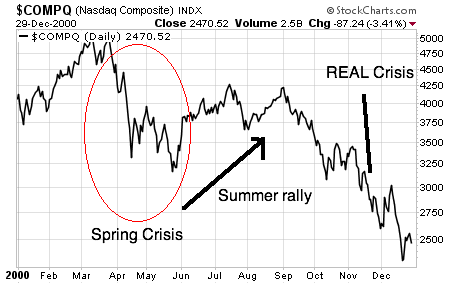
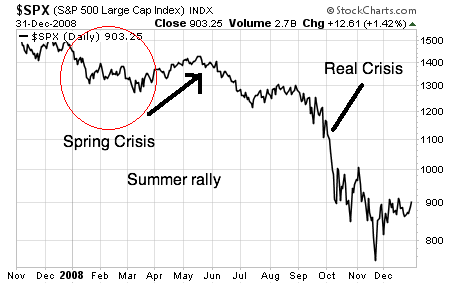
1) a Spring Crisis
2) a Summer rally (on light volume)
3) The BIG Crisis

This pattern has occurred in 1907, 1929, 1931, 1987, 2000 and 2008. In each of these years, stocks came undone via some kind of Crisis during the March –May period. There was then a brief summer “relief” rally, and then things got VERY ugly in the fall.

Here’s the pattern for 2000:

Here it is in 2008:

So far, the market has been trading sideways for most of 2011, but the pattern is emerging:

Given that the Financial System is now even more leveraged than it was during the Tech Bubble… and that we’ve added TRILLIONS in debt to the US’s balance sheet, the odds of another systemic collapse are getting higher by the day.

See the original article >>

1998 Redux - Update

by Market Anthropology

Monday evenings note (see Here) concerning the similarities in market conditions with 1998 is replicating along very similar lines - both in seasonality, price and volatility. After yesterdays extreme move lower - the downside target is coming into equal proportions to 1998. Following this analog - risk appears tilted towards further weakness in the equity markets in the near term. With that said, another leg down will likely be contingent on further exogenous propellant from Europe.

Here is an updated chart after yesterday's close.


The Week Ahead: Waiting for QE3

by Tom Aspray

After a week like this one, it seems like the markets have nowhere to go but up…and although a rally is likely this coming week, we aren’t out of the woods by a long shot, writes MoneyShow.com senior editor Tom Aspray.

It took the much stronger than expected jobs report to stem the bleeding in the US markets on Friday, as the close was mixed. The Dow Industrials ended higher while the S&P 500 and Nasdaq both closed lower.

Overall, global equities had the worst week since the middle of the financial crisis. Clearly, global investors have no confidence in their governments to act in a responsible manner.

The prolonged wait for the debt ceiling to be raised just reinforced the view of many that the majority of our leaders in Washington are ignorant about the role that confidence plays in the financial markets. The “2+2=5” outlook of many politicians has additionally led many to question not only their economics background, but also their understanding of basic math.

The focus on deficits instead of growth is the same mistake that was made in the early 1930s in the US, as well as in Japan after its top in 1989. It took World War II to spur US growth, and Japan has still not recovered after more than 20 years.

No one is happy with the size of the deficits, but cutting back at this point will put more out of work and make any recovery more difficult.

The condition of US infrastructure is embarrassing; with a recent study by the World Economic Forum ranking the US in 23rd place for infrastructure, right between Spain and Chile. (Ask someone in Europe what they think of Spain’s infrastructure, and you might get a laugh.)

The crisis in the Eurozone is also a large part of the problem, as the calm over the recent plan to solve Greece’s debt crisis did not last long. The European Central Bank recently bought Portuguese and Irish bonds, but forgot to buy the similarly imperiled Spanish and Italian bonds—and then raised rates, making the situation much worse.

The Spanish and Italian economies are two of the more significant economies in the Eurozone, and so the pressure is on for the Euro countries to act big and act soon.

The rush out of equities globally has coincided with a rush into bonds and gold. The monthly chart for the US T-bond futures shows that prices are now near the weekly starc+ band, which reflects an extreme in prices.
chart
Click to Enlarge

Yields on short term debt have seen an even more dramatic decline, as the yields on the five-year T-Note have dropped from 1.84% in early July to a low of 1.12%.

Besides seeing bonds as the safer buy, many are hoping that there will be a “QE3” of some sort in the near future, which will push bond prices even higher. A new stimulus might involve the Fed purchasing bonds as in QE2. I think the Fed may, however, find another way to add liquidity, and this could cause a reversal in the bond market.

Adding to the market volatility last week was the intervention to slow down the sharp increases in the value of the Swiss franc and the Japanese yen. The upper chart on the left is of the Swiss franc, which has gone up about 10% in the past month.

The Swiss economy is still growing strongly, but there are fears this won’t last if the currency continues to rise. For Japan, a strong yen could kill any chances they have to keep their economy in recovery mode, especially after the disasters earlier in the year.

This week is relatively slow for new economic data, with the Productivity and Costs report out Tuesday along with the Federal Open Market Committee announcement. On Thursday, we get the International Trade Report, along with jobless claims, followed by retail sales and consumer sentiment on Friday

WHAT TO WATCH

Pretty much everything was hit this week, but there were a few standouts. One was Dendreon Corp (DNDN), which was down 67% Thursday. Today it was reported that two of the best known hedg.e funds lost over $300 million on DNDN’s.

Last week, the ETF’s that represent the major stock indexes violated their 50% support levels from last summer’s lows, which has caused some serious technical damage. A sustainable rally is likely this week or next, but then we need to be aware of the more important support that is derived from the bull market lows in 2009. Such a rally is likely to provide an opportunity to raise some cash and put on some portfolio hedges at more favorable levels.
chart
Click to Enlarge

S&P 500
The Spyder Trust (SPY) tested its uptrend (line a), and came very close to the 61.8% retracement support at $115.68. The 200-day moving average (MA) is still rising, but there is now very strong resistance in the $124.50 to $127 area.

The S&P 500 A/D line dropped very sharply last week, and is now close to more important support (line b). This coincides with the March lows and the November 2010 highs. This drop in the A/D line means that it would take several weeks at a minimum before the A/D line could bottom, which is needed to set the stage for a decent rally.

The major 38.2% support from the 2009 lows is at $110.28, which is about 5.5% below Friday’s lows.

Dow Industrials
The Spyder Diamonds Trust (DIA) plunged sharply through the neckline of the head-and-shoulders top formation I discussed last week. It got as low as $111.26 on Friday, while the neckline had been just above the $119 mark.

The longer-term uptrend (line d) was also broken, and this creates a strong band of resistance in the $118 to $120 area.

The 50% support level was also violated, with the 61.8% support from the July 2010 lows next at $108.57. This brings into play the major 38.2% support at $104.24, which is derived from the 2009 lows.

The Dow Industrials’ A/D line did drop below the June lows last week, but is still well above the stronger support (lines e and f).
chart
Click to Enlarge

Nasdaq-100
The tech sector has continued to hold up better that the other market sectors, even though the PowerShares QQQ Trust (QQQ) broke with the support at $53.50 and the 38.2% retracement support early Friday.
There is now more important support at the 50% retracement of $50.42, with the uptrend (line c) now just below $50. There is stronger chart support as well as the 61.8% retracement level at $48.19.

The Nasdaq-100 A/D line has slightly broken its recent lows (line d), but is so far holding up much better than the A/D lines of the other major averages.

There is initial resistance now at $55.50, with much stronger levels at $56.60 to $57.30.

Russell 2000
The iShares Russell 2000 Index Fund (IWM) cut through the June lows (line e) like a hot knife through butter, proceeding to fall through the 38.2% and 50% support levels.

The next support is at $69.50, which is the 61.8% support from 2010, with the uptrend (line f) at $67.66.
Looking at the major retracement support calculated from the 2009 lows, the 38.2% level comes in at $66.74. This also corresponds to good chart support.

It is not surprising that the Russell 2000 A/D line has dropped below the support that goes back to last fall (line g). Much more important support for the A/D line also exists (line h).

Sector Focus
The Dow Jones Transportation Average gave a great warning of the recent plunge when it failed to rally with the other major averages in the latter part of July. The on-balance volume (OBV) also did not confirm the July highs, and the confirmation of this divergence generated a sell signal.

The major 38.2% support lies at 4,294, which is about 8.3% below current levels. A drop to these levels would be severe.

All of the major sectors were under pressure last week, but utilities held up the best, dropping about 6%, while basic materials were hit the hardest and are down 13%. Technology was the third best performer, down just 7%.

Next week I will take a more detailed look at the critical support levels in the Select Spyder ETFs.

Follow Us