Tuesday, June 14, 2011

U.S. Macro in Three Charts: Credit Flows

By Global Macro Monitor

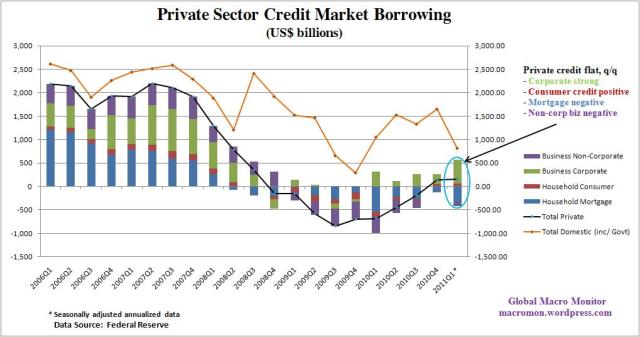
The U.S. is suffering from insufficient aggregate demand the result of the bursting of the 2004-07 credit bubble. The consumer led economy financed by borrowing, much of it backed by home equity, has given way to massive private sector deleveraging as reflected in the charts below. To cushion the blow, the federal government stepped up deficit spending in an effort to replace the decline in demand. This is clearly illustrated in the charts below.

The latest data from the Federal Reserve’s Flow of Funds Accounts show that private domestic credit borrowing of the non-financial sector is still at very anemic levels (see middle chart) . Though total private non-financial credit growth was flat in Q1, corporate continued to strengthen and consumer credit was positive for the second straight quarter. This was offset, however, by continued deleveraging in the mortgage and non-corporate business sector. The negative borrowing is likely both supply and demand constrained.

The charts are revealing as they also illustrate the sharp Q1 drop in public sector borrowing with state and local government turning negative. Unless private credit significantly improves — net mortgage lending turning positive, for example – to help finance the expansion of domestic demand, the economy will likely remain sluggish as the crunch in public spending continues. After all, President Obama did say that “the flow of credit is the lifeblood of our economy.”

Corporate spending and the export sector will have to do the heavy lifting as the U.S. works its way through the credit mess. The President needs a positive Black Swan event, such as the explosion of the internet, which drove high levels of investment spending during the Clinton Administration, for example.

Policies to free up financing for small and non-corporate businesses and renewed efforts to clean up mortgage sector, which also allow housing prices to bottom, could help strengthen the recovery. Stay tuned, we’ll be back with more analysis of the Flow of Funds.

~~~
~~~


See the original article >>
“US Debt Default Would Be a Moral Disaster”

by John Fullerton

So declared JPMorgan CEO Jamie Dimon regarding the prospect of a US default on its debt, after which he received a standing ovation at the University of Colorado’s Denver School of Business. Hmm… Let’s do a little press review—the following items quoted from recent news articles:
  • JPMorgan Chase recently lost a class-action lawsuit brought upon the bank for illegally foreclosing on military members’ homes while they were on active duty.
  • J.P. Morgan had declined to address the matter until Wednesday. But in a sworn deposition, one of the bank’s employees, Beth Ann Cottrell, admitted that she and her team signed off on about 18,000 foreclosures a month without checking whether they were justified.
  • The federal bankruptcy court judge presiding over the Bernard Madoff case has revealed the JPMorgan Chase employees who allegedly suspected they were doing business with a Ponzi schemer.
  • J.P. Morgan Chase agreed to a $722 million settlement with federal regulators over accusations that the bank and two former executives made illegal payments to win municipal bond business from Jefferson County, Alabama.
  • Deutsche Bank AG, JPMorgan Chase & Co., UBS AG and Hypo Real Estate Holding AG’s Depfa Bank Plc unit were charged with fraud linked to the sale of derivatives to the City of Milan.
  • JPMorgan Chase is being sued by Allstate insurance company for fraud, in the latest example of a big bank being accused of knowingly selling a poor-quality product.
  • The lawsuit alleges that J.P. Morgan Chief Executive James Dimon and other top executives used inside knowledge to take advantage of Lehman as its financial state worsened. J.P. Morgan, the suit alleged, coerced Lehman to turn over $8.6 billion in collateral in September 2008, triggering a liquidity squeeze that contributed to Lehman's collapse.
  • The latest settlement brings J.P. Morgan's total bill to settle regulatory and other lawsuits related to its role in the Enron collapse to more than $3.3 billion, including the $2.2 billion the bank agreed to pay in the class-action lawsuit that has the University of California as the lead plaintiff.
  • A former JPMorgan Chase & Co. banker pleaded guilty to rigging bids for municipal-bond investment contracts, becoming the eighth person to admit joining the biggest conspiracy in the $2.8 trillion market’s history.
These settlements and allegations (and there are more) collectively paint an unattractive picture of the firm I dedicated 18 productive years of my life to (although it bore no resemblance to the JPMorgan of 2011).

And this is the picture of the bank headed by America’s “least hated banker” according to the New York Times. It’s a bank whose dividend has been slashed, and whose stock price has not once seen the high fifties it was trading at when I left ten years ago. This is also despite massive implicit and explicit government subsidies worth billions over that time, a derivative book that has ballooned to a ludicrous $87 trillion in notional contracts outstanding that provides unchecked oligopoly power and alone makes the firm too big to fail and impossible to liquidate in an orderly fashion no matter what Dodd-Frank would like us to believe, a business model that would fail if true resiliency inducing capital reserves and liquidity mismatch limits were demanded by regulators not captured by the banking lobby, and grotesque compensation going to senior management along the way despite all its legal and ethical challenges and business failures.

As I contemplate unemployment of nearly 10% in the United States and far worse in places like Greece, Iceland and Ireland, made worse by crushing austerity, the violence and permanent human damage it represents, unemployment and underemployment of college graduates 25 and under of nearly 50% in the US, layoffs of good teachers in already failing schools, the economic induced suicides, the universal stress, all part of the rolling fallout of the finance-triggered Great Recession, I’m left with a simple question:

What exactly constitutes “moral disaster” Mr. Dimon?

CREDIT SUISSE: LOW RATES AND ECONOMIC UNCERTAINTY ARE BULLISH FOR GOLD

by Cullen Roche

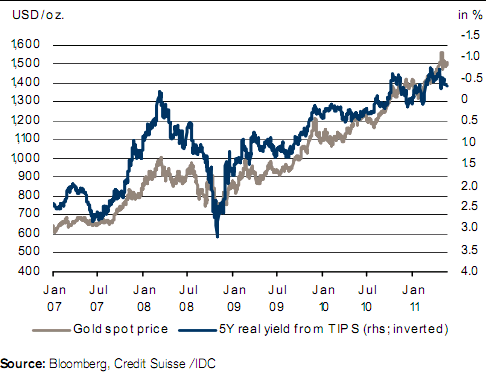
Credit Suisse says the recent economic uncertainty only strengthens the bull case for gold as investors are likely to turn to the precious metal as a safe haven. They maintain that the economy uncertainty will force the Fed to remain very accommodative. This potent mix of uncertainty and low real interest rates creates a very bullish outlook for gold prices:
“Low real interest rates should attract further investment demand for gold. Gold should also benefit from rising uncertainty over the economic outlook.
Gold to benefit from low yield environment. Precious metals benefit from the low yield environment. In particular, gold is less cyclical than other commodity markets and should perform well in the weeks ahead.”

See the original article >>

How Texas drought helps US cotton Futures

By Chuck Kowalski

Cotton growing areas in Texas are facing very hot, dry conditions and signs point to a lower than expected cotton crop thus far in the U.S. Texas is the largest cotton growing state in the country, so losses could be significant if the weather doesn't turn soon.

Someone who hasn't been following the cotton market for the last year might get very excited about this news. However, there is another side of the equation - as there always is. When we look at the world supply and demand picture, it gets cloudier.

Exports are getting weaker with a great deal of cancellations in recent weeks. You can imagine how some buyers might be inclined to cancel their orders for cotton from March when the price was around $2.20 a pound and now it is less than $1.50.

There are also more worries about a slowing U.S. economy as well as China trying to slow their economy. China and India are also expected to expand their cotton production in the upcoming season - the first and third largest cotton producers in the world, respectively.

Cotton is under pressure this week, as it is an economically sensitive commodity. The recent weakness in the stock market creates a tough headwind for cotton. December cotton, which is the new crop contract, is trading at $1.3050 a pound.

The market fell just below 1.15 in May and I would expect that to be a good value area for cotton. I wouldn't expect prices to fall much below there as long as drought condition prevails for cotton crops in Texas. If sentiment for the global economy turns for the better and stocks rally, cotton could have a nice rally.

Corn futures managed to set another record high even though many other markets were feeling pressure on Friday. July corn futures missed touching the $8 mark by one tick and are currently trading at $7.96 a bushel in the early afternoon.

Corn received more confirmation from the USDA yesterday that supplies are getting tighter for corn in the U.S. and globally. The USDA is now estimating demands to be 55 million bushels greater than production this year.

They removed 1.5 million acres of planted acres from the equation due to weather problems, but many analysts believe that number will grow. There were more than 5 million acres yet to be planted just a few days ago. They could get planted in time, but the odds are against them.

Corn acreage is being revised lower and now we have to worry about yields. More than 20 percent of the corn crop wasn't planted by May 22nd. Yields for corn tend to drop if it isn't planted by late May and especially in June. If things remain constant, yields will probably come in lower than estimated. Weather this season will be as important as ever.

More wet weather in the Midwest over the next week will cause problems with getting the final acres planted. Extreme heat in July could whip the markets into a frenzy as corn goes through its critical pollination phase. Heat stress at this time can reduce yields significantly.

There is also the chance that weather could be spectacular for the season and yields could be revised higher. For now, corn traders know there is no room for error this season and prices tend to rise under these conditions.

Coffee output to dip next season - but not by much

by Agrimoney.com

World coffee production will fall in 2011-12 – but not by much, supported by Brazil, which is expecting a record harvest for what is an off-season in its two-year cycle.
Typically, world output suffers a notable decrease when Brazil, the top producer, enters its off-year, with the decline nearing 9m bags between 2006 and 2007, for example.
However, next season output will fall only some 3m bags from that in 2010-11 thanks to expectations of a bumper off-season crop in Brazil, the International Coffee Organization said.
At 43.5m bags, the Brazilian crop "is the highest ever recorded for an off year", the organization said. Brazilian farmers have attempted to reduce the production cycle through measures such as irrigation, fertilization and pruning.
The ICO's world estimate of a 130m-bag harvest in 2011-12 represents the second-higher output ever, after the current season's production.
Nonetheless, it is likely to fall - again - below consumption, which hit 134.0m bags in 2010 and which the ICO said "continues to grow steadily, despite the firmness in prices".
Better prospects
The organisation added that, besides Brazil, some coffee growing countries are "expecting increased production if climatic conditions remain favourable".
The current elevated coffee prices "will encourage improvements in the upkeep of coffee farms in many other countries despite increased production costs".
However, the ICO also forecast "further falls" in Indonesia's output, which continues to be dogged by the effect prolonged rains which interfered with flowering, besides testing the country's infrastructure. Indeed, Indonesia is widely expected to return to Colombia third place in world coffee producing countries.
Output in second-ranked Vietnam, which produced 18.5m bags in 2010-11, will likely "stagnate" next season, the organisation said.
Discount narrows
The forecast came as the ICO reported a rare fall last month in the physical price of arabica beans. In the case of Brazilian natural beans, the decline was the first in at least a year.
However, robusta beans continued to appreciate, by 3.9%, narrowing their historically large discount to arabicas, which are generally considered of higher quality.
On futures markets, arabica coffee for July delivery added 1.1% 267.95 cents a pound in New York.
London robusta beans, for July, eased 1.3% to $2,431 a tonne.

See the original article >>

Cattle sending a clue to the S&P 500's future direction?

by Kimble Charting Solutions


Crude Oil is pushing support to its limits ...

by Kimble Charting Solutions


See the original article >>

Ugly Sixes

by Bespoke Investment Group

As we enter another trading week, below are two charts that compare the current S&P 500 six-week losing streak to the sixteen others that have occurred since 1928. As shown in the first chart, the decline of 6.79% over the last six weeks is quite a bit less than the average decline of 10.47% (black line) seen during the prior six-week losing streaks. As shown in the second chart, the S&P barely saw declines in weeks two, three and four of the current losing streak, but the last two weeks have been awful and worse than the average declines in weeks five and six of the prior six-week losing streaks.

As we noted last week, the S&P 500 has only had three 7-week losing streaks in its history. The last 7-weeker occurred back in March 2001, and the index slid 6.72% in week seven during that losing streak.


See the original article >>

Brent-WTI Spread Blows Out to Record Levels

by Bespoke Investment Group

There's been a lot of discussion recently regarding the Brent - WTI crude oil spread. For those unfamiliar with the term, the spread refers to the difference in price between Brent North Sea crude oil and the West Texas Intermediate crude oil futures contracts. While these two contracts have historically closely tracked each other, in recent months the two paths have diverged. As shown in the chart below, beginning in January Brent crude oil has started to become increasingly more expensive relative to WTI crude. In fact, at current levels the spread is now at record levels and over $20 per barrel.

What's behind the large spread in futures contracts that essentially track the same thing? While there does not seem to be one specific reason, some of the more widely circulated explanations for the widened spread are the unrest in the Middle East disrupting supplies in Europe, excess supplies in Cushing, Oklahoma (the delivery point for WTI), and decreased demand in North America while demand in other parts of the world is increasing. While any number of factors are in play with the wider spread, at some point it will become wide enough to make for a very profitable arbitrage.


See the original article >>

The corn and wheat dilemma

by Gary Kamen


Last week July corn opened at 754 and closed the week at 787. July wheat opened last week at 772¾ and closed the week at 759¼. We saw that the WASDE report released this past Thursday was bullish corn and bearish wheat. There is definitely no problem with wheat supplies both worldwide and here in the United States. Here in the United States, supplies are above the 10-year average. Not so for corn. The increased consumption by China is keeping corn prices high. China grows 46% of world stocks and will not be exporting corn. Increased production by China does not come close to their increased consumption.

 
COT Data

On the Commercial Tracker below you see that Commercials had a slight drop in net-shorts and an increase in net-longs in wheat. With July corn almost 30 cents higher than wheat, livestock feeders could decide to replace a large portion of corn with wheat to bring down costs, increasing wheat demand and decreasing corn demand. If corn continues moving higher, there is no doubt that is exactly what will happen, so keep an eye on September (old crop) and December (new crop) corn. If we see new crop strongly moving up, you will want to keep an eye on how the feed market responds, especially because meat prices have come down. 


Commodity
12-mo low
12-mo hi
10-Jun
3-Jun
Cattle (feed)
-1,290
7,100
4,683
4,038
Cattle (live)
-73,179
2,046
2,046
-2,028
Hogs
-35,979
19,456
19,456
18,152
Corn
-413,915
119,389
-387,283
-395,045
Oats
-7,738
-867
-4,990
-4,554
Soybeans
-203,260
29,118
-112,280
-100,113
Soybean meal
-90,487
-32,915
-66,035
-47,366
Soybean oil
-117,444
32,394
-87,714
-74,009
Wheat
-32,577
74,161
15,534
3,103
Orange juice
-20,205
-6,588
-20,205
-19,463
Coffee
-47,729
-16,418
-16,418
-20,434
Cocoa
-41,808
8,586
-6,136
-9,605
Sugar
-221,694
-104,595
-123,748
-109,638
Cotton
-69,857
-12,970
-34,758
-36,258
British pound
-66,435
66,514
-7,171
-3,837
Canada dollar
-115,190
-13,109
-36,708
-59,332
Euro FX
-124,855
83,486
-59,176
-28,289
Japanese yen
-52,533
76,983
-12,461
8,687
Swiss franc
-42,387
23,460
-29,746
-33,121
US dollar index
-24,676
14,003
-5,517
-8,607
Mexican Peso
-140,414
-14,488
-96,395
-115,323
Australian dollar
-110,025
-10,793
-79,855
-78,193
S&P 500
-88,893
33,981
-55,890
-77,473
T-note -10 yr
-74,761
229,611
62,061
130,308
T-bond -30 yr
-43,324
88,803
6,676
10,601
Eurodollar
-1,179,414
81,781
-392,482
-261,942
Crude oil
-319,669
-25,439
-207,579
-219,619
Heating oil
-66,097
7,568
-45,946
-40,255
RBOB Gasoline
-85,987
-10,453
-62,224
-57,944
Natural gas
109,696
228,910
109,696
130,610
Copper
-36,201
1,793
-8,548
-7,533
Gold
-302,740
-193,197
-247,684
-240,508
Platinum
-34,909
-15,759
-27,239
-25,318
Silver
-65,413
-33,328
-33,328
-34,323

Commercial Net Tracker instructions: This form tracks the Commitment of Traders (COT) data for the commodity futures market. This form "looks" at the most recent five weeks of COT data and provides visual indications of the data. A) If the current value is at a 12-month low, the cell will display a red/burgundy background. B) If the current value is at a 12-month high, the cell will display a green background. C) If the current value went from net negative to net positive, the cell will display a blue background (indicating a bullish condition). D) If the current value is both a 12-month high and also went from a net negative to a net positive, the background will be green. You should view the data with green backgrounds to determine if they also went from net negative to net positive.

If you need help understanding how to understand how to use the COT report to your benefit, please email me at Gary@crbtrader.com and put COT report in the subject line. Please include your name and telephone number in the email.

Fundamentals

Corn prices surged to an all-time nearest futures high of $7.93 a bushel after the USDA lowered its U.S. corn production estimate and cut its U.S. and global carry-over estimates.

Bullish factors include:
  1. The USDA’s June 9 cut in its U.S. corn production estimate for this year to 13.2 billion bushels from last month’s estimate of 13.505 billion bushels as wet weather cut planted acres to 90.7 million from a May estimate of 92.178 million.
  2. The USDA’s June 9 cut in its 2011-12 U.S. carry-over estimate to a 15-year low 695 million bushels from a May estimate of 900 million and the cut in its global corn carry-over estimate for 2011-12 to 111.89 MMT from a May estimate of 129.14 MMT.
  3. IGC’s prediction that global corn inventories will fall to 111 MMT in 2011-12, or about 13% of consumption, the smallest stocks-to-use ratio since 1974.
Bearish factors include:
  1. Speculation that livestock producers will switch to wheat from corn for their feed needs as the price of wheat has fallen to its cheapest relative to corn since 1984.
  2. The USDA’s May 11 cut in its 2012 U.S. corn export forecast to 1.8 billion bushes, a nine-year low, as record high prices erode foreign demand.
Wheat prices fell to a three-week low, but remain within a wide six-month $2.37 a bushel range.

Bearish factors include:
  1. The USDA’s June 9 hike in its U.S. winter wheat production estimate to 1.45 billion bushels from a May forecast of 1.424 billion.
  2. Harvest pressures after the USDA reported that 10% of the U.S. winter wheat crop was harvested as of June 5, higher than the five-year average of 6%.
  3. The resumption of Russian wheat exports starting July 1.
Bullish factors include:
  1. The USDA’s June 9 cut in its 2011-12 global wheat production estimate to 664.3 MT from 669.6 MT in May along with the cut in its U.S. carry-over estimate to 687 million bushels from 702 million in May.
  2. The prediction from Shanghai JC Intelligence that China may double its wheat imports this year to about 3 million tons as drought cuts its wheat output this year to 96.5 MT, below the 115.5 MT predicted by the USDA.
  3. The action by the IGC to cut its global wheat production estimate for this year to 663 MMT from a May forecast of 667 MMT.


See the original article >>

Follow Us